USDCAD longA potential fake out scenario on USDCAD, where price is ranging in this falling wedge.
But instead of a breakout scenario, we could see a fakeout on the downside, which brings price to a local demand zone and might offer a scalp up for a long.
WHEN

smol $BABYDOGE TA *(with targets!)* 🐕HI fren :D here are the 🆙targets for our pretty nu lil pupper $BABYDOGE coin 🐕 sized for your nice smart📱phone 4sure in the comment 🤩😎 And many happy luck trade wishes 2u lol #doggonacci

Silver is down on the week but may be setting up...Silver is down on the week, but it's driving back into buying territory. It's also the end of the month when silver prices typically get pushed down in order to make expiring contracts cheaper. Next week starts with a new month, which tends to be optimistic for silver. This plus the buying territory makes it likely that silver will have an uptrend especially at the beginning of next week. If you can imagine that on this chart, you can see that it's then beginning to form a reverse head-and-shoulders pattern - which is typically very bullish. That's all for now.
This is not financial advice.
Want to try trading your own allocated silver with cryptos on one platform? Or gain yields on metals you hold? Then you may want to check out Kinesis: kms.kinesis.money

Reverse Cup and Handle Forming for BTC?There is a mean arc forming on the top of the bitcoin chart as you can see here. It could be the beginning of a reverse cup and handle, which would be very bearish. At this point BTC would need to rally AND break 50k resistance in order to break this formation. Does not look good. However it's the cryptoverse where amazing things CAN happen... but sometimes it takes another 4 years. What do you think?


When is the best time to buy Bitcoin?This is the most important question that all my students and individuals ask me
It should be noted that there are several scenarios to complete the bitcoin reform, but the most likely, as shown in the chart, is the return of bitcoin from the above price.
Be sure to wait a while to enter Bitcoin trading transactions
If you enter at a higher price and lose a little profit, it is better to enter incorrectly.
I hope you like this analysis.
Please like this post to support us and follow us
Leave your comments, suggestions and criticisms with us in the comments section
Hamid Mojarrad : Lecturer, analyst, trader and senior consultant to reputable investment companies

Be very careful of Stellar !!!Stellar !!!
As you can see, it is very likely that Stellar has completed its Wave 5 and is at the beginning of the correction.
If this scenario occurs, the probability of a price reduction to 0.27 is very high, and after the price reaches 0.27 and the start of a new uptrend, a profitable trade can be started on Stellar.
I hope you like this analysis.
Please like this post to support us and follow us
Leave your comments, suggestions and criticisms with us in the comments section
Thanks alot ; Hamid Mojarrad : Lecturer, analyst, trader and senior consultant to reputable investment companies

ES : YOU THINK THIS IS A GAME????me too
in my head trading is literally like playing three games at once
it's hard to play 3 games w/ too many pieces on the board
soooooo, whenever I'm not sure, I take all the pieces off each board
and restart
at the end of the day
it's not about winning the games
it's about not losing
:)
my only 'pieces' I remain bullish on are UVXY (volatility in general), SPCE (just the space industry in general, honestly )
energy, health care, gold, & blockchain (not BTC)
oh n covered that pton short
doubled down this AM
.... sheeessshhhhh
still think there's more downside eventually but I've made more than my fair share
only reason I wasn't worried was because they were the acquiring company in their latest acquisition
even so, when you get a knife like that 90% it's best just to leave, at least in my opinion
not a soul is hedging over there though, which is why I could see more downside to come soon being more likely than not
from here on out! only the best will survive
just remember folks!
there's no need to win
just don't lose
<3
& that sure doesn't look like a 'buy' set up to me ...
I can still see this dragging out for a while,
but if we close below 365 on SPY EOM...
I'm sure we won't have to wait much longer
:D
I'm personally gonna take a little break on posting here to do some more preparations!
until then,
GL!

APPN wait for correction or ride to next resistance 25% upsideAPPN approaching previous resistance. Tracking for entry opportunity. Will either form new support or get rejected down to previous support with a 10% pull back.


Bitcoin - Buying Level GuidePersonally, I've held Bitcoin throughout the entire bear-market, so I'm in no rush to buy more. However, seeing as we're at a critical juncture right now regarding BTCUSD, it doesn't hurt to have a plan in mind for when next to dollar-cost-average or buy aggressively.
The chart shows where I believe bitcoin could go in the coming months, and I've indicated where my buy-points would be. I would buy at those points to maximise my upside potential. However, since bitcoin bull-runs are long and endless, it is best to combine this strategy with a regular DCA strategy.

Bitcoin - DCA Guide (Dollar Cost Averaging)I've found that the Bollinger Bands that I use for investing in the stock market, also do work well for Bitcoin on the weekly chart.
In addition to just regular dollar-cost-averaging (DCAing), you can also purchase BTCUSD aggressively when the RSI falls below 40 and/or price goes below the lower Bollinger Band.
I do not however recommend taking profit at the upper Bollinger Band. This is because when Bitcoin again goes on it's raging-bull / moon-run rampage, it will disrespect both the upper Bollinger Band, and the RSI.
This strategy is best used as a companion to regular DCA methodology.
Note: Disregard the strategy performance chart below, as the Bollinger Robot is not tuned to buying crypto - so there are insufficient orders for the performance chart to show.

VIRUS was TREND ANOMALYI made this chart at the end of 2019, It has played out correctly....SHORT OF A VIRUS HAPPENING...
After the Election in the USA, we are likely to see the world change.
Odd are in the favor of FREEDOM...we'll see...
END OF DECEMBER 2020... BTC LONG TERM TRENDLINE will break ABOVE the JUNE 2019 recent HIGH...
AFTER THAT... WE SHOULD BREAK THROUGH 20K LIKE BREAKING THROUGH PUDDING.
EASY HYPERBOLIC JUMP TO 170K-200K!!!!!
THIS WILL CHANGE THE WORLD FOREVER.
And all the CRYPTO PROJECTS that are SECRETLY BEING CREATED RIGHT NOW...
Will MAGICALLY APPEAR... TO SELL YOU THEIR COINS AT HIGH TICKET PRICES...
Obvious STRATEGY...
Expect BIG CREDIT CARD COMPANIES TO ALL RELEASE THEIR CRYPTO REWARDS CARDS INSTEAD OF TRAVEL CARDS.
Dollars, Mortgages, Interest Rates, Worldwide Commerce, WILL ALL CHANGE.
hopefully we build FREEDOM, and not TYRANNY.
USE CRYPTOS FOR GOOD, not evil.

The Outsider"‘Under what fatal star was I then born,’ I asked myself, ‘for it now to be impossible for me
even to think of following the smallest inclination to virtue without its being immediately
washed away by a tide of woe! And how can it be that enlightened Providence, whose justice I
willingly adore, punishing me for my virtues, simultaneously offers me the spectacle of those
whose vices brought me low being raised on high to pinnacles?"

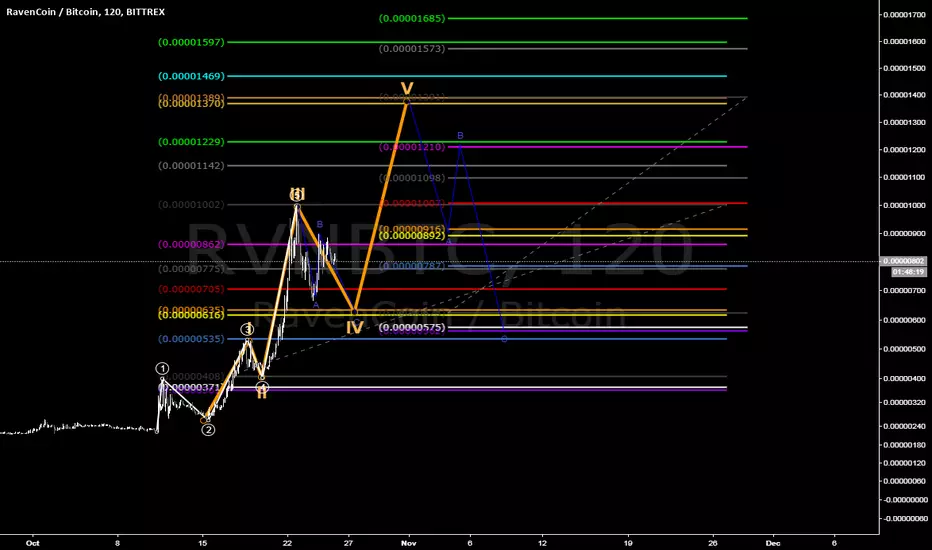
The Complete Battleplan. FRONT NEWS!Finally the rally price action proved previous forecasts to be true(ish).
The question everyone is asking - when does the rally end?
I've carefully mapped out all four basic bullish scenarios I can see in this market.
We're about to see at least one deep correction model that will retrace 15-40%
of the typical 12345 impulse, if it is finished(if so, then bulls will rest for a day or two,'
observe the battlefield, confirm the price stability).
I suggest 4 basic scenarios, all bullish. So DON'T panic,
one deep correction may easily form allowing the bulls to quickly replenish
lost soldiers and bring even more fresh whale buy-ins to our party!
I've tried to consider all major res/supp levels and the common time lengths
that suggested correction models commonly feature for BTCUSD(to the best
of my analogish brain judgement).
Chart tells you everything you need to know:
two most probable scenarios are all mapped-out with the consideration
of known levels.
I also suspect that the FOMO is great right now and the current impulse has
a lot of driving force left to continue surging up to 8.8k+ without and deep retraces.
I vote for THE MOST PROBABLE SCENARIO I. (subgroup II. is as probable as I.)
Do you?
The bigger picture can be observed in the related ideas... below...
They are all parts of the same market analysis.

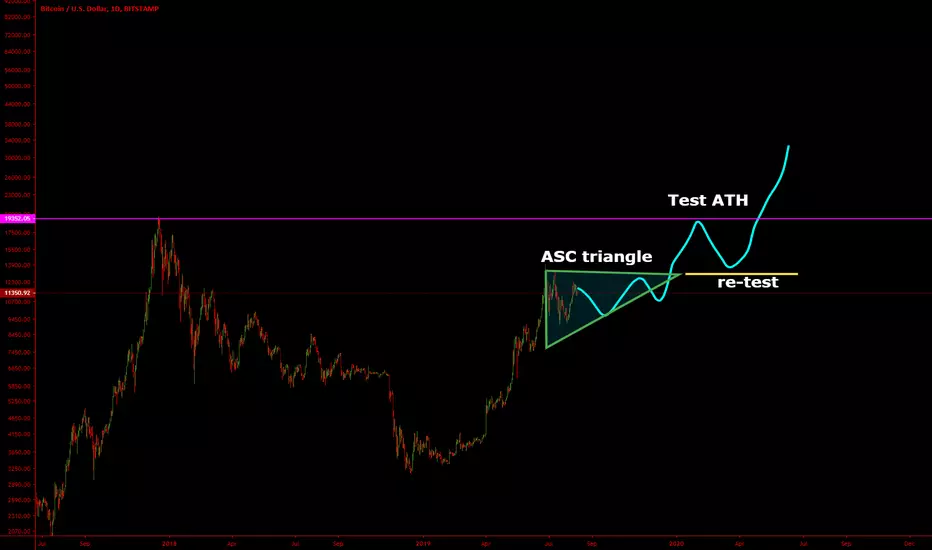
Bitcoin has entered re-accumulationHere is my guess on how bitcoin will move the rest of 2019. I think we have entered re-accumulation / consolidation.
In the previous bull run, somewhere just after the start, we also entered re-accumulation, see my image below:
I think the pattern we are in right now is a bit similiar. So this means no big moves until nov/december, I think the next rally will bring us to atleast 20k. After 20k is tested a support re-test is very likely if we breakout from an ascending triangle.
Anyway, my 2 cents, gl & hf
A bullish yellow brick road down to 8,200$? Will we see 7.5k?BTC has broken out to the upside from that big falling wedge with one last troll fake-break above 10k and then promptly reversed and fell down even lower than last time, and in doing so at exactly the right time and price it created a resistance line that is exactly parallel to the support, making an beautifully perfect downtrend channel down to that big support level of what could potentially be one of the largest bull flags ever in bitcoin, at around 8,200$.
If this support is not broken this pattern might very well take us back up to break the 14k high and maybe then finally test the 20k all time high once more, after it breaks out in the coming weeks or months.
What do you think?
Will BTC fall right through all of these supports to 6k or 4k or 2k?
Will it continue to test the support of the flag down at 7.8k or 7.5 and then break out to to 20k?
Leave your thoughts in the comments below!


Ascending triangle forming on btc, Still bullish.Price has consistently failed to break the 11.1k level on the daily.
Ascending Trinagles are a bullish chart pattern - We saw one forming back when btc was in 4k area, Now its forming at the the current price range of 11k-13k.
IF it breaks above we could be looking at bitcoin TESTING ALL TIME HIGHS!
But nothing is certain in trading - So DYOR as well!
Main level to be aware of 11.1k We close below this level on the daily for any reason - This trade idea would be invalidated.
Wish you all good trading and profits!

ATOM/BTC bullish might moonOnly for educational purposes only – not financial advice. Fibo levels lookin dank. Only bad thing is the uptrend of bitcoin dominance (CRYPTOCAP:BTC.D), which refrains me from entering too much. Stay cautious!

[AUDNZD] THOUGH FOR BULLISH?Previous H4 big bull trend bar shows the absolute strength of the bull side, why wouldn't we follow the absolute strength? Seems like free money though.
I don't think it is that easy because at the moment pf this post price is still going down, we don't really know when upside will be back but we know the zone where it likely and many people will see too. My thought is waiting a signal bar show the very strong signature that bull side back and then it will be our entry.
What do you guys think?