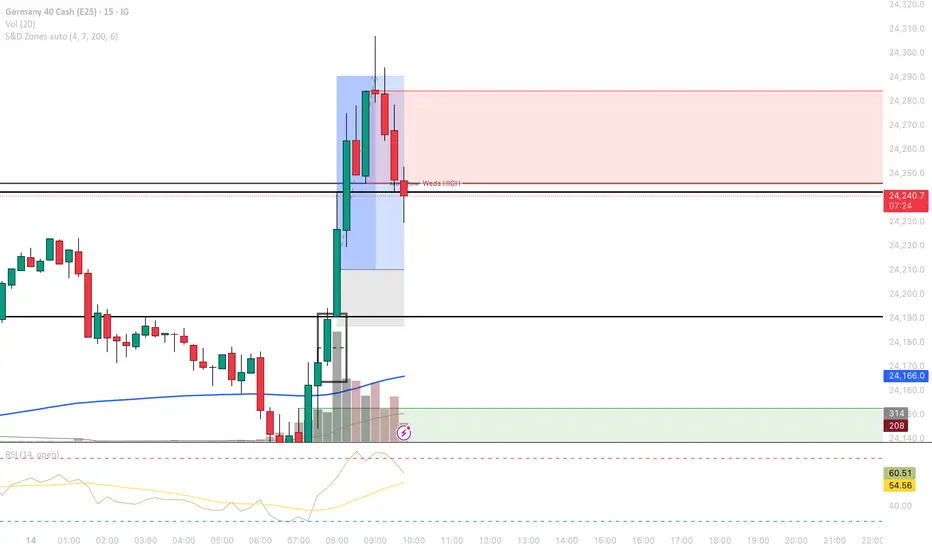
EURJPY PROFITS Eurjpy recap trade, it’s hit (TAKE PROFIT) and now can relax and what for what’s to come next but shall keep following the trend
Winrate

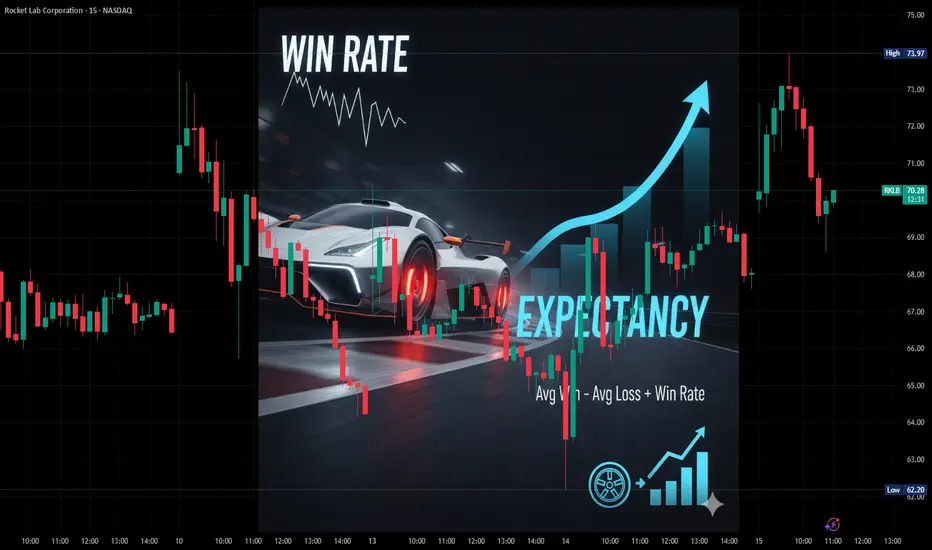
Why Win Rate Lies: The Metric That Keeps Traders BrokeWhy Win Rate Lies (and What to Measure Instead)
Everyone loves a high win rate. Every newbie dreams of having a 75%+ success rate.
But here’s the trap: your win rate only tells you how often you’re right, not how much you make when you are. Even worse, focusing on win rate puts you on the wrong path: trying to predict outcomes instead of focusing on what really matters: being profitable.
Let’s dissect this a bit.
As a quantitative trader, I know I can design hundreds of systems with a 75% win rate. It’s simple: take frequent, small profits and place wide stop losses. Voilà, your win rate looks great on paper.
The problem? Those small wins can’t save you when that one big loss hits. The math doesn’t forgive.
Building a truly profitable system is much harder, because you need to balance the trade-off between win rate and risk/reward. A system that wins often but loses big doesn’t have an edge, it just has good marketing. See the futility in chasing high win rates?
The real path is focusing on expectancy.
Expectancy not only accounts for win rate but also includes your average win and average loss, capturing the critical balance between how often you’re right and how much you gain or lose when you are.
Chasing a high win rate is like designing a race car and spending all your money on the engine. It’ll hit top speed on the straights (your wins), but without investing in decent brakes, you won’t look so great when the first corner arrives.
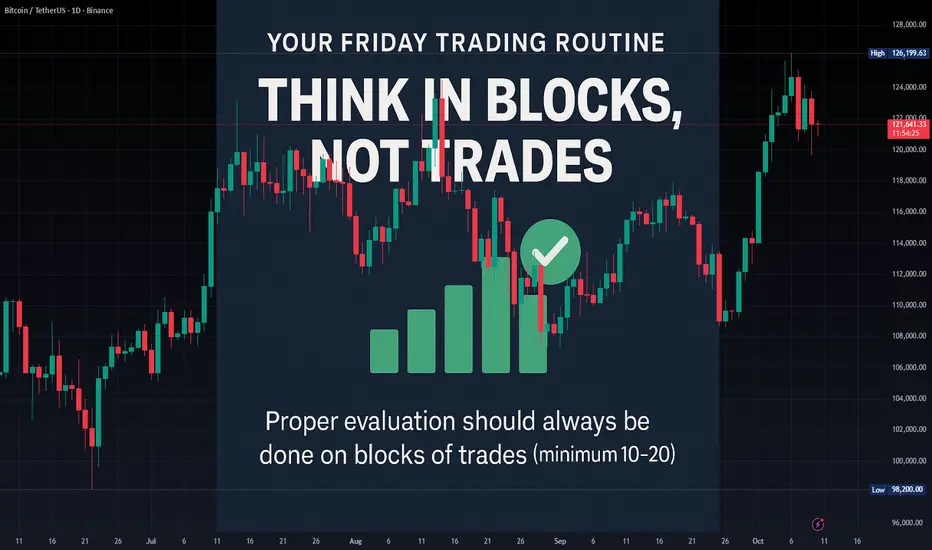
The Process Notebook #1 — The Successful Trader’s RoutineThe Successful Friday's Trader Routine: Evaluate but Think in Blocks, Not Trades
Another trading week is about to end. For most traders, Friday means checking wins and losses. For professional traders, it means evaluating the system.
💡 Remember: a single trade means nothing.
Proper evaluation, to avoid emotional bias caused by variance, should always be done on blocks of trades (minimum 10–20).
But here’s the real twist: If you’re judging your system only by Win Rate (WR) or Reward-to-Risk (RR)… you’re missing the real picture.
A robust trading system needs to be monitored through a small set of key metrics that reflect not just how much you earn, but how consistent and reliable your edge truly is.
Here’s the minimum you should be tracking 👇
📈 Return Metrics (How much your system makes)
Expectancy (average return per trade): quantifies the true profitability of your edge.
CAGR (Compound Annual Growth Rate): shows long-term compounding efficiency.
Payoff Ratio (avg win / avg loss): evaluates quality of your wins vs. losses.
📉 V olatility & Risk Metrics (How stable your system is)
Standard Deviation of Returns: measures the variability of your outcomes.
Max Drawdown: identifies the deepest pain your account can face.
Recovery Factor (Net Profit / Max DD): shows resilience and system efficiency.
⚙️ Consistency Metrics (How repeatable your process is)
Sharpe Ratio: return per unit of volatility — higher = more efficient risk use.
Win/Loss Streak Distribution: reveals your emotional endurance threshold.
Trade Frequency Stability: checks if your system behaves consistently over time.
🧠 Why this matters
When you evaluate your trading in blocks (using statistics, not emotions), you detach from the noise and connect with your system’s real performance.
You stop judging yourself trade by trade… and start thinking like a risk
manager.
How do you evaluate your system — by emotion or by metrics?
The 7 Killers That Make You Lose Money in TradingTrading isn’t easy; in fact, it’s one of the most complicated ways to make money in the financial world.
I know that’s not what the mainstream narrative tells you. The same narrative that warns “more than 90% of traders lose money” also sells the illusion that you’ll be part of the 10% who don’t, because deep down, we all think we’re different, smarter, faster, more capable than the crowd.
But if you strip away emotion and bias and read that statistic correctly, it’s a harsh truth: you have less than a 10% probability of long-term success. That’s not pessimism; that’s probability. And probability doesn’t lie. Every day, it quietly proves that most “special” traders end up broke, not because markets are unfair, but because they misread the numbers that could have saved them.
After more than 20 years in this game, I’ve noticed one thing every losing trader has in common: they ignore what’s painfully obvious. Trading is numbers in an uncertain world.
Numbers mean math. Put math in an uncertain environment, and the only way to handle it is through probability. Yet most traders fight this reality, chasing signals, news, or “gut feelings” instead of learning how probability actually runs the game.
After working with hundreds of losing traders, I found that this blindness leads to seven recurring mistakes: the same ones that keep the losing rate stuck above 90%.
1. Mistake: Trying to Predict Instead of Projecting
The moment you believe you need to know where the market’s going, you’ve already lost your edge. By definition, the future is uncertain; anything can happen. No system or algorithm can change that.
The game changes when you stop trying to predict what the market will do and start projecting how your account will behave under uncertainty. It’s not about guessing direction; it’s about managing outcomes.
Probability reminds us that uncertainty isn’t our enemy, it’s our playing field. Without it, there would be no opportunity. Don’t focus on prediction; learn to handle what the market does and control its impact on your account value.
📖 Referenced posts: “In a World of Chances, Probability is the King” and “The True Laser Vision in Trading.”
2. Mistake: Judging Success Trade by Trade
If you judge your system by a single trade, you’re missing the point. Trading isn’t a sprint; it’s a marathon. Your edge doesn’t live in one trade, it appears in the average of many.
Focusing on each result drags you into an emotional roller coaster, the highs of winning and the lows of losing. In reality, you’re not reacting to truth; you’re reacting to variance, and variance loves to mislead.
The real measure of your system (your expectancy) doesn’t care about your last trade. It only reveals itself after enough repetitions, as the law of large numbers smooths out noise and exposes your true average performance.
If you want peace of mind, stop zooming in on the moment. Zoom out and focus on the mean, the expected value of your account. That’s the mindset that turns emotions into data and chaos into clarity.
📖 Referenced posts: “Sharpening Your Trading Focus” and “Spying on Your Trading Future.”
3. Mistake: Not Accepting Losses as Part of the Process
I’ve seen it countless times: new traders obsessed with their win rate. Almost every candidate I’ve mentored asks the same question before hiring me: “What’s your winning rate?”
And I get it. In a world obsessed with prediction, it feels natural to think accuracy equals success. But that’s where I correct them: we’re not here to predict; we’re here to make money.
Instead of asking how often a trader is right, ask, “How much money does he keep after losses?” That’s the question that shifts focus from ego to expectancy, from being right to being profitable.
📖 Referenced posts: “Decoding Trading Odds: Demystifying Probability”.
4. Mistake: Misjudging Probability as Too Complicated
Many traders avoid thinking in probabilities because they believe it’s too mathematical. They prefer indicators because they seem easier and more visible. I get it, not everyone loves math. But in trading, probability isn’t complex theory; it’s practical logic.
Think about predicting the weather. When you see a small gray cloud, you don’t say, “It will rain.” You say, “It might rain.” That’s probabilistic thinking: assigning likelihood instead of claiming certainty.
Trading works the same way. Every trade is its own weather forecast. You can’t predict what will happen, but you can estimate what’s likely and prepare for both outcomes. Once you see probability as a decision framework, you stop reacting emotionally and start thinking strategically.
📖 Referenced posts: “In a World of Chances, Probability is the King” and “Decoding Trading Odds: Demystifying Probability.”
5. Mistake: Overleveraging Your Edge
Even with a profitable system, betting too big turns strategy into suicide. Leverage doesn’t just multiply gains; it magnifies mistakes. I’ve seen many good traders destroy solid systems because they couldn’t stay anchored to steady, safe growth. They wanted to accelerate the curve.
But here’s the truth: every time you increase position size, you also increase your risk of ruin exponentially. Great traders know success isn’t about how fast you can grow, but how long you can keep growing.
It’s even worse for traders who don’t know if they have an edge at all. Leverage in the wrong hands is like a driver who thinks that because he can handle a Tesla, he can drive an F1 car. He’s not compounding; he’s just going to hit the wall faster.
And the market knows that. That’s why those aggressive leverage offers exist, they want your money fast.
Knowing how to play the long game is the real alpha.
📖 Referenced posts: “Spying on Your Trading Future” and “Risk Management: The Engine of Expectancy” (upcoming).
6. Mistake: Misunderstanding Variance and Calling It Bad Luck
When things go wrong, most traders think they’re bad traders, or they blame their system and rush to replace it. Or worse, they believe the markets are rigged. In reality, they just don’t understand variance.
Variance is when you take three losses in a row despite perfect setups. It’s not betrayal or bad luck; it’s randomness doing its job. Every system has a natural distribution of wins and losses, and they’ll always appear randomly. Sometimes you’ll win, sometimes you’ll lose. No rule or model can predict exactly when. That’s not broken; that’s just markets being markets.
Neither streak defines your edge, they’re both part of the math. That’s why only expectancy can tell you if you have an edge or just luck.
When traders don’t understand variance, they take it personally. A losing streak feels like punishment; a winning streak feels like mastery. Both are illusions. Expectancy, the expected value of your account, doesn’t care about your feelings. It only reveals your edge over a large enough sample, when randomness smooths out and the real average emerges.
Accept variance as part of the process and trading becomes calmer, simpler, and much more rational.
📖 Referenced posts: “Spying on Your Trading Future” and “Sharpening Your Trading Focus.”
7. Mistake: Replacing Numbers and Logic with Dopamine and Emotion
One of the hardest habits to break in new traders is their need for dopamine. Many don’t come to the market to trade; they come to feel something. They treat trading like entertainment — constant stimulation, adrenaline, and fast feedback.
A typical beginner believes trading means dozens of short-term trades per day, with stops and targets hit constantly, like scrolling through TikTok. Each trade becomes another “like,” another hit of excitement.
I often tell my students, “If you’re here for entertainment, go to the cinema, or better yet, go to Las Vegas. It’ll cost you less, and you’ll leave happier.”
Trading isn’t a game of dopamine; it’s a game of data and probabilities. The more you chase emotional highs, the further you drift from logic and expectancy. When you trade emotions instead of numbers, you stop trading your system and start trading your mood.
📖 Referenced posts: “Sharpening Your Trading Focus” and “The True Laser Vision in Trading.”
Bonus: Trusting the Wrong Sources
Here’s an uncomfortable question: if 90% of traders lose money, what are the odds that most trading education actually works?
If we apply probability to information itself, we’d infer that 90% of the “trading wisdom” online is more likely to produce losses than profits. In other words, there’s a 90% chance your guru is wrong. And that’s before considering how many truly successful traders never share what really works.
So ask yourself: if most people fail, does it make sense to follow what most people do? There’s no formal proof for this, but after two decades in the game, I’ve seen the pattern repeat endlessly. The crowd follows the same noisy ideas... and the crowd loses.
It may not be a comfortable truth, but sometimes the truth that shocks you is the one that sets you free.
Final Thought
Most traders don’t lose because they lack talent; they lose because they fight probability instead of using it. Trading is uncertainty made measurable — a game of math, mindset, and patience.
Learn to think like a risk manager, not a fortune teller.
And remember, if you’re here for entertainment, go to Las Vegas. It’ll cost you less, and you’ll probably leave happier.
Throughout this post, I’ve referenced other entries that explore each of these mistakes in more depth. They’re all part of the How To Lambo series, where I keep breaking down the probabilistic view of trading in plain language: practical, rigorous, and free of jargon.
If you haven’t read them yet, I highly recommend starting with “Probability is the King” and “The True Laser Vision in Trading.”
The #1 Trading Skill: Controlling Your RiskThe secret to trading isn’t winning every trade - it’s about managing risk.
Risk management and trading. This is one of the most important topics if you’re
serious about becoming a profitable trader. Risk management is the foundation of trading. If
you don’t manage your risk you won’t make it. Simple as that.
No one can predict whether the market will go up or down with 100%
certainty. That’s why as traders we can never fully control how much profit we make. But we
can control one thing. How much we lose. And that brings us to the first step in risk
management. Understanding the power of the risk-reward ratio.
When choosing a trading strategy that suits you one of the factors to consider is its risk-reward
ratio. Every strategy has its own balance between risk and potential reward and understanding
this is key. This is where we need to put our math brains to work.
What is the risk-reward ratio? Simply put it tells us how much we stand to gain for every unit
of risk we take. It’s a straightforward but powerful metric that helps determine whether a
strategy can be profitable over time.
Let’s break it down with a simple example:
• If your strategy has a 1:1 risk-reward ratio it means that for every $100 you risk you
aim to make $100 in profit. Win or lose the potential gain and loss are the same.
• If your strategy has a 1:2 risk-reward ratio you risk losing $100, but if the trade goes
your way you make $200. This means your potential reward is twice as big as your risk.
• If your strategy has a 1:5 risk-reward ratio for every $100 you risk you have the
chance to make $500. Here the possible reward is much greater than the risk you take.
Your risk-reward ratio has a big impact on your overall profitability. But the risk-reward ratio
alone doesn’t tell the full story. To know if a strategy is truly profitable you also need to
consider another key factor: Win rate.
Your win rate is the percentage of trades that end in profit. This is where math and probabilities come into play.
• If your strategy has a 50% win rate it means that out of 10 trades 5 are winners and 5
are losers.
• If your win rate is 40% 4 out of 10 trades will be profitable.
The key to long-term success is finding the right balance between risk-reward and win rate.
• If you have a 1:1 risk-reward ratio and a 40% win rate your strategy won’t be
profitable. Over 10 trades you win 4 times and lose 6 times. Since you win and lose the
same amount per trade your losses will be bigger than your gains in the long run.
• But with a 1:5 risk-reward ratio and the same 40% win rate your strategy becomes
profitable. That’s because your winning trades make far more than you lose on your
losing trades.
The takeaway? There’s no such thing as a right or wrong strategy only ones that are profitable
or unprofitable. The key is to find a strategy that gives you a mathematical edge over time.
DAX ORBAnother beautiful dax ORB moment. Dax continues to impress with its amazing ORB movement and rarely fails, allowing good rr and high win rate. Easiest strategy EVER!
Understanding R/R and Win Rate: The Key to Profitable TradingWhy R/R and Win Rate Matter❓
What’s the one thing that separates consistent traders from those stuck in a cycle of losses? It’s the combination of Risk-to-Reward (R/R) and Win Rate. These two metrics aren’t just numbers—they’re the foundation of every profitable trading strategy.
Today, we’ll break down the facts and numbers behind R/R and Win Rate. You’ll learn how to evaluate whether your strategy is sustainable and why high win rates alone might not be enough. Let’s dive in!
🔍 The Relationship Between R/R and Win Rate
This chart tells the story: your R/R ratio determines the percentage of trades you need to win to break even. But let’s be clear—breaking even isn’t our goal. We aim for profitability, and that’s only possible when your R/R and Win Rate are optimized.
Here are some key examples:
R/R = 5:1 (High Risk, Low Reward):
Out of 100 trades, you need to win 98% just to break even.
One or two losses can wipe out all your profits.
Conclusion: This is unsustainable.
R/R = 1:1 (Balanced):
To break even, you need to win 50% of your trades.
While this ratio is popular, achieving consistent profits requires a Win Rate over 80%, which is challenging.
R/R = 1:2 (Ideal Minimum):
You only need to win 33% of your trades to break even.
With a 50-60% Win Rate, your profits can grow exponentially over time.
Conclusion: This is the most realistic and effective ratio for both beginner and professional traders.
Common Misconceptions About High Win Rates
Many traders mistakenly equate high win rates with profitability. While a Win Rate of 80% might sound impressive, it can still lead to losses if paired with poor R/R.
Example:
Imagine a trader whose win rate is 80%, but their R/R is 5:1. Those 20% losing trades will erase all profits. This is why it’s crucial to analyze both metrics together and not get distracted by flashy results.
The Psychology Behind R/R and Losing Streaks 🧠
Losing streaks are inevitable, even with a solid strategy. What matters is how your R/R and mindset help you navigate them:
The Role of R/R in Losing Streaks:
With an R/R of 1:2, even after a streak of 5 losses, a single win can recover your account.
On the other hand, with an R/R of 5:1, a losing streak can wipe you out entirely.
Mindset Tip:
Don’t fear losses. Instead, focus on executing your strategy consistently. Understand that a few losses won’t hurt your account if your R/R is optimized.
Crafting a Sustainable Strategy 🔧
Here’s how to create a strategy that balances R/R and Win Rate:
Step 1: Define Your R/R
Set a minimum R/R of 1:2 for your trades. This ensures that even with a 40% Win Rate, you remain profitable.
Step 2: Backtest Your Strategy
Test your strategy on historical data to calculate its true Win Rate. Adjust your R/R based on the results.
Step 3: Manage Risk Effectively
Never risk more than 1-2% of your account per trade. This minimizes the impact of losing streaks and allows for long-term growth.
💬 What’s your R/R ratio and how do you manage losing streaks? Share your insights in the comments below!
I’m Skeptic , dedicated to simplifying trading and helping you achieve mastery step by step. Let’s keep growing together! 🤍

GOLD 30m CHART ROUTE MAP & TRADING PLAN FOR DAILYGold (XAU/USD) Outlook for the Upcoming Week:
The outlook for XAU/USD in the coming week depends on a combination of technical, fundamental, and economic factors, including the Federal Reserve's policy, economic data, and the strength of the U.S. dollar. Here's an analysis based on the provided chart:
Technical Analysis:
Overall Trend:
The chart shows a medium-term uptrend, with higher highs and higher lows forming.
A small pullback is observed toward the end of the chart, which could potentially act as a retracement before resuming the uptrend.
Key Levels:
Support Levels:
$2,700 is the nearest support level.
A deeper support is located at $2,685.
Resistance Levels:
Immediate resistance lies between $2,715 and $2,720.
A breakout above this zone could push prices toward $2,735.
Indicators (if applicable):
Indicators such as RSI or MACD (not shown in the chart) can confirm whether gold is in overbought or oversold territory. If RSI is above 70, it might suggest selling pressure could emerge soon.
Fundamental Analysis:
U.S. Economic Data:
Key economic releases, such as inflation data (CPI) or employment reports, could influence the dollar. Weak U.S. data typically supports gold prices.
Federal Reserve Policy:
Any dovish signals from the Fed, such as reluctance to raise interest rates further, would be bullish for gold as a non-yielding asset.
Geopolitical Risks:
Heightened geopolitical tensions could increase demand for gold as a safe-haven asset.
Forecast for the Week:
If prices hold above the $2,700 support level and break the $2,720 resistance, a continuation of the uptrend is likely.
Failure to hold $2,700 could lead to a decline toward $2,685 or even $2,665.

4. e-Learning with the TradingMasteryHub - Risk Management 1x1🚀 Welcome to the TradingMasteryHub Education Series! 📚
Are you looking to level up your trading game? Join us for the next 10 lessons as we dive deep into essential trading concepts that will help you grow your knowledge and sharpen your skills. Whether you're a beginner or looking to refine your strategy, these lessons are designed to guide you on your journey to better understand the markets.
📊 Manage Your Risk with These Three Simple Methods!
In trading, managing risk effectively is crucial to long-term success. Even the best strategies can fail if risk management is ignored. In this session, we'll explore three key methods that every trader should master to protect their capital and stay consistently profitable.
1. Position Sizing: Trade Smart, Trade Safe
Position sizing is the foundation of risk management. I always set a daily and weekly stop-loss limit to ensure that I can recover mentally and financially from any losses. My daily stop-loss is capped at 5-10% of my entire trading account, and I never risk more than 30% of that daily limit on a single trade.
Each trade's risk allocation depends on the quality of the opportunity:
- 5-star setups: Up to 30% of the daily stop-loss.
- 4-star setups: Up to 15% of the daily stop-loss.
- 3-star setups: Up to 5% of the daily stop-loss.
I only trade 4-star setups and above to avoid overtrading and the temptation to jump into random market opportunities. This disciplined approach ensures that I’m only putting my capital at risk when the odds are strongly in my favor.
2. Stop-Loss Orders: Protect Your Trades with Precision
When setting stop-losses, I place them at strategic points highlighted by the market, such as significant support or resistance levels. To avoid premature stop-outs due to market noise, I set my stop-loss beyond the spread and the market’s natural fluctuations. For example, if the FDAX is in an uptrend with the last higher low at 17,000 points and the spread is 15 points, I would set my stop-loss at 16,967 points (17,000 - 15 - 17).
This ensures that my risk/reward ratio (R/R-ratio) is correctly calculated. Before entering any trade, I carefully assess whether the potential upside justifies the risk. If the R/R-ratio isn’t favorable, even for a 5-star setup, I might avoid the trade to protect my capital.
3. Diversification: Tailor Your Strategy to Your Comfort Level
Diversification is another critical aspect of risk management. As a trader, you can choose to focus on a handful of ticker symbols or spread your risk across a broader range of assets. The first approach, trading a few instruments, is easier to manage and ideal for strategies like market profile trading in FX or indices.
Alternatively, you might opt for a more diversified portfolio, trading up to 50 different stocks at once. In this strategy, each trade only represents a small fraction of your total risk capital—such as your daily stop-loss. This minimizes the emotional strain of trading, as each individual trade carries a smaller risk. With a solid strategy, you can manage all trades effectively, spreading your approach across calls, puts, different markets, industries, and volatility levels. However, this approach is typically better suited for larger accounts, where spread costs won’t significantly impact your profits.
🔚 Conclusion and Recommendation
Risk management isn’t just about protecting your capital; it’s about maintaining the psychological stability needed to trade consistently. By mastering position sizing, setting precise stop-loss orders, and choosing the right diversification strategy, you can navigate the markets with confidence and discipline. Remember, successful trading isn’t just about finding the right opportunities—it’s about managing those opportunities wisely to ensure long-term profitability.
By focusing on high-quality trade setups, calculating your risks accurately, and diversifying appropriately, you’ll find that you can maintain your composure even during losing streaks. This approach not only protects your account but also keeps your mind clear and your emotions in check, paving the way for sustained success.
---
🔥 Can’t Get Enough? Don't Miss Out!
Subscribe, share, and engage with us in the comments. This is the start of a supportive trading community—built by traders, for traders! 🚀 Join us on the journey to market mastery, where we grow, learn, and succeed together. 💪
💡 What You'll Learn:
- The fundamentals of trading
- Key technical and sentiment indicators
- Risk management strategies
- And much more!...
Best wishes,
TradingMasteryHub

USDCADthis is my trade in usdcad let's see how it plays out
very optimistic to hit tp
very small sl more than 1:2 R:R

Backtesting Settings For the Logical Trading Indicator V.1Since creating the Logical Trading Indicator, my trading game has changed in a big and positive way. But I have been curious as to how I can make an automated strategy with it and how much it makes. The Logical Trading Indicator has many different signals and alerts that you can use to create your own trading strategies that work best for your trading plan.
Over the weekend, I have been tinkering around with the base strategy of buy when I get a buy signal and sell when i get a sell signal. I have played around with both a long and short strategy mainly focusing on the BTCUSD pairing. I am really doing this to help me find the best settings possible for each time frame and letting the strategy do the backtesting for me. This really helps me to figure out how it does over the past year or so. So far, at least for BTC, a LONG only strategy has yielded the best results. Mainly because I couldn't get it to fire shorts the way I wanted it to. This is where machines still need some human guidance, as well as your trades, haha.
Dialing It In
What I am doing is going into different timeframes and finding the best settings for the ATR multiple and length in combination with basis length and the long period moving average. I have been recording the results primarily on the 5 minute as well as the 1 HR and 4 HR time frames because those are the main time frames I focus on.
I have played around with different variations of functions, but TradingView can't seem to get things to fire on the strategy the same way I can get the main indicator to fire. But based on this, I set the strategy to a simple LONG only strategy where it buys when you get a BUY signal and then closes when you get a SELL signal, with the addition of a stop loss function that let's me set a stop loss percentage to provide some additional risk management to help with the drawdown percentage.
In this backtest, the strategy was not taking the 'Take Profit' signals into account, or when I tried to include them in the logic, they weren't firing properly, so I kept it simple with just the BUY and SELL signals with a stop loss. If you used the built in take profit signals, you can do even better than these results.
On the 5 minute time frame, the most profitable settings ended up being:
ATR Multiple: 3
ATR Length: 1
Basis Length: 15 EMA
Long Period Moving Average: 50 SMA
These settings yielded over 100% profit for the backtesting period, which is about a year.
For the 1 HR time frame, the winning settings were:
ATR Multiple: 3
ATR Length: 6
Basis Length: 20 EMA
Long Period Moving Average: 100 SMA
These settings yielded over 200% profit for the backtesting period with almost 60% win rate! Again, you could maximize this even more by utilizing the take profit signals and using short trades when the trend is right and if you are trading on a futures exchange. I have been doing more spot trading on DEXs lately, so I have been trading long only lately.
The Importance of Backtesting
I cannot stress this enough, you have to back test your strategies to make sure they are going to be profitable. This can be done manually by going back in time on the charts and finding all of your signals and seeing if it was profitable, or you can create your own strategy like this using TradingView's Pinescript and let the program do the backtesting for you.
However you do your backtesting, just make sure it gets done! You don't want to just think an indicator or a strategy works, you want to KNOW it works! If not, you could be throwing your money down the drain.
This is Only A Test- But Great For Info Gathering
I am only using this strategy for my own backtesting purposes, not publishing it. I simply used one part of the strategy that is built into the Logical Trading Indicator, and it honestly doesn't properly utilize multiple options for exits as far as the automated strategy goes. I know that if I use these settings, but also use my built in take profit signals, I can do much better than these results are showing.
What is great about this is you can see the performance and find trades that you wouldn't have taken in the first place, or entries and exits that could have been done better by trading manually. For example, after looking at the list of trades, I saw several trades I would have either gotten out of for better profit using the take profit signals, or trades I wouldn't have taken in the first place due to consolidation or accounting for the larger trend.
When trying to program some of the other functions from the main indicator, TradingView would freak out on me a bit and not want to provide any results, or results that just didn't make any sense. But that is all a part of the process. It helps you figure out that the machines don't always have it right, and that having just a bit of 'human' in your trades can make your performance even better than the strategy suggests!
Living That Trader Life
This is the life of a good trader, at least in my opinion. Based on my trading plan, I do not trade on the weekends, even though the crypto markets are open, it isn't always the best time to trade. I like to take this time to go over my trading journal to see where I can improve, perfect my strategies, and hone in on the things I need to work on to get better.
What this development work does for me is show me that automated trading is great, but with the combination of a great indicator that can produce trading alerts, and my own trader's intuition, I can give the markets a serious beating and come out with some amazing gains, as long as I stick to the plan, as well as trade manually with the signals! This helps me keep the emotions out of the game and let's me use the data with the correct settings to make the best decisions possible in my trades for the biggest gains! So get out there and do some backtesting on your favorite strategies to see if you really are trading logically!

Educational: The issue with high risk to reward🔶 Introduction
A high win rate—that is, the proportion of trades that result in profits—is appealing to many traders. They might believe that being lucrative requires a high win rate, or that it will increase their self-assurance and lessen their tension. A trader's performance may be negatively impacted over time if they have a high win rate, which is not a guarantee that they will be profitable. We will discuss the problem with high risk to reward and win rates in trading in this publication and why they are not the best measures of success.
🔶 Risk to reward and win rate
Two ideas that are frequently used to gauge the effectiveness of a trading system or strategy are the risk to reward ratio and win rate. The risk to reward ratio calculates how much a trader is prepared to lose in exchange for a possible gain. A trader's risk to reward ratio, for instance, is 1:2 if they stake $100 in order to gain $200. The win rate calculates the percentage of trades that a trader wins out of all the trades they place. For instance, a trader's win rate is 80% if they win 80 out of every 100 trades.
🔶 Inverse Relationship between Risk to Reward Ratio and Win Rate
One would believe that a successful trader should have a high win rate together with a high risk to reward ratio. This isn't always the case, though. In fact, the risk to reward ratio and win rate have an inverse connection, which means that when one goes up, the other goes down. This is due to the fact that the likelihood of achieving a reward decreases as it increases in potential, and vice versa. For example, if a trader aims for a 10:1 risk to reward ratio, they will have to find a very rare opportunity where they can risk $100 to make $1000, which is unlikely to happen often. On the other hand, if a trader aims for a 1:1 risk to reward ratio, they will have more chances of finding trades where they can risk $100 to make $100, but they will also have to win more than half of their trades to be profitable.
🔶 Importance of Positive Expectation
Therefore, unless a trader also has a positive expectation, which is the average amount of money they gain or lose every deal, having a high win rate does not necessarily indicate that they are a profitable trader. The risk to reward ratio is multiplied by the win rate, and the loss rate—which equals 1 less than the win rate—is subtracted to determine the expectation. For instance, a trader's expectation is as follows if they have a 2:1 risk to reward ratio and a 60% win rate:
Expectancy = (2 x 0.6) - (1 x 0.4) = 0.8
This indicates that they profit by $0.8 every trade on average. However, if their win rate remains at 60% and their risk to reward ratio falls to 1:1, their anticipation changes to:
Expectancy = (1 x 0.6) - (1 x 0.4) = 0.2
This means that on average, they make only $0.2 per trade. As you can see, having a high win rate does not guarantee profitability, unless it is accompanied by a high enough risk to reward ratio.
🔶 The Limitations of High Risk-to-Reward Ratio and Win Rate
High win rates can also be problematic because they might make traders overconfident and complacent. They might neglect the risks and uncertainties associated with trading because they believe they have discovered a perfect technique or plan that will always work in their favor. A second possibility is that they grow emotionally attached to their winning streaks and worry about losing them, which can lead them to stray from their trading strategy or take unwarranted risks. Furthermore, a high success rate may make traders more susceptible to cognitive errors like confirmation bias and hindsight bias, which can skew their judgment.
🔶 Conclusion
It may not be as desirable as it may seem to have a high risk-to-reward ratio and win rate when trading. It does not necessarily imply that a trader is successful or profitable, and it may also have some negatives that adversely impact their performance. For long-term trading success, traders should pay more attention to other elements than only these indicators, such as expectancy, consistency, risk management, and emotional control.


80% winrate do a backtestinghi, in this strategy you will make a 80% of your capital please do a backtesting i did t so , you will make alot of money in not time

⚠️ Risk:Reward & Win-Rate CheatsheetThe reward to risk ratio (RRR, or reward risk ratio) is maybe the most important metric in trading and a trader who understands the RRR can improve his chances of becoming profitable. Basically, the reward risk ratio measures the distance from your entry to your stop loss and your take profit order and then compares the two distances. Traders who understand this connection can quickly see that you neither need an extremely high winrate nor a large reward:risk ratio to make money as a trader. As long as your reward:risk ratio and your historical winrate match, your trading will provide a positive expectancy.
🔷 Calculating the RRR
Let’s say the distance between your entry and stop loss is 50 points and the distance between the entry and your take profit is 100 points .
Then the reward risk ratio is 2:1 because 100/50 = 2.
Reward Risk Ratio Formula
RRR = (Take Profit – Entry ) / (Entry – Stop loss)
🔷 Minimum Winrate
When you know the reward:risk ratio for your trade, you can easily calculate the minimum required winrate (see formula below).
Why is this important? Because if you take trades that have a small RRR you will lose money over the long term, even if you think you find good trades.
Minimum Winrate Formula
Minimum Winrate = 1 / (1 + Reward:Risk)
👤 @AlgoBuddy
📅 Daily Ideas about market update, psychology & indicators
❤️ If you appreciate our work, please like, comment and follow ❤️

Risk-to-Reward > Win RateWe have mentioned it in a list of our previous educational posts and we will state it again: your risk-reward plan is much more important than your win rate. You can have a 90% win rate and still be losing in the long-run. On the contrary, you only need a 35% win rate to be a consistently profitable trader on the longer term.
Beginners mainly focus on winning as many trades as possible and it is totally understandable, because we have all been there. "The more trades I enter, the more money I will make" principle has destroyed many trading careers. The explanation to the "Why?" question is pretty simple: when we are new to trading, every win gives us euphoria and makes us think we are the rulers of the market. Guess what happens next, the market hits back, puts us in a position where we are stuck in a losing streak, and humbles us enough to quit trading and think it does not work.
As we get more experienced, we lean towards the "Less is more" principle and believe that quality will always be over quantity.
As an instance, we have orchestrated 2 scenarios on the graph.
The example on the upper side of the screen shows how our trader has a 80% win rate but has yet failed to remain in profits due to the fact that he does not have a solid risk management plan.
On the opposite side of the road, we have Trader B who is able to remain in consistent profits by winning only 20% of the executed transactions. All those minor losses that he made got covered by one big win, and as long as he keeps following the current risk management policy and strategy of his, he is sure that he will be consistently profitable in the long run.

Learn Risk-Reward Ratio | Risk Management For Beginners
📚The risk-reward ratio (or risk return ratio) measures how much your potential reward (or return) is, for every dollar you risk.
📚For example:
If you have a risk-reward ratio of 1:3, it means you’re risking $1 to potentially make $3. If you have a risk-reward ratio of 1:5, it means you’re risking $1 to potentially make $5. You get my point.
⚠️Now, here’s the biggest lie you’ve been told about the risk reward ratio:
“You need a minimum of 1:2 risk reward ratio.”
This statement is incorrect! Because the risk-reward ratio is meaningless on its own.
📚Here’s an example:
Let’s say you have a risk reward ratio of 1:2 (for every trade you win, you make $2).
But, your winning rate is 20%. So out of 10 trades, you have 8 losing trades and 2 winners.
Let’s do the math…
Total Loss = $1 * 8 = -$8
Total Gain = $2 * 2 = $4
Net loss = -$4
By now I hope you understand the risk reward ratio by itself is a meaningless metric. Instead, you must combine your risk-reward ratio with your winning rate to know whether you’ll make money in the long run (otherwise known as your expectancy).
📍THEREFORE:
The key to success is the combination of the RR and Win Rate in such a fashion that yields a positive return.
📙Example:
🔘If your RR is 1:1 then you start making money with 51% win rate and above.
🔘If your RR is 1:1,5 then you start making money with 41% Win rate and above.
🔘If your RR is 1:2 then you start making money with 34% win rate and above.
🔴The higher the RR the lower is the breakeven Win Rate!
Like, comment and subscribe to boost your trading!
Hey traders, let me know what subject do you want to dive in in the next post?


CADJPY SHORTlong term down trend on 4H timeframe. Recent tight range broken to the downside, with a strong reversal up to previous support. Now expecting this to act as resistance indicators suggesting an overbought price series and oscillators crossing to the downside for confirmation.
Entering positions at support/resistance gives the trader a unique opportunity to be directional with a tight stop loss and setting take profit to support 1, 2 and 3. This results in a favorable risk/reward ratio. Follow for more

❗️THE BIGGEST LIE ABOUT RISK REWARD RATIO❗️
What is risk-reward ratio — and the biggest lie you’ve been told:
📚The risk-reward ratio (or risk return ratio) measures how much your potential reward (or return) is, for every dollar you risk.
📚For example:
If you have a risk-reward ratio of 1:3, it means you’re risking $1 to potentially make $3. If you have a risk-reward ratio of 1:5, it means you’re risking $1 to potentially make $5. You get my point.
⚠️Now, here’s the biggest lie you’ve been told about the risk reward ratio:
“You need a minimum of 1:2 risk reward ratio.”
This statement is incorrect! Because the risk-reward ratio is meaningless on its own.
📚Here’s an example:
Let’s say you have a risk reward ratio of 1:2 (for every trade you win, you make $2).
But, your winning rate is 20%. So out of 10 trades, you have 8 losing trades and 2 winners.
Let’s do the math…
Total Loss = $1 * 8 = -$8
Total Gain = $2 * 2 = $4
Net loss = -$4
By now I hope you understand the risk reward ratio by itself is a meaningless metric. Instead, you must combine your risk-reward ratio with your winning rate to know whether you’ll make money in the long run (otherwise known as your expectancy).
📍THEREFORE:
The key to success is the combination of the RR and Win Rate in such a fashion that yields a positive return.
📙Example:
🔘If your RR is 1:1 then you start making money with 51% win rate and above.
🔘If your RR is 1:1,5 then you start making money with 41% Win rate and above.
🔘If your RR is 1:2 then you start making money with 34% win rate and above.
🔴The higher the RR the lower is the breakeven Win Rate!
Hope You get the idea, guys.
Thanks for your time, see you in the next article😉

Higher RRR, the higher the chances of profit & consecutive lossLower RRR = Low drawdowns (Lower consecutive losers)
Higher RRR = High drawdowns (Higher consecutive losers)
To not go against the prop firm's drawdown rule of > 10% rule, You should risk..
risk per trade = 10/consecutive loser
Example.
risk per trade = 10/7 = 1.4285%
So you should risk < 1.4285% per trade.

The case of AUDNZDAudNzd has been in a nice rectangle for a while now but I feel it's due for touching near June's high maybe more! Let's get this money!

Risk:Reward Ratio. What is it?Risk to reward ratio. What is it? What does it mean and how do we use it?
Now, if you made it to the point where you're here on TradingView, there's a good chance that you have heard about Risk to Reward ratio. Today, I want to dive into what it really means and how to actually utilize it. I see so many beginners missing out on huge profits and opportunities because of their risk reward ratio and I want to share my knowledge of this tool and how to actually use it in the future.
Firstly, let's dive into what is the risk/reward ratio? The RR ratio is a tool that can accurately predict by expected returns based off of previous results. This tool measures how much reward you are estimated to gain based off of the dollar amount you risk. For example, if you have a risk to reward ratio of 1:3, it means for every $1 you risk, you will gain a return of $3 in the event of a positive trade. Using the same example in the FX market, let's say you're risking 10 pips on EURUSD, your take profit is at 30 pips. This means you gain 30 pips in the event of a win, lose 10 pips in the event of a loss, giving you a 1:3 risk/reward ratio.
This is a very powerful tool because compared with the win rate and in correlation, you can actually predict based off of your previous results, you're expected returns on investment. Being able to predict what you're expected returns are are great way of giving you milestone targets, but also when you're looking at getting funded with prop firms, you also know what you are actually able to achieve in what time frame.
Now, it goes without saying, the higher your risk to reward ratio, the less you need to win in order to maintain profitability. The opposite, the lower your risk reward ratio, the higher win rate is required to maintain profitability.
But this is where we get into where I find beginners struggle. A lot of people will base their strategies on their risk/reward ratios, which is understandable if you're building the strategy from scratch. If you're using a prebuilt strategy or something that doesn't really correlate with risk/reward ratio. Then it makes it obsolete and just confusing. Going back to my first point, risk to reward ratio is a tool that you can use to estimate future potential returns based off of previous results. Let's say you have 100 trades worth of data. You can accurately have a look at what is your risk to reward ratio is and compare that with your win rate. From there you can make a decision whether or not that is a profitable strategy. On top of that, you can then start to look to improve either your win rate and risk to reward ratio, knowing that that is an area that needs improvement.
When it comes to improving your risk to reward ratio, one thing that always grinds my gears with traders, is when they enter a trade, they'll set their stop loss and take profits based on their risk to reward ratio not based on the actual analytics of the trade. While I understand this and with some strategies, this can work. For most, they end up setting those take profits in areas that is just realistically is going to be really hard for the price to get to. What professionals do when trying to improve the risks of reward ratio is only take those setups where a good take profit is viable around that level of risk to reward.
For example, in this chart, we are looking at buying the USDCAD over the next couple of weeks. We like this setup. We've had our entry signal and we're going to place a stop loss below that recent low, which was created early last week. We are not happy with our risk to reward ratio. We think we're leaving too much profit on the table and want to increase our overall results. So I'm only taking trades that have close to a three to one risk to reward ratio. But as you can see by this chart that dotted lines are areas of resistance which we are going to have to break in order to achieve that level of profitability. There are 5 different zones we are going to have to get through in order for my take profit to be hit, it is fair to say the odds are not in my favor.
Now a beginner Trader will still enter this trade with the same take profit and the same stop loss and just hold on. The reason they'll do that is because they want the 1:3 risk reward ratio. They don't care where the profit target is. What matters is it is 3 times worth what they're risking. On the other hand, A professional trader will actually either let this trade go and not enter it, or look for another entry point later on on smaller timeframes to where you can fit that risk to reward ratio and you're not going to hit the high levels of resistance.
To sum up what my point is, risk to reward ratio is a very powerful tool to understand what you are capable of the trader and also where you can improve. It is not a valid take profit selection strategy. Yes, it can definitely help with guidelines on where to set your take profit, but it should not be the sole reason your take profit is set at a certain price just because it is X amount whatever you are risking. Have a look at what the chart is telling you and what your analysis is telling you. Then, only take the trades which coincide with the risk to reward ratio. You want to achieve.
I hope you enjoyed this insight and I hope it was beneficial to you. I recommend highly diving into your previous trading data. Have a look at your win rate. Have a look at your risk reward ratio and understand what your profitability expectation really is and base your future decisions off of that data. Have a fantastic trading we can I look forward to seeing your comments.
- Jordon
