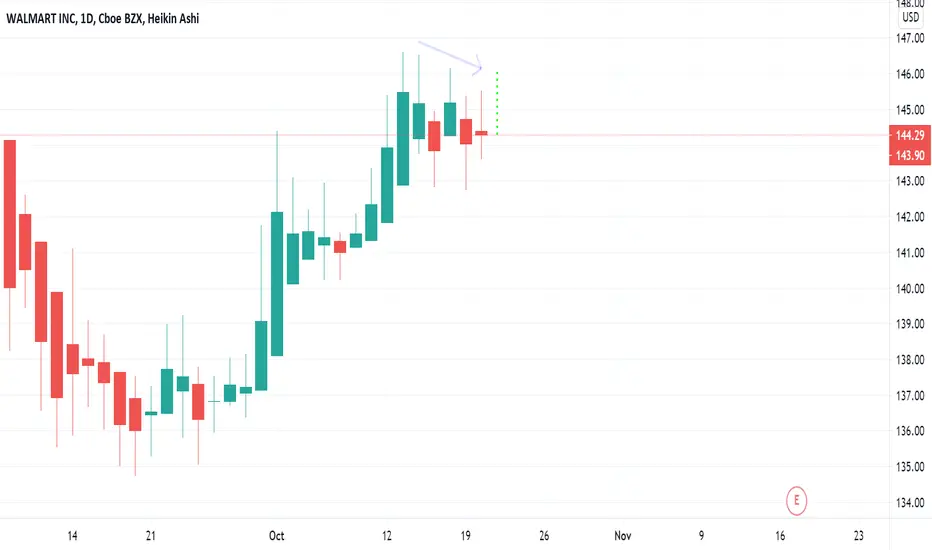
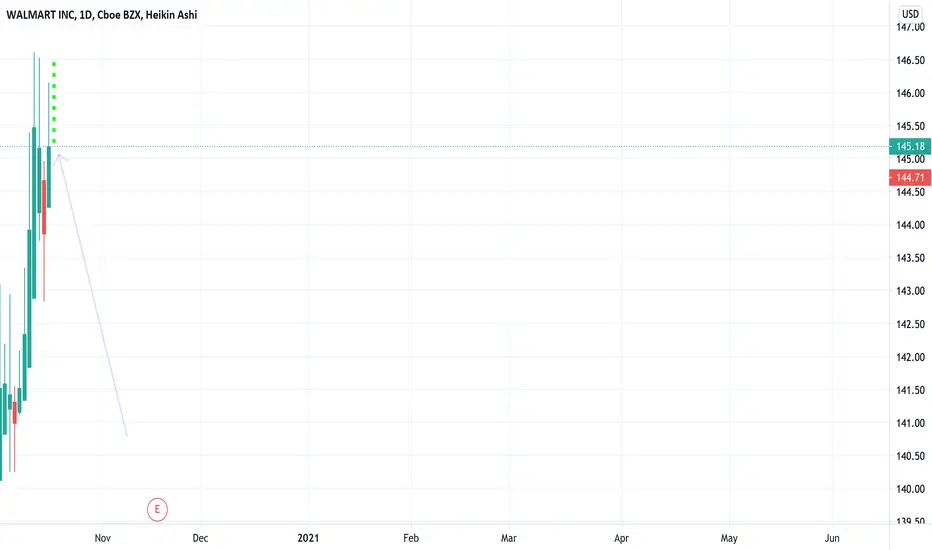
A clear pattern: Walmart earnings call warns short.After every Walmart earnings call from the past 5 years has a decline of on average $5 that occurs within a week after earnings call. My method is as follows: A day before I bought a put option on Walmart which expires in 12 days. I will hold this put option for a maximum of one week and wait until WMT stock falls to about $145-$148 per share.
WMT


$WMT$WMT is at the verge of a breakout.
It's in strong uptrend and making HL and HH. If could make a successful breakout
we may see it around 150 level and a new ATH.

Bullish on WalmartMACD suggests the price could go down lower and follow the red path, and with all the current macro economics it would make sense. However, Walmart bounced off support and with shopping season right around the corner we may see a breakout above the triangle. Bullish in the long-run regardless on the next few days

WMT Daily Candlestick PredictionSo far I am 2 for 4 on my WMT daily candlestick predictions. Comment below if you think something different could happen!
WMT To $150 By End Of OctoberDespite the chop, which there will be plenty. WMT should hit $150 a share by the end of October. Trend line shows our range while the arrows represent the chop. For you pure technicals a stimulus deal could effect the timing based on a deal or no deal. If there is no deal, I do not see WMT hitting $150 until mid November. Outside factors do affect the market.

$WERN Melt to Support + EarningsIt's amazing to dive into companies and see their story visualized by data and charts.
Werner Enterprises to me symbolizes one of those great American brands everyone knows about but wouldn't know to actually invest in.
A really rough history of being private equity darling and getting levered up to the hilt with debt. Wern now trades at 1.19x trailing sales... Doing $500M per quarter, there is no doubt they will be a survivor of the global pandemic we all know so well.
Earnings is the 28th. Stay tuned for talks on business catalysts.

WMT Forecast Will Walmart hit $150 a share by the end of the month? In order for WMT to hit $150 by the next 10 trading days is for the bulls to take control of the price. Here are some signals that the bulls are getting ready to run hard. First we can see on the hourly candlestick chart that the green shadow under the latest bear candles is growing. This means bull buying power is increasing.
WMT has also fallen greatly below the moving average and should correct itself in the next coming days. Moving Average Convergence Divergence shows that the bears are at peak strength giving hope that they will loose steam in the upcoming days allowing for the bulls to take control. Bollinger Bands are also nearing a low in which a buy signal will be given. ( I will post a new chart when that happens) Finally the RSI on the 1 hour chart is 34.79 nearing underbought territory. When investors see that this company is underbought they will begin accumulating shares to rake in a nice profit.
Fundamental Analysis: We are still waiting on a stimulus deal and a deal or no deal could bring WMT to a lower low or create the start of a new bull run that will go right into earnings. Technical analysis is great, but outside factors do have an impact on stock price as well.
I am personally an WMT bull and have 6 long calls for it to hit $150 by 12/18/2020, I am currently down 25% on my position. Will give it a week pending stimulus deal and finding that strong buy signal from the Bollinger Bands.
What are your thoughts on WMT for the end of the month? Please fell free to comment your thoughts below.

SNAPSNAP EARINGS ARE ON TUESDAY AFTER CLOSE THIS WEEK. THERE IS A 3.5 POINT MOVE PRICED IN.
SNAP NEEDS TO HOLD 27.6 TO CONTINUE HIGHER
LOTTO TRADE IDEA: 30C BID/ASK: 0.92/0.95

Daily Candlestick Prediction For WMTSo far I am 2 for 3 on my candlestick analysis for WMT. Lets see what Monday brings!
WMT Trading Activity Follow to see my WMT option trading activity. I will post a new chart with every trade. I will be exclusively swing trading WMT.
Chart is provided, feel free to ask questions about the indicators if you are unsure.

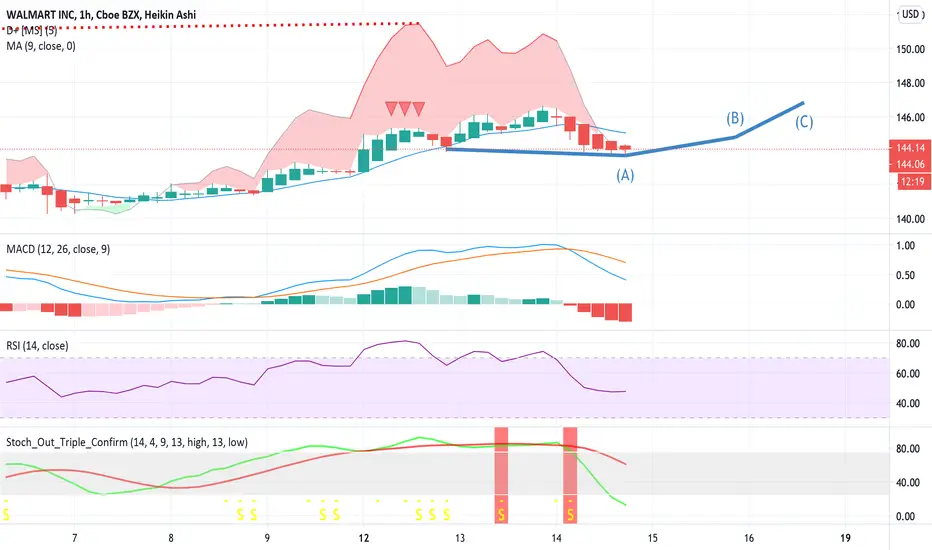
Walmart by the Hour With the small candle at point A we can see that the bearish selling has been getting weaker. The MACD shows strong bear strength but could quickly weaken. As they are loosing buying strength. How do I know they are loosing strength? Take a look at the RSI. WMT returned to its normal range of 48 for its RSI and does not historically stay that low very long. Follow to see how my trend line turns out, give a like if you are a Walmart Bull, and finally comment your thoughts if you agree or disagree. Would love to hear your thoughts. Thank you!
10/12 WMT Ascending TriangleAscending bullish triangle on a 4 hour chart.
I believe a closing candle above $143-$143.50 and we can fly to $150 by the end of the week.

Walmart 1 month Analysis Looking at the one month chart ( 30 min candles ) we can see that Walmart has hit its highest low putting it in place to reach its highest high. With growing bullish divergence and a low RSI we can expect Walmart to make a swift comeback.

wmt channeldrew this in the morning and watched it trend within the lines all day so I thought id share here. had a note for target of between 146.62 (full break out) and 146.58, i kinda shocked myself how accurate these were. please help me grow by giving a comment, like and of course a sub!

Walmart about to reach a higher low Walmart is cruising into earnings, however we are on our way to hit a higher low. I believe some point this week WMT will hit $143 a share. Here's the technical analysis that explains why.
RSI: Relative Strength index is at 60 and an average for Walmart is close to 55. With the high RSI we can see price decrease as investors are seeing Walmart being overbought.
MACD: Shows that there is growing bearish divergence, bears are getting stronger meaning they might take more control of the stock price.
My plan?
My plan is to buy Calls on the dip. I am going to purchase 12/18 Call for WMT to be $150 a share.
Follow to see my trades, and give a like if you see Walmart growing, and part of growing means hitting higher lows.
Comment your thoughts on my analysis, I would love to be critiqued.

TGTTGT CAN CONTINUE HIGHER TOWARDS 168 THIS WEEK.
Target partnership with FAO Schwartz includes Barbie Dream expected to be best seller of the year.
Target will run two days of deals on Oct. 13 and 14.


BBYBest Buy to Hold Black Friday Sales on Oct 13-14
Over 116 can continue higher towards 119.48. Above 119.48 can move higher 2-5 more.

AMZNAMZN WAS ABLE TO CLOSE ABOVE THE 3250 LEVEL ON FRIDAY. LEVELS ABOVE ARE, 3286, 3313, 3344, 3383.
Amazon Prime Day is on Oct 13-14th.
WMT, BBY, TGT next week will be offering their own online discounts and promotions. So I would keep those on watch.

WMT looking for a LONGPrice seems to be respecting the 50MA in this healthy looking uptrend. Im waiting here but will be looking to long closer to the 50MA for the best possible Risk/Reward

Walmart (WMT) rounding out bottom on 65 min time frameLook to buy near the low range of the rounding formation that I drew. Also, there is horizontal support at $135 and horizontal resistance near $139. If it breaks out, it can make new highs again.

Walmart Path and directionHello everyone
Walmart started a uptrend in march
so far uptrend intact
watch key levels in notes at the chart
for any question feel free to ask :)
