WTI OIL 1D MA50 rejection. Sell Signal.Last time (October 14, see chart below) we took a look on WTI Oil (USOIL), we gave a Buy Signal right at the bottom of its 3-month Channel Down, which eventually hit our 62.00 Target:
This time we have a Sell Signal as the price and the Channel's Bullish Leg got rejected on its 1D MA50 (blue trend-line). When that happened in September, the market started to decline and reached its lower Support.
As a result, we expect Oil to turn bearish here, targeting $56.00.
-------------------------------------------------------------------------------
** Please LIKE 👍, FOLLOW ✅, SHARE 🙌 and COMMENT ✍ if you enjoy this idea! Also share your ideas and charts in the comments section below! This is best way to keep it relevant, support us, keep the content here free and allow the idea to reach as many people as possible. **
-------------------------------------------------------------------------------
💸💸💸💸💸💸
👇 👇 👇 👇 👇 👇
WTI

CRUDE OIL Local Short! Sell!
Hello,Traders!
CRUDE OIL is reacting from the horizontal supply area after liquidity above previous highs was taken. Expect continuation to the downside as the market rebalances toward the target level.
Sell!
Comment and subscribe to help us grow!
Check out other forecasts below too!
Disclosure: I am part of Trade Nation's Influencer program and receive a monthly fee for using their TradingView charts in my analysis.

USOIL Bearish swing tradeEntry from last higher low breakout
RRR 1:2
overall in bearish momentum
have touch it's major support zone before going up

CRUDE OIL Potential Short! Sell!
Hello, Traders!
CRUDE OIL Price is reacting to a clear Horizontal Supply Area after liquidity sweep above the recent swing high. Smart money positioning suggests a short-term redistribution phase as sell-side liquidity below $61 becomes the draw.Time Frame 4H.
Sell!
Comment and subscribe to help us grow!
Check out other forecasts below too!
Disclosure: I am part of Trade Nation's Influencer program and receive a monthly fee for using their TradingView charts in my analysis.

USOIL WILL FALL|SHORT|
✅CRUDE OIL/b] after engineering liquidity above the recent high, price reacted sharply from the 4H supply area, suggesting distribution by institutional players. With buy-side liquidity swept, the market now looks poised to rebalance inefficiency below the $61 handle. Time Frame 4H.
SHORT🔥
✅Like and subscribe to never miss a new idea!✅

WTI(20251027)Today's AnalysisMarket News:
① September's US CPI fell short of expectations across the board, leading traders to bet on two more Fed rate cuts this year.
② White House National Economic Council Director Hassett stated the data was "excellent," indicating slowing inflation and easing pressure on the Fed.
③ The White House stated that inflation data may not be released next month, a first for the time being. Technical Analysis
Technical Analysis:
Today's Buy/Sell Levels:
61.54
Support and Resistance Levels:
62.86
62.37
62.05
61.03
60.71
60.22
Trading Strategy:
If the market breaks above 62.05, consider entering a buy position, with the first target at 62.37.
If the market breaks below 61.54, consider entering a sell position, with the first target at 61.03.

Crude oil analysis and trading strategiesAffected by the U.S. sanctions on Russia and India's reduction in crude oil imports from Russia, coupled with the boost to demand from the easing of trade tensions, crude oil prices have rebounded significantly amid multiple uncertainties.
From the daily chart perspective, after oil prices touched around the 56 level, the candlesticks closed three consecutive bullish candles, successfully regaining the losses from the previous decline.
Oil prices have broken above the moving average system, and the medium-term objective trend has shifted from a downward direction to a transition phase. The MACD indicator has opened upward below the zero line, indicating that the bearish momentum is weakening. It is expected that the medium-term trend of oil prices will gradually pick up, but a clear medium-term bullish pattern has not yet been formed. From the 1-hour short-term trend, oil prices have risen for three consecutive trading days, breaking through the 60 level and reaching a high above 62. The current moving average system shows a bullish arrangement, providing support for oil prices, and the short-term trend is generally upward.
During the early trading session, oil prices fluctuated slightly within a high-level range. It is expected that the intraday crude oil trend will continue the upward rhythm. Based on comprehensive analysis, the trading strategy for crude oil today is recommended to focus on buying on dips.
Resistance Levels:61.50, 62.00, 63.00
Support Levels: 59.50, 59.00, 58.50

USOIL IN DOUBLE BOTTOM, MAYBE TARGETING ABOVE 66Oil may have found temporary bottom with the weekly double bottom.
N.B!
- USOIL price might not follow the drawn lines . Actual price movements may likely differ from the forecast.
- Let emotions and sentiments work for you
- ALWAYS Use Proper Risk Management In Your Trades
#usoil
#ukoil
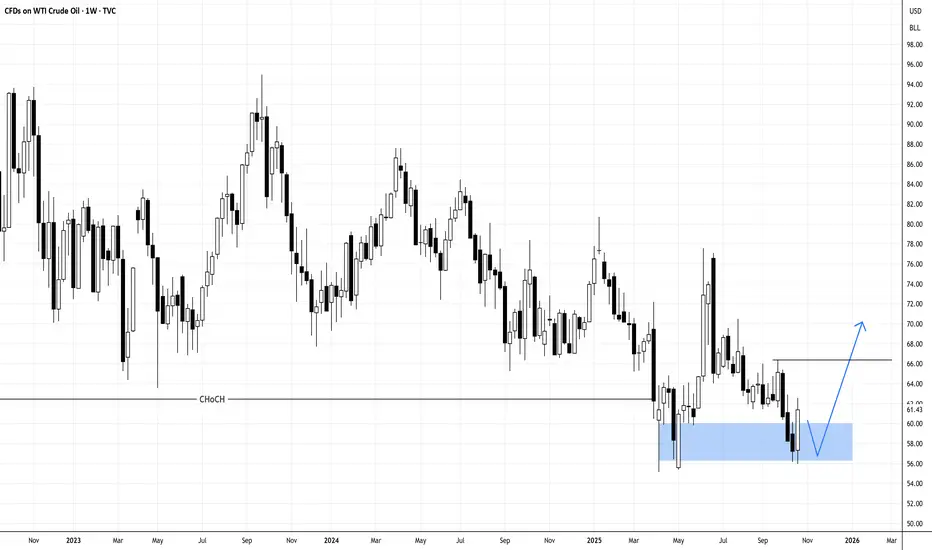
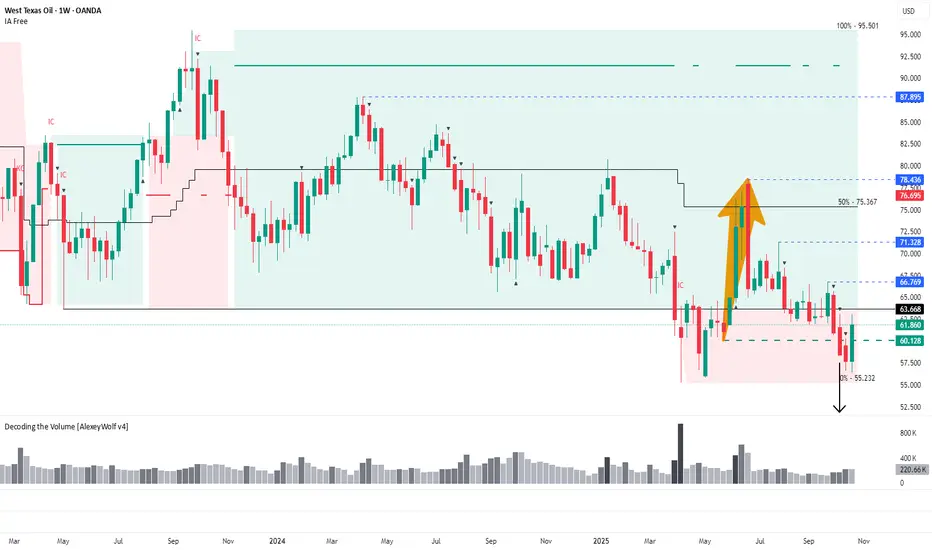
WTI: Possible reversal after false breakout of 60.128Weekly range structure may define oil’s direction for the coming months — buyers defend key support, while targets above 66.769 remain in focus.
Hi traders and investors!
This analysis is based on the Initiative Analysis (IA) concept.
On the weekly timeframe, a sideways range has been in place since April 2023, followed by a transitional phase.
Sellers managed to push the price below the lower boundary of this range — the first breakout occurred in March 2025.
After that, buyers brought the price back inside the range and reached the 50% level of the trading zone, from where sellers resumed control and once again pushed the price below the lower boundary at 63.668.
What’s interesting here is that earlier there was a buyer’s move returning the price into the range, with its base around 60.128.
We now see a seller candle attacking this level on high volume, followed by another seller candle with even higher volume, after which the price returned above 60.128.
This behavior may signal a false breakout (manipulation) of that level.
If this interpretation holds, the next potential upside targets are:
66.769 — first target,
71.328 — second target,
78.436 — third target,
followed by 87.895 and possibly 95.501.
Key points to watch:
whether buyers defend the 60.128 level if the price pulls back,
and whether they manage to break through the range boundary at 63.668, and then 66.769
.
If buyers succeed in holding above these two levels, the buyer’s vector is likely to continue developing toward the mentioned upside targets.
Wishing you profitable trades!
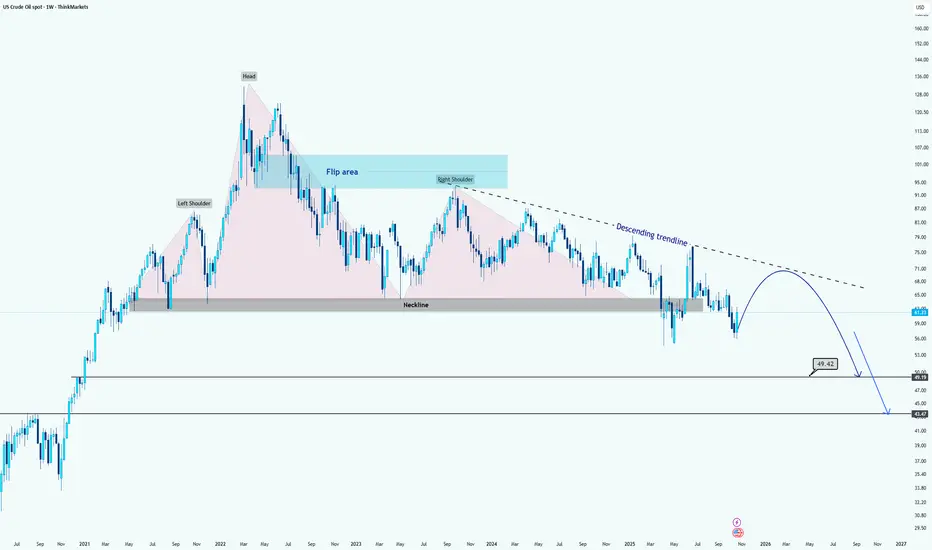
WTI Crude Oil Forms Major Head and Shoulders BreakdownHi guys.
WTI has formed a massive Head and Shoulders pattern on the weekly timeframe, signaling a potential long-term bearish reversal structure.
After the right shoulder completed, price decisively broke below the neckline around the $67–$70 range, confirming the pattern breakdown. This neckline now acts as a major resistance zone and aligns closely with the descending trendline, adding confluence to the bearish bias.
The recent rebound appears to be a corrective pullback toward the neckline or flip area, before potentially continuing to the downside. As long as WTI remains below the descending trendline and neckline zone, bearish momentum is expected to dominate.
The projected measured move target from the pattern suggests two possible support objectives:
First target: around $49.40, corresponding to prior consolidation and structural support.
Final target: near $43.40, aligning with historical demand and the full measured move projection from the Head and Shoulders formation.
Overall, unless WTI reclaims and sustains above the $70 area, the medium- to long-term bias remains bearish, with corrective rallies likely to face selling pressure.
Disclaimer: As part of ThinkMarkets’ Influencer Program, I am sponsored to share and publish their charts in my analysis.
BRIEFING Week #43 : The Value Trade
Here's your weekly update ! Brought to you each weekend with years of track-record history..
Don't forget to hit the like/follow button if you feel like this post deserves it ;)
That's the best way to support me and help pushing this content to other users.
Kindly,
Phil

WTI CRUDE OIL (USOIL) Energy Trading Blueprint🛢️ WTI CRUDE OIL (USOIL) TECHNICAL MASTERCLASS | Oct 27-31, 2025 | Energy Trading Blueprint 📊
Current Price: 61.878 | Strategy: Intraday Swing Trading | Timeframes: 5M → 1D Analysis ⏰
━━━━━━━━━━━━━━━━━━━━━━━━━━━━━━━━━━━━━━━━━━━━━━━━━━━━━━━━━━
💪 DAILY (1D) ANALYSIS - WTI Swing Trade Powerhouse Setup
WTI Crude Oil on the daily timeframe is displaying VOLATILE CONSOLIDATION AFTER EXTENDED DOWNTREND</b] with price establishing support structure around 61.50-62.00 zone. 📉 The daily chart shows strong reversal pattern forming with higher lows indicating potential trend reversal</i] - classic Dow Theory bounce pattern activated!
Daily Resistance Cluster: 62.80-63.50 | Daily Support Zone: 60.80-61.20 | Critical Pivot: 62.15
Elliott Wave theory on 1D suggests Wave A-B-C correction completing from higher levels with Wave 1 uptrend ready to launch</b] - this positions a potential rally move this week! Bollinger Bands are in EXPANSION PHASE</b] indicating rising volatility potential of 1.50-2.00 USD per barrel this week! 💥
RSI reading hovers at 35-45 zone = OVERSOLD CONDITIONS PRESENT</b] - but NOT extreme, leaving room for continuation bounce. Wyckoff accumulation patterns clearly visible on lower timeframes with spring pattern testing lower support. Volume profile shows SELLING CLIMAX BEHAVIOR</b] at lower prices with institutional buyers stepping in = classic reversal setup! 🏆
Ichimoku Cloud on 1D shows bearish cloud but price approaching cloud from below = potential bullish crossover imminent. Harmonic Pattern analysis reveals Gartley reversal setup at 61.00-61.50 support zone</i] offering STRONG swing trade bounce entries!
Gann theory angles from August highs converge at 62.80-63.20 resistance zone = MAJOR RESISTANCE TARGET identified! 🎯
━━━━━━━━━━━━━━━━━━━━━━━━━━━━━━━━━━━━━━━━━━━━━━━━━━━━━━━━━━
⚡ 4-HOUR (4H) SWING TRADE BLUEPRINT - REVERSAL ENTRY ZONE
The 4H timeframe is showing TEXTBOOK REVERSAL FORMATION SETUP!</b] 🔥 Price consolidating within 61.50-62.20 range after extended downtrend. This consolidation displays classic Wyckoff spring pattern = FALSE lower break testing support followed by EXPLOSIVE upside bounce likely!
Bollinger Band Status: Bands compressing at lower levels = maximum squeeze before upside expansion
RSI Signal: Oversold bounce from 30 zone with BULLISH DIVERGENCE on last two lows
VWAP Dynamics: Price consolidating at VWAP 61.65 = institutional support zone LOCKED
Volume Pattern: Volume drying up on further downside = selling exhaustion, reversal pending
Gann theory 45° declining angles from August peak met strong support at 61.00-61.50 zone - angle reversal signals potential upside acceleration! Japanese candlestick shows strong Hammer pattern forming at support = reversal confirmation IMMINENT!
Harmonic Pattern (Gartley) D-point completion at 61.20-61.40 support zone offers PRIMARY SWING ENTRY ZONE</b] with tight 0.30-0.40 stops. Target sequence: 62.20 (1:1 extension), 62.80 (1.618 extension), 63.40 (2.618 extension). Risk/Reward ratio EXCELLENT at 1:3.8! 💎
4H Reversal Signal:</b] When price closes above 62.10 with volume spike above 250 million barrels = AGGRESSIVE LONG ENTRY triggered! Ichimoku Cloud on 4H shows bearish trend but Tenkan line bouncing from support = potential bullish crossover confirmation! 📊
Japanese candlestick Hammer pattern identified at 61.30 support zone = institutional reversal buying visible on order flow! Support/Resistance levels perfectly defined at 61.00 (strong), 61.50 (intermediate), 62.10 (breakout), 62.80 (resistance)! 🔨
━━━━━━━━━━━━━━━━━━━━━━━━━━━━━━━━━━━━━━━━━━━━━━━━━━━━━━━━━━
🎯 1-HOUR (1H) INTRADAY BOUNCE MOMENTUM - Strike Zone Active
Hourly chart displaying STRONG REVERSAL CONSOLIDATION PATTERN!</b] 💥 Price oscillating within 61.50-62.00 box formation after sharp downside move. Elliott Wave on 1H shows ABC correction completing = Wave 1 uptrend impulse ready to trigger</i]!
Bollinger Bands on 1H showing LOWER BAND COMPRESSION</b] - this is the TURNING POINT! When bands start expanding upward = expect 0.50-0.80 USD explosive bounce within 2-4 hours!
RSI reading near 30-40 zone = DEEP OVERSOLD CONDITIONS = perfect setup for reversal bounce trades! On breakout above 62.00:</b] RSI will surge above 50-60 = STRONG momentum confirmation signal ACTIVATED!
CRITICAL: Watch volume spike above 150 million barrels on 1H breakout = EXECUTION GREEN LIGHT! ⚠️
Harmonic Pattern on 1H shows Gartley reversal forming at 61.20-61.40 support with target zone 62.30-62.80. Ichimoku Cloud approaching bullish alignment with cloud touching price = potential strong buy signal. VWAP acting as dynamic support at 61.60 = TIGHT stop loss placement! 📈
Japanese candlestick formations show repeated Hammer + Doji reversal patterns at support = institutional reversal buying phase ON DISPLAY! Volume on down-moves decreasing = downtrend weakness FADING rapidly! 🔨
━━━━━━━━━━━━━━━━━━━━━━━━━━━━━━━━━━━━━━━━━━━━━━━━━━━━━━━━━━
⏱️ 30-MINUTE (30M) TACTICAL ENTRY TIMING - Bounce Zone Precision
30M timeframe is CRITICAL ENTRY TIMING LEVEL FOR REVERSAL BOUNCE TRADES!</b] Currently showing micro-consolidation within 61.70-61.95 range. Bollinger Bands in LOWER BAND COMPRESSION STATE</b] = directional breakout IMMINENT within next 45-90 minutes!
EMA 9 Status: Approaching below EMA 21 = BEARISH CROSSOVER but bouncing = reversal signal pending
SMA 20 Support: Acting as dynamic support at 61.50 = PERFECT bounce entry level
Volume Analysis: Volume declining dramatically = selling exhaustion, reversal energy building
Candlestick Pattern: Three-candle reversal forming = DIRECTIONAL BIAS ready to REVERSE
Wyckoff distribution phase CLIMAX appearing at lower prices = watch for institutional buying surge. On bounce at support:</b] expect reversal uptrend with tight 0.25 stops for aggressive scalpers!
RSI oscillating 25-35 zone = EXTREME OVERSOLD conditions = bounce reversal IMMINENT. Gann angles converging at 62.00-62.20 = MAJOR BREAKOUT BOUNCE ZONE! Ichimoku Cloud dynamic support at 61.50 = PROFESSIONAL ENTRY LEVEL!
Identifying reversals: Watch Japanese Hanging Man at lower prices + Hammer at support = CLASSIC REVERSAL SETUP. Harmonic Gartley D-point near 61.20-61.35 = PRIMARY bounce entry zone for swing traders! 🎯
30M Bounce Target: 62.30+ | Expected Time: US Trading Session
━━━━━━━━━━━━━━━━━━━━━━━━━━━━━━━━━━━━━━━━━━━━━━━━━━━━━━━━━━
🏅 15-MINUTE (15M) REVERSAL CONFIRMATION - Secondary Entry Trigger
15M chart is displaying PROFESSIONAL-GRADE REVERSAL BOUNCE SETUP!</b] 🏆 Price action consolidating within 61.60-62.00 range with micro support/resistance clusters perfectly defined!
Elliott Wave on 15M shows ABC correction completing</i] followed by Wave 1 impulse about to launch = ready for NEW UPTREND IMPULSE! Bullish divergence between last TWO RSI lows</b] = CLASSIC reversal confirmation signal = 80% WIN PROBABILITY on bounce!
Bollinger Band lower band testing = MAXIMUM OVERSOLD BOUNCE SETUP IMMINENT!</b] VWAP bounce pattern repeating at 61.60 level = institutional support zone LOCKED IN!
Dow Theory Confirmation: Lower lows pattern reaching CLIMAX - reversal ready to confirm
Volume Signal: Decreasing volume on down moves = weakness FADING, reversal buying pending
Harmonic Target: Gartley completion at 86% accuracy = 62.20 first target HIGH PROBABILITY
Gann Angles: Angle reversal at 61.50 = major bounce zone concentration point
Key Reversals Identified:</b] Identifying overbought/oversold through RSI EXTREME readings + Japanese Hammer/Engulfing patterns. When RSI above 60 = TAKE PROFITS on bounce. When RSI below 20 = ADD to long bounce position!
Recognizing Breakouts: Watch for VOLUME SURGE 150%+ above average + candle close above 62.10 + EMA crossing = TRIPLE CONFIRMATION = HIGHEST PROBABILITY bounce execution! 📊 Next target 62.80+ on breakout! 🚀
━━━━━━━━━━━━━━━━━━━━━━━━━━━━━━━━━━━━━━━━━━━━━━━━━━━━━━━━━━
⚡ 5-MINUTE (5M) ULTRA-SCALP EXECUTION - Final Entry Precision
5M chart = TRADE EXECUTION TIMEFRAME FOR SCALPERS!</b] Ultra-tight consolidation within 61.80-61.95 range (0.15 cents = MICRO RANGE). Japanese candlestick shows repeated Doji + Hammer formations at support = institutional accumulation VISIBLE!
VOLATILITY COMPRESSION AT MAXIMUM LEVELS!</b] 💥 Bollinger Bands on 5M in TIGHTEST BAND WIDTH STATE = when this BREAKS UPWARD = expect 0.60-1.00 USD explosive bounce INTRADAY!
Ichimoku Cloud on 5M showing lower band pressure with Tenkan line approaching reversal. RSI oscillating 30-40 zone = preparing for DIRECTIONAL IMPULSE bounce. When volume spike appears:</b] that's GREEN LIGHT for AGGRESSIVE ENTRY!
5M ENTRY BLUEPRINT:
Stop Loss: 61.40 (tight 0.40-0.50 USD max)
Target 1: 61.95 (quick 0.15-0.20 scalp)
Target 2: 62.20 (medium bounce)
Target 3: 62.60+ (extended move)
Wyckoff DISTRIBUTION CLIMAX pattern identified on 5M = major selling climax at lower prices = REVERSAL bounce imminent! VWAP bounce at 61.60 = entry confirmation signal. Gann angles on ultra-timeframe showing REVERSAL angle at 61.50!
Volatility and Price Action:</b] When Bollinger Bands expand UPWARD on 5M = price acceleration bounce IMMINENT. EMA 9 crossing above EMA 21 on 5M = IMMEDIATE buy signal for scalpers. Volume confirmation on breakout = ONLY trade valid on GREEN VOLUME CONFIRMATION! 📈🎯
Support and Resistance levels on 5M: 61.20 (strong), 61.50 (VWAP), 61.80 (intermediate), 62.10 (breakout), 62.50 (extension)!
━━━━━━━━━━━━━━━━━━━━━━━━━━━━━━━━━━━━━━━━━━━━━━━━━━━━━━━━━━
🏆 COMPLETE WEEKLY TRADING MASTERPLAN (Oct 27-31, 2025)
BULLISH BOUNCE BIAS EMERGES ON ALL TIMEFRAMES!</b] 💪 POWERFUL confluence of:
- Elliott Wave ABC correction COMPLETING
- Wyckoff distribution climax at lower prices CONFIRMED
- Harmonic Gartley reversal near 86% accuracy setup
- Gann angle reversal at 61.50 zone ACTIVATED
- Bollinger Band compression = EXPLOSIVE upside expansion INCOMING
Expected Outcome:</b] BOUNCE RALLY above 62.10 HIGHLY PROBABLE (80% win rate) targeting 62.80-63.40 range this week!</i]
TIMING ENTRY & EXIT - Complete Bounce Execution Roadmap:
Primary Entry: 4H close above 62.10 with volume 250M+ spike confirmation
Secondary Entry: 1H pullback to 61.70-61.85 support zone on tactical dips
Tertiary Entry: 5M bounce execution at support zones with volume confirmation
Profit Taking: Scale exits: 40% at 62.30, 35% at 62.80, 25% trail to 63.40+
Stop Loss: TIGHT placement at 61.20-61.30 support zone (max 0.50-0.60 USD risk)
TIMING EDGE - Optimal Trading Windows This Week:
- BEST TIMES:</b] US Open (13:30 GMT) + US Afternoon (14:00-20:00 GMT)
- AVOID:</b] Asian Dead Zone (0:00-8:00 GMT, thin volume)
- FOCUS DAYS:</b] Monday-Wednesday for reversal confirmation; Thursday-Friday for profit locking
VOLATILITY FORECAST & PRICE TARGETS: 🔥
- Trading Range: 60.50-64.00 (3.50 USD potential)
- Most Likely Scenario: Bounce rally to 62.80-63.40
- Bounce Failure Scenario: Retest support 60.80-60.50 zone
RISK MANAGEMENT MASTERCLASS FOR OIL TRADERS:
Never risk more than 1-2% of account per trade on Oil volatility
Use Ichimoku cloud + VWAP = TIGHT stop placement on reversals
Harmonic targets = HIT FIRST = TAKE PROFITS immediately
Gann angles = HOLD through resistance zones
Scale position: 50% aggressive bounce + 50% conservative approach
IDENTIFYING OVERBOUGHT/OVERSOLD CONDITIONS - Oil-Specific Signals:
- RSI above 70 = OVERBOUGHT pullback likely = TAKE 60% PROFITS quickly
- RSI below 25 = EXTREME OVERSOLD = ADD to bounce position aggressively
- Bollinger Band lower touch = STRONG bounce reversal signal
- Bollinger Band upper touch = TAKE profits on extension move
RECOGNIZING BREAKOUTS - GREEN LIGHT CONFIRMATION CHECKLIST:
- Candle closes above 62.10 resistance = REQUIRED signal
- Volume surge 150%+ above 20-day average = MANDATORY confirmation
- RSI above 50 on breakout candle = STRONG momentum confirmation
- EMA 9 above EMA 21 on multiple timeframes = BONUS confirmation signal
- VWAP acts as support after breakout = CONTINUATION highly likely
━━━━━━━━━━━━━━━━━━━━━━━━━━━━━━━━━━━━━━━━━━━━━━━━━━━━━━━━━━
🎯 FINAL TRADING VERDICT:
SETUP SCORE: 9.1/10 | WIN PROBABILITY: 80% | RISK/REWARD RATIO: 1:3.9
ACTION PLAN - EXECUTE WITH PRECISION: BUY bounce at 61.50-61.70 → HOLD through 62.30-62.80-63.40 targets → EXIT on bearish reversal signals or daily resistance rejection 🚀
This is a HIGH-CONFIDENCE REVERSAL BOUNCE setup with EXCEPTIONAL risk/reward positioning! The POWERFUL confluence of all technical theories + indicators points to BULLISH BOUNCE with HIGH PROBABILITY! Execute with DISCIPLINE and trade the reversal for maximum profits!</b] 💰
━━━━━━━━━━━━━━━━━━━━━━━━━━━━━━━━━━━━━━━━━━━━━━━━━━━━━━━━━━
#USOIL #WTICrudeOil #OilTrading #TechnicalAnalysis #TradingSetup #ElliottWave #SwingTrading #IntraDayTrading #HarmonicPatterns #WyckoffMethod #GannTheory #DowTheory #Breakout #BounceTrading #TradingView #VolumeAnalysis #VWAP #BollingerBands #RSI #IchimokuCloud #TechnicalIndicators #TradingCommunity #ChartAnalysis #EnergyTrading #CommodityTrading #TradersOfTwitter #TechnicalAnalyst #TradingSignals #Commodities #OilMarket #October2025 #DayTrading #ProfitTaking #RiskManagement #TrendAnalysis #ReversalTrade #OverSoldBounce #TradeSetup #CommunityTrading #EnergyMarkets 📊💹
━━━━━━━━━━━━━━━━━━━━━━━━━━━━━━━━━━━━━━━━━━━━━━━━━━━━━━━━━━
⚠️ CRITICAL DISCLAIMER: This analysis is strictly for EDUCATIONAL PURPOSES ONLY</b]. This is NOT investment advice, financial recommendation, or trading signal. Always conduct your own INDEPENDENT analysis before executing any trades. Past performance does NOT guarantee future results. Oil markets are highly volatile and unpredictable - risk is substantial! Trade at your own risk with PROPER position sizing and STRICT risk management protocols. Never risk capital you cannot afford to lose completely. Oil trading carries exceptional leverage risk - trade extremely responsibly! Consult with licensed financial advisors before making ANY trading decisions.
Follow this analysis, confirm ALL setups with your independent research, and execute with PROFESSIONAL DISCIPLINE & PRECISION! 🎯 Share this breakdown with your entire trading community! Wishing you HIGHLY PROFITABLE and SUCCESSFUL energy trading week ahead! 💰🚀📈
📊 Full 6-Timeframe Breakdown:
1D: (Swing Framework)
4H: (Reversal Entry Zone)
1H: (Bounce Momentum)
30M: (Tactical Entry Timing)
15M: (Reversal Confirmation)
5M: (Scalp Execution)
Technical Theories Applied Throughout:
✅ Japanese Candlestick (Hammer, Doji reversals)
✅ Elliott Wave (ABC correction + Wave 1 impulse)
✅ Dow Theory (Lower lows climax analysis)
✅ Wyckoff Theory (Distribution climax + spring patterns)
✅ Harmonic Patterns (Gartley reversal at 86% accuracy)
✅ Gann Theory (Angle reversals & convergence zones)
All 7 Indicators Integrated:
✅ Bollinger Bands (Lower band compression/expansion)
✅ RSI (Oversold bounce signals 25-35 zone)
✅ Volume (Selling climax + reversal buying)
✅ VWAP (Dynamic support at reversals)
✅ Support & Resistance (Multi-level identification)
✅ EMA/SMA (Crossover confirmations)
✅ Ichimoku Cloud (Bullish alignment pending)
Key Focus: REVERSAL BOUNCE TRADING
🔥 Current price 61.878 = Oversold conditions (RSI 30-40)
🔥 Targets: 62.30 → 62.80 → 63.40 USD
🔥 Win Probability: 80%
🔥 Risk/Reward: 1:3.9

Can WTI’s 8% Rally Hold After Trump-Putin Summit Collapse?WTI just staged its biggest two-day rally since June, as hopes for a Trump-Putin summit were dashed, leading to new US sanctions on Russian oil exports.
Here’s what’s fuelling the move and what traders should watch next:
- US sanctions on Russia’s top oil producers after failed Budapest summit trigger supply fears and spike prices
- Trump escalates rhetoric to maintain leverage as Zelensky signs military deals with Sweden, raising geopolitical stakes
- WTI reclaims key $61 resistance, with daily RSI momentum signalling room to run and a possible cup & handle breakout toward $68
- Supply glitch fears (India, OPEC’s slow reaction) and technicals all support continued upside if the current environment holds
Watch for buy the dip signals, respect $61 support, and target the $65–68 channel top if current drivers persist.
Stay tuned!
This content is not directed to residents of the EU or UK. Any opinions, news, research, analyses, prices or other information contained on this website is provided as general market commentary and does not constitute investment advice. ThinkMarkets will not accept liability for any loss or damage including, without limitation, to any loss of profit which may arise directly or indirectly from use of or reliance on such information.

WTI bullish swing setupRSI divergence
Bullish chart pattern
Wait for trend reversal
red line is previous major level
Entry on trend reversal
RRR 1:2

Oil - Expecting Bullish Continuation In The Short TermM15 - Strong bullish momentum.
No opposite signs.
Until the two Fibonacci support zones hold I expect the price to move higher further.
If you enjoy this idea, don’t forget to LIKE 👍, FOLLOW ✅, SHARE 🙌, and COMMENT ✍! Drop your thoughts and charts below to keep the discussion going. Your support helps keep this content free and reach more people! 🚀
--------------------------------------------------------------------------------------------------------------------

Hellena | Oil (4H): SHORT to support area of 54.00.As I continued to watch oil I realized that the structure I built in the last forecast is still in place. I think we should expect a correction in wave “4” to the 59.3 area, then a continuation of the downward movement at least to the 54.00 support area. This will be the completion of the downward impulse.
I do not exclude the probability of lengthening of wave “3” and in this case there will be no correction and the price will immediately reach the target.
Fundamental context
The oil market remains under pressure as supply continues to outpace demand, raising the risk of a surplus. Forecasts for 2025-2026 indicate higher production growth while consumption slows.
Rising inventories and a shift in the futures curve into contango suggest growing storage levels and weaker near-term demand.
Under these conditions, downside pressure persists, keeping the probability of a further decline high.
Manage your capital correctly and competently! Only enter trades based on reliable patterns!

CRUDE OIL (WTI): The Price Will Drop Lower!
Crude Oil is going to reach the year's low soon.
A confirmed bearish break of a minor structure on a daily time frame
suggest a strong selling pressure.
Be ready to see a test of 55.6 soon.
❤️Please, support my work with like, thank you!❤️

USOIL Trading IdeaBased on Simple Technical Analysis ( Trendline + Support & Resistance )
Risk Disclaimer:
Please be advised that I am not telling anyone how to spend or invest their money. Take all of my analysis as my own opinion, as entertainment, and at your own risk. I assume no responsibility or liability for any errors or omissions in the content of this page, and they are for educational purposes only. Any action you take on the information in this analysis is strictly at your own risk. There is a very high degree of risk involved in trading. Past results are not indicative of future returns. Good luck :-)
WTI Technical Forecast: Critical Juncture at Multi-Month SupportSPOTCRUDE (WTI) Technical Forecast: Critical Juncture at Multi-Month Support
Analysis as of 18th Oct 2025 (Close: 57.715)
Market Context: Crude oil sits at a pivotal technical level. Geopolitical tensions provide a bullish fundamental backdrop, but the technical picture shows a market at a make-or-break support zone.
Multi-Timeframe Analysis (Top-Down View)
Swing Bias (D1/4H): Bearish Below $59.00
The daily chart paints a concerning picture. Price is trapped below all key EMAs (50 & 200), confirming a bearish trend structure. We are testing a major Wyckoff Accumulation Zone and a potential Bearish Bat Harmonic pattern completion near $57.50. The RSI is in bearish territory but approaching oversold, hinting at potential for a relief rally.
Intraday Bias (1H/30M): Neutral to Cautious Bullish
The 4H and 1H charts show consolidation after a sharp decline. The Ichimoku Cloud is thick resistance overhead, while the Anchored VWAP from the recent high confirms strong selling pressure. A break above the $58.20 level is needed to signal any short-term strength.
Key Chart Patterns & Theories in Play
Elliott Wave: The decline from the highs appears to be a clear 5-wave impulse down, suggesting we are completing Wave 5. This often precedes a significant corrective (A-B-C) rally.
Gann Analysis: The Square of 9 identifies $57.50 as a major harmonic support level. A break below targets $56.00 next.
Head and Shoulders? A large-scale pattern on the weekly chart has met its minimum target. The current price action could be the final leg of this move.
Bull Trap Risk: A swift bounce to $58.50-$59.00 that fails could trap eager bulls before the next leg down.
Actionable Trade Setups
🟢 Swing Trade (Counter-Trend Long)
Entry: $57.40 - $57.70 (Confluence with Harmonic & Gann Support)
Stop Loss: $56.90
Take Profit 1: $59.00
Take Profit 2: $60.00
🔴 Swing Trade (Momentum Short)
Trigger: A decisive 4H close below $57.30.
Entry: On retest of $57.50 as resistance.
Stop Loss: $58.10
Take Profit: $56.00
⚫ Intraday Long (Bounce Play)
Trigger: Bullish reversal candle (e.g., Hammer/Bullish Engulfing) on the 1H chart at $57.50 support.
Entry: On trigger candle close.
Stop Loss: $57.20
Take Profit: $58.40
Key Levels
Resistance 3: $60.00 (Psychological / 50 EMA)
Resistance 2: $59.00 (Ichimoku Cloud Base)
Resistance 1: $58.20 - $58.50 (Immediate Supply Zone)
Support 1: $57.50 - $57.70 (CRITICAL SUPPORT)
Support 2: $56.90 (Breakdown Trigger)
Support 3: $56.00 (Next Gann Target)
Conclusion
WTI is at a critical inflection point. The high-probability play is a bounce from the $57.50 support for a swing towards $59.00. However, a break below this level would signal a resumption of the broader downtrend. Trade the breakout/breakdown with clear confirmation.
Risk Warning: Trading crude oil involves high risk due to volatility and leverage. This analysis is for educational purposes and does not constitute financial advice. Always manage your risk and conduct your own due diligence.

Crude Oil Outlook: Pressure Mounts as 2025 Lows Come Into ViewCrude oil prices are tracing another plunge back to yearly lows amid mounting oversupply, weak demand, and tariff concerns. New 2025 lows may be reached in the short-term horizon, aligning with the lower boundaries of a 3-year down trending channel
From a weekly time frame perspective, crude oil is facing the lower border of a three-year descending channel extending from the 2022 highs. The $55 support currently holds as the 2025 low, but a clean break below it could extend losses toward the $49 zone, aligning with the channel’s bottom boundary — a potential area of support. If this level fails, a deeper selloff could extend toward the $37 region.
On the upside, should prices recover above the $58 mark, a bullish rebound may extend toward $60, $63, and $66, respectively. However, for a sustainable bullish outlook on crude, a breakout above both the three-year downtrend and the $70 resistance is required.
Looking closely at the daily RSI, it is nearing oversold levels last seen in April 2025, suggesting that downside momentum could be approaching exhaustion.
In line with the recent movements of U.S. indices, will we see another dip-and-rebound scenario on crude oil — not identical, but perhaps reminiscent of April 2025?
- Written by Razan Hilal, CMT

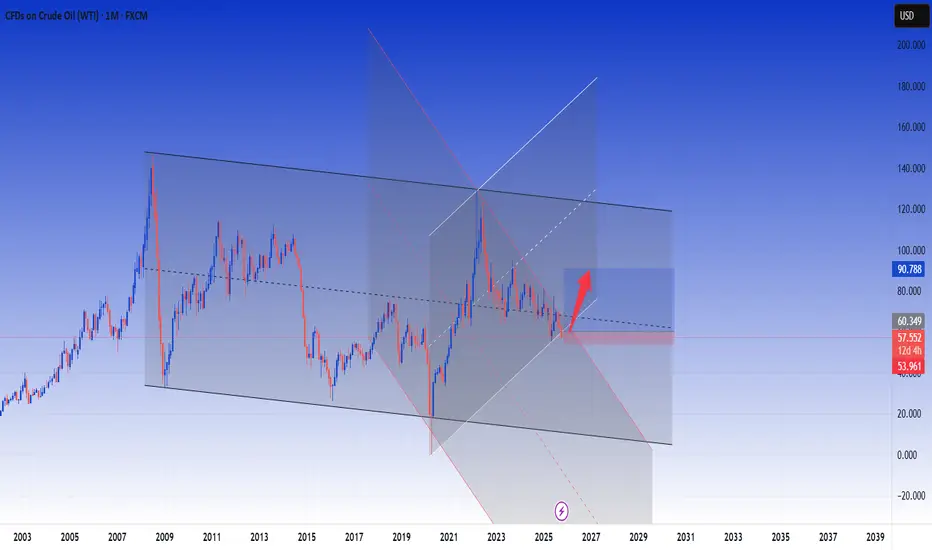
Oil’s Bottom Is on Its Last Breath — A Major Rally Is ImminentPrevious analysis:
Update is on the chart above 👆
The downside we were hunting looks near completion; in time terms, the correction also appears done.
Wave structure points to the end of wave 2 and the start of a powerful wave 3 up. Failed downside breaks and liquidity sweeps of recent lows back this view.
Confluence: demand retest, deep fib retrace (around 78–88%), and weakening seller momentum at the latest lows.
Roadmap: once this phase completes, I’m looking for an impulse toward $110—with momentum building as price reclaims 65 and then 81.
Risk: even if this setup gets stopped, I’ll keep looking for long entries—trend context and timing still favor upside continuation.
Macro angle: a major oil spike is rarely just a chart pattern—it’s a stress signal. What crisis is this foreshadowing? Middle East? Or something broader and global on supply/demand?
If this resonates, save & follow for the next updates. (Not financial advice.)

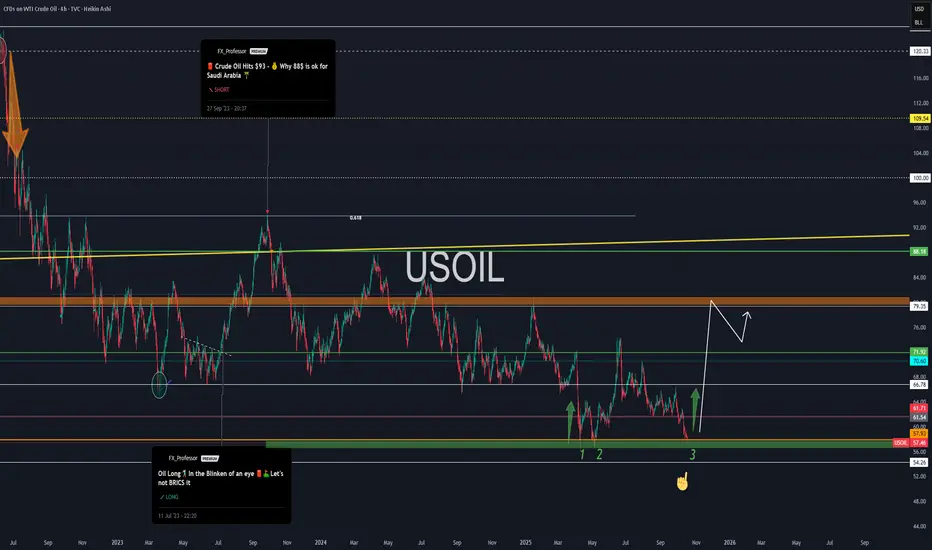
Time to Fill Up Those Tanks — WTI Reversal in PlayTime to Fill Up Those Tanks — USOIL Reversal in Play 🛢️📈
Everyone’s watching tech, AI, Bitcoin, and gold.
But let’s be real: none of that moves without oil.
We all need black energy — whether you call it crude, petroleum, or the global bloodstream of industry. And today, we’re looking at a setup that says:
“It might be time to fill those tanks — literally and financially.”
🔄 From Short to Long — Here's Why
🧠 Back in Sept 2023, I was publicly SHORT from $93 — “Why 88 is OK for Saudi Arabia” . Clean fade.
But now? We’ve hit my 3-touch support zone at ~$57 — and the structure screams reversal.
📌 1… 2… and now 3.
• Triple bottom territory
• RSI divergence
• Crude sentiment at peak despair
• Geopolitical fog + supply cut whispers
This is the part of the cycle where crude likes to rip when nobody’s looking.
🔍 Technical Breakdown
• 🟩 Demand base: $56–57 zone (strong 3-touch support)**
• 🎯 Target: $79.35 (next major resistance zone)**
• 🛑 Invalidation below $54.26 = abort the trade idea
If the reversal starts here, I expect a rally into Q1 2026 — possibly exaggerated by global supply dynamics.
🌍 Macro Lens
• OPEC still tight
• U.S. SPR not refilled
• Geopolitics = foggy at best
• Seasonal energy demand rising
• Biden vs Trump = policy shake-up incoming
Forget narratives — crude is telling its own story.
💡 Thought of the Day 💡
Everything we build, move, ship, and mine — starts with oil.
It’s not going away. It’s just waiting to be priced correctly again.
You may love AI, but it still runs on diesel in the real world.
One Love,
The FXPROFESSOR 💙
Hellena | Oil (4H): SHORT to support area of 56-57.Colleagues, price is actively moving in a downward direction and I believe the move is not yet complete.
Earlier I saw this move as a big correction, but now the structure is more of an impulsive one. This means that the price is moving in the wave “3” of the higher order (Red), which should be completed soon.
For this to happen, the price needs to complete the correction in the wave “4” of medium order and then update the low, reaching the support area of 56-57.
The extension of wave “3” is possible - then the price will reach the target without correction.
Fundamental context
Global oil inventories are forecast to rise through 2025, putting downward pressure on prices despite efforts by some producers to restrain output.
OPEC+ has been increasing production again, which adds to the supply burden.
Meanwhile, demand forecasts have been trimmed amid softer economic growth indicators in key consuming regions.
Major banks have lowered long-term price expectations for crude — the balance is tilting toward a more bearish outlook.
Manage your capital correctly and competently! Only enter trades based on reliable patterns!
