WTI ShortThe alliance, including Russia and Saudi Arabia, agreed to a phased increase in production, which led to an increase in supply on the market.
OPEC+ production increase parameters
April 2025: Increase in production by 137,000 barrels per day
May-July 2025: Monthly increase of 411,000 barrels per day
August 2025: Increase by 548,000 barrels per day
September 2025: Increase by 547,000 barrels per day
October 2025: Planned increase by 137,000 barrels per day
OPEC+ plans to fully restore production cuts in 2023. Initially, a gradual increase in production was planned until September 2026, but due to favorable market conditions, the process was accelerated
US trade policy, which introduced customs duties on goods from many countries, also affects the price of oil
We expect a decline in the American grade of oil to $ 60
WTI

CRUDE OIL FREE SIGNAL|SHORT|
✅CRUDE OIL is going up now
But a strong resistance level is ahead at
Thus I am expecting a pullback and we
Will be able to enter a the following short trade:
------------------------
Entry: 86.500
Stop Loss: 86.700
Take Profit: 86.100
------------------------
SHORT🔥
✅Like and subscribe to never miss a new idea!✅

Pre Market Movers and News - BABA SurgingDiscussing some of the news related events today.
What do traders need to watch today?
Looking at SPY, Oil, Baba, NVDA, BE, MU, LAC

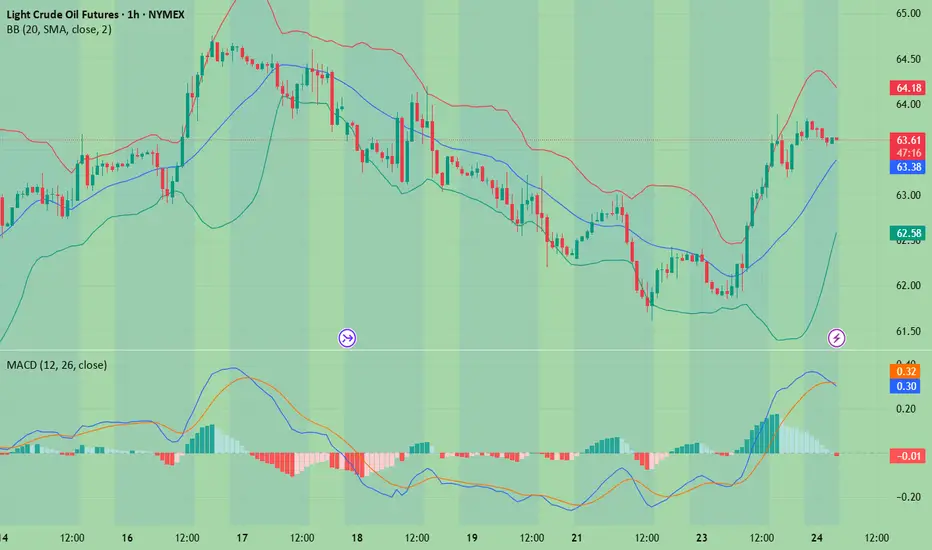
WTI(20250924)Today's AnalysisMarket Analysis:
Federal Reserve Chairman Powell stated that the policy rate remains somewhat restrictive, but allows the Fed to better respond to potential economic developments; tariffs are expected to have a one-time pass-through effect; and decisions will "never be based on political considerations." Fed spokespersons noted that Powell's comments indicate that he believes interest rates remain tight, potentially opening the door for further rate cuts.
Technical Analysis:
Today's Buy/Sell Levels:
63.01
Support and Resistance Levels:
65.01
64.26
63.77
62.24
61.75
61.01
Trading Strategy:
On a break above 63.77, consider a buy entry, with the first target at 64.26.
On a break below 63.01, consider a sell entry, with the first target at 62.24
WTI key levels in play as oil prices bounceCrude oil is worth close attention. Prices have been consolidating within what appears to be a descending triangle formation — a pattern that typically signals continuation of a downtrend. But today we have seen a nice bounce off the key support area around $62, where prior lows align with the triangle’s base. While intraday wobbles have pierced this level, daily closes have generally respected it, making it the battleground to watch. A clean break beneath $62 would likely open the door for a deeper move towards $60, and potentially $55 if selling momentum gathers pace.
On the topside, the picture is equally clear. The area between $63.60 to 65.00, the grey-shaded resistance region, previously a pivot zone, has been a major resistance area in recent trade. The bearish trendline also intersects in this zone. To turn convincingly bullish on oil, we’d need to see a decisive breakout above that cluster of resistance.
By Fawad Razaqzada, market analyst with FOREX.com

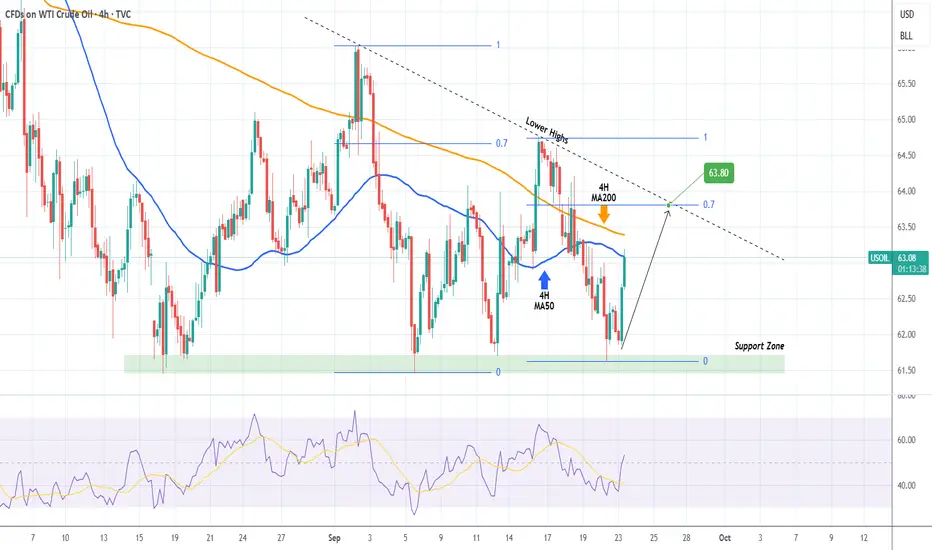
WTI OIL Descending Triangle targeting its top.WTI Oil (USOIL) has been trading within a Descending Triangle and following yesterday's test of its Support Zone, it is rebounding.
This Bullish Leg has already touches the 4H MA50 (blue trend-line) and based on the previous one, it should extend to at least the 0.7 Fibonacci retracement level.
This gives us a 63.80 Target before the pattern's Lower Highs trend-line is tested.
-------------------------------------------------------------------------------
** Please LIKE 👍, FOLLOW ✅, SHARE 🙌 and COMMENT ✍ if you enjoy this idea! Also share your ideas and charts in the comments section below! This is best way to keep it relevant, support us, keep the content here free and allow the idea to reach as many people as possible. **
-------------------------------------------------------------------------------
💸💸💸💸💸💸
👇 👇 👇 👇 👇 👇
CRUDE OIL (WTI): Pullback Trade From Support
WTI Crude Oil looks oversold after a test of a significant
daily horizontal demand zone.
A formation of a bullish imbalance candle on an hourly time frame
indicates a strength of that structure.
With a high probability, the price will pull back to 62.38
❤️Please, support my work with like, thank you!❤️
I am part of Trade Nation's Influencer program and receive a monthly fee for using their TradingView charts in my analysis.

WTI(20250922)Today's AnalysisMarket News:
Federal Reserve Board Governor Milan: Expects continued rate cuts in the coming months and will work to convince other policymakers to cut more quickly; Minneapolis Fed President Neel Kashkari: Two more rate cuts this year would be appropriate.
Technical Analysis:
Today's Buy/Sell Levels:
62.58
Support and Resistance Levels:
63.70
63.28
63.01
62.15
61.87
61.45
Trading Strategy:
If the market breaks above 62.58, consider buying, with the first target at 63.01.
If the market breaks below 62.15, consider selling, with the first target at 61.87

CRUDE OIL LONG FROM SUPPORT|
✅CRUDE OIL is going down to retest
A horizontal support around 61.80$
Which makes me locally bullish biased
And I think that we will see a rebound
And a move up from the level
Towards the target above at 62.80$
LONG🚀
✅Like and subscribe to never miss a new idea!✅

BRIEFING Week #38 : Waiting for Something to Happen !Here's your weekly update ! Brought to you each weekend with years of track-record history..
Don't forget to hit the like/follow button if you feel like this post deserves it ;)
That's the best way to support me and help pushing this content to other users.
Kindly,
Phil

USOIL (WTI Crude Oil) Intraday & Swing Outlook🛢️ USOIL (WTI Crude Oil) Forecast – Intraday & Swing Outlook 🚀📉
Asset Class: USOIL (SPOTCRUDE / WTI CASH)
Last Closing Price: $62.796
Date/Time: 20th Sept 2025 – 12:50 AM UTC+4
🔍 Market Context
Crude oil remains in a volatile zone as macro factors like OPEC+ policy, global demand recovery, and geopolitical risks continue to steer momentum. Traders must prepare for short squeezes, traps, and breakout plays this week.
📊 Technical Overview
Chart Theories Applied:
📈 Elliott Waves – corrective Phase B nearing end.
🔄 Wyckoff – signs of re-accumulation spotted.
🔺 Head & Shoulders (Inverse) – potential bullish reversal.
🔮 Gann Angles & Time Cycle – short-term resistance clustering near $64.50.
🛠️ Indicators
🔵 RSI (H1) → Neutral zone (48–52).
📏 VWAP Anchored → $62.20 (support pivot).
📉 EMA 20 / EMA 50 → Bullish cross on H4 confirmed.
🎯 Bollinger Bands → Expansion phase → Expect high volatility.
🕒 Timeframe Strategies
📌 Intraday (5M / 15M / 1H / 4H)
Buy Entry (Scalp): $62.20 – $62.50 🟢
TP1: $63.20 🎯
TP2: $63.85 🎯
SL: $61.80 ❌
Sell Entry (Scalp): $63.80 – $64.20 🔴
TP1: $63.00 🎯
TP2: $62.40 🎯
SL: $64.70 ❌
📌 Swing (Daily / Weekly)
Buy Zone: $61.50 – $62.00 🟢
Targets: $65.20 / $67.40 / $70.00 🎯
Stop Loss: $60.50 ❌
Sell Zone (Rejection): $67.40 – $68.00 🔴
Targets: $64.50 / $62.20 🎯
Stop Loss: $68.80 ❌
⚠️ Risk Management
Volatility expected due to Fed rate guidance & OPEC+ commentary.
Stick to 2–3% capital risk per trade.
Watch for bull/bear traps near breakout zones.
📌 Summary
Intraday: Range $62.20 – $64.20 ⚖️
Swing: Upside bias if $61.50 holds strong 💹
Key Resistance: $64.50 / $67.40
Key Support: $61.50 / $60.50
🔥 Bias: Short-term sideways → Medium-term bullish above $61.50.
For individuals seeking to enhance their trading abilities based on the analyses provided, I recommend exploring the mentoring program offered by Shunya Trade. (Website: shunya dot trade)
I would appreciate your feedback on this analysis, as it will serve as a valuable resource for future endeavors.
Sincerely,
Shunya.Trade
Website: shunya dot trade

CRUDE OIL Rebound Ahead! Buy!
Hello,Traders!
CRUDE OIL has been ranging
For a while now and the
Price is now about to
Retest the horizontal
Support level of 61.50$
From where a local
Bullish correction is
To be expected
Buy!
Comment and subscribe to help us grow!
Check out other forecasts below too!
Disclosure: I am part of Trade Nation's Influencer program and receive a monthly fee for using their TradingView charts in my analysis.

WTI OIL This is the bigger picture.WTI Oil (USOIL) is currently on the 2nd straight green week ahead of today's Fed Rate Decision. The long-term pattern though is has been a Channel Down since August 2022 and until it gets invalidated, the trend will remain bearish.
In fact, it has made 3 emphatic rejections on the 1W MA200 (orange trend-line) since August 12 2024. The 1W RSI sequence since then, resembles the pattern of 2023, where WTI found a Higher Lows Support on the 1W MA200. The last such contact was on the 0.786 Fibonacci retracement level before a last rebound to the top of the Channel Down.
That is exactly what we are expecting now, with the new 0.786 Fib waiting at $59.50. That is our medium-term Target.
-------------------------------------------------------------------------------
** Please LIKE 👍, FOLLOW ✅, SHARE 🙌 and COMMENT ✍ if you enjoy this idea! Also share your ideas and charts in the comments section below! This is best way to keep it relevant, support us, keep the content here free and allow the idea to reach as many people as possible. **
-------------------------------------------------------------------------------
💸💸💸💸💸💸
👇 👇 👇 👇 👇 👇

WTI: Oil Markets on Edge Despite Trump Considering Major TariffsOil prices could drop if Trump backs down on tariffs on countries buying Russian oil, but short-term bullish catalysts, like geopolitical tensions and bullish speculative bets, may still push prices up before longer-term headwinds take hold.
----------------------------------------------------------------------------------------------------------------------
Trump’s threats of steep tariffs on countries buying Russian oil have sent oil prices surging, as traders fear a global supply crunch if Russian barrels are cut off.
But here’s the twist: Trump has a history of backing down or delaying tariffs after using them as leverage. When he does, oil prices usually fall, as the immediate risk of supply disruption fades.
If he caves in again by the deadline, which is 10 to 12 days from 4 August, or extends it, oil prices could drop. The bigger picture also appears bearish: OPEC+ is ramping up supply, global demand is slowing and expected to drop in H2, and inventories are rising (first glimpse by EIA, Wed).
But with the deadline falling around 14–16 August, 2025, short-term bullish catalysts could spark a rally up to the 38.2%-61.8 % Fibonacci retracement levels, positioning WTI better for declines (conditional on Trump!).
This content is not directed to residents of the EU or UK. Any opinions, news, research, analyses, prices or other information contained on this website is provided as general market commentary and does not constitute investment advice. ThinkMarkets will not accept liability for any loss or damage including, without limitation, to any loss of profit which may arise directly or indirectly from use of or reliance on such information.

WTI falls after US slaps 50% tariff on India over Russian oilWTI oil prices have dropped from $65 to around $62.80 as markets react to new US tariffs on India, triggered by India’s ongoing oil trade with Russia. These tariffs, along with threats of even higher tariffs on China, are weighing on global demand and pushing oil prices lower. Meanwhile, Iran’s oil production has hit multi-year highs, adding more supply to the market and reinforcing the bearish trend.
Technically, oil has broken below a key Fibonacci support level, signalling a deeper pullback. If prices fall below $62, further downside toward $57 is possible. Upside moves may be short-lived unless there’s a major geopolitical shock, such as an escalation in the Russia-Ukraine conflict. For now, both the macro environment and technical signals indicate continued pressure on oil prices.
This content is not directed to residents of the EU or UK. Any opinions, news, research, analyses, prices or other information contained on this website is provided as general market commentary and does not constitute investment advice. ThinkMarkets will not accept liability for any loss or damage including, without limitation, to any loss of profit which may arise directly or indirectly from use of or reliance on such information.

Crude Oil Monthly Forecast: September 2025
The West Texas Intermediate Crude Oil market has been rather negative during the month of August, but at the end of the month we saw the market bounce roughly 50% of the move, and as I do this analysis at the end of the month, we are sitting at a crucial level.
This does make a certain amount of sense, because there are a lot of questions right now about where the global economy is going.
Crude Oil and the Economy
Keep in mind that crude oil is extraordinarily important for most economies, and of course the transportation of goods and services. In other words, crude oil will rally in times of economic growth but also will struggle in times where growth is extraordinarily limited. That’s the question we find ourselves trying to answer at the moment, and this may be part of the reason why we are hanging around and trying to sort out where we are going next.
Another major problem at the moment is the fact that Russia, OPEC, in the United States are all ramping up production, which of course will drive down price as supply is getting to be too much. Between that and the possibility of the global economy slowing down, this could be a very bad sign for crude oil. This isn’t to say that we need to fall apart, just that it might be extraordinarily difficult for oil to get a bit of a bid at the moment.
Ultimately, I think the $65 level continues to be an area of interest, as the price has acted like a magnet more than once. If we can rally from here, somewhere around the $60 level I would expect to see a lot of resistance. On the other hand, if we drop from here, I think somewhere around the $60 level there should be significant support. Anything below would be an extraordinarily negative sign. I believe we are trying to find some type of range, perhaps between the $62 level and the $67 level, but we will have to wait and see how that plays out. Either way, I would anticipate choppy and basically sideways action for the month.

BRIEFING Week #37 : Beware of the FOMCHere's your weekly update ! Brought to you each weekend with years of track-record history..
Don't forget to hit the like/follow button if you feel like this post deserves it ;)
That's the best way to support me and help pushing this content to other users.
Kindly,
Phil

Weekly Market Update & Analysis - 14-September-2025Weekly Market Update & Analysis
Week Ending : September 14, 2025
Analysis Framework : Institutional Intelligence Dual Renko System
Executive Summary
The past week delivered exceptional validation of our institutional intelligence framework across equity indices while confirming the deteriorating conditions in commodity and currency markets. Our three primary equity opportunities (NQ, ES, YM) demonstrated the power of trading with institutional backing, while defensive positioning in overextended and institutionally-abandoned assets proved essential for capital preservation.
Portfolio performance reflects the strength of systematic institutional intelligence application , with equity allocations advancing while defensive positioning prevented significant losses in deteriorating sectors.
Primary Opportunities - Institutional Validation Continues
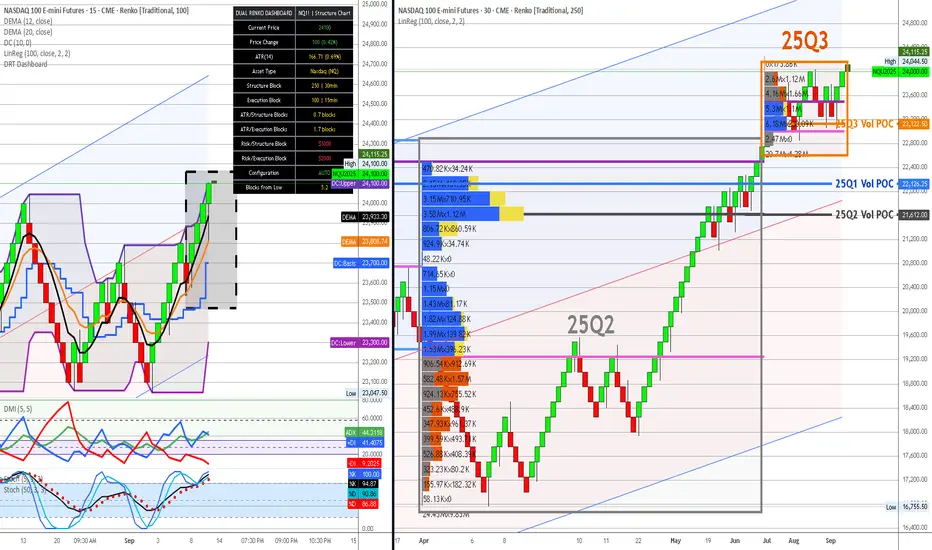
1. NASDAQ 100 (NQ) - EXCEPTIONAL PERFORMANCE VALIDATION
Previous Week Assessment : 25-30% allocation with 26.8:1 institutional backing at 23,963
Current Status : 24,100 (+0.57% weekly advance)
Institutional Intelligence Confirmed :
Structure Chart Validation : Trading above Q3 institutional accumulation with volume support
Dashboard Metrics : ATR 166.71 (0.69%) confirms low volatility, optimal block sizing maintained
Risk Management : $5,000 per 100-point execution block = excellent position sizing precision
Technical Status : All momentum indicators supporting institutional positioning
Weekly Performance Analysis :
Price Action : Steady advance above institutional zones validates smart money accumulation
Volume Confirmation : Sustained institutional engagement throughout advance
Risk Control : Minimal drawdown with institutional support holding
Momentum Quality : Clean upward progression without excessive volatility
Coming Week Outlook :
Bullish Scenario (75%) : Continuation toward 24,500-25,000 resistance levels
Consolidation (20%) : Range trading 23,800-24,300 for momentum reset
Correction (5%) : Pullback to 23,500 institutional support for accumulation
Strategy : Maintain full 25-30% allocation, trail stops using 100-point swing lows
2. S&P 500 (ES) - SOLID INSTITUTIONAL FOUNDATION
ES Combined View:
Previous Week Assessment : 20-25% allocation with 5.21:1 institutional backing at 6,575
Current Status : 6,600 (+0.38% weekly advance)
Institutional Intelligence Confirmed :
Structure Chart : Maintaining position above Q3 POC institutional accumulation
Dashboard Metrics : ATR 37.37 (0.56%) supporting current 25-point execution blocks
Volume Profile : Sustained engagement above institutional zones
Risk Framework : $1,250 per 25-point block enabling precise risk management
Weekly Performance Analysis :
Steady Advance : Consistent progress above institutional support levels
Volume Quality : Professional participation supporting price advance
Technical Health : Momentum indicators maintaining bullish alignment
Volatility Control : Low ATR environment supporting systematic approach
Coming Week Outlook :
Bullish Scenario (70%) : Advance toward 6,700-6,750 resistance zone
Consolidation (25%) : Range development 6,550-6,650 for base building
Correction (5%) : Test of 6,500 institutional support
Strategy : Maintain 20-25% core allocation with systematic profit-taking above 6,700
3. DOW JONES (YM) - OPTIMAL RISK/REWARD POSITIONING
YM Combined View:
Previous Week Assessment : 25-30% allocation with perfect YTD POC alignment at 46,050
Current Status : 46,050 (unchanged, consolidating at optimal institutional level)
Institutional Intelligence Excellence :
YTD POC Validation : Trading precisely at institutional consensus level (45,150 area)
Dashboard Metrics : ATR 238.47 (0.52%) confirming 150-point execution blocks optimal
Risk Profile : $750 per 150-point block = superior risk management
Support Quality : Cross-timeframe institutional validation providing exceptional downside protection
Weekly Performance Analysis :
Consolidation Strength : Holding institutional consensus demonstrates smart money confidence
Volume Distribution : Balanced institutional participation during consolidation
Risk Management : Minimal downside exposure with institutional support
Setup Quality : Optimal positioning for next institutional advance
Coming Week Outlook :
Bullish Scenario (80%) : Breakout toward 46,800-47,200 levels with institutional support
Consolidation (15%) : Continued range at institutional consensus for accumulation
Correction (5%) : Brief test toward 45,500 for final institutional positioning
Strategy : Maintain maximum 25-30% allocation, add on any weakness toward 45,700
Secondary Holdings - Defensive Management Required
4. WTI CRUDE OIL (CL) - TECHNICAL IMPROVEMENT NOTED
CL Combined View:
Previous Week Assessment : 8-12% defensive allocation due to technical conflicts at 62.94
Current Status : 62.25 (-1.10% weekly decline)
Mixed Signal Assessment :
Institutional Support : Structure chart shows continued Q2/Q3 accumulation backing
Technical Challenges : Dashboard ATR 0.33 (0.53%) appropriate, but momentum concerns persist
Price Action : Testing lower end of institutional accumulation zone
Risk Management : $250 per 0.25 execution block maintaining precision
Weekly Performance Analysis :
Institutional Respect : Decline contained within smart money accumulation zones
Volume Behavior : Some institutional support visible near Q2 POC levels
Technical Status : DEMA maintaining bullish bias despite price weakness
Defensive Positioning : Lower allocation preventing significant capital impact
Coming Week Outlook :
Bullish Scenario (50%) : Recovery above 63.50 with institutional volume confirmation
Neutral Scenario (35%) : Range trading 62.00-64.00 within institutional zone
Bearish Scenario (15%) : Break below 61.50 requiring defensive exit protocols
Strategy : Maintain 8-12% defensive allocation, monitor for technical confirmation signals
High-Risk Positions - Defensive Protocols Validated
5. NATURAL GAS (NG) - INSTITUTIONAL ABANDONMENT ACCELERATING
NG Combined View:
Previous Week Assessment : 3-5% minimal allocation due to institutional disengagement at 2.950
Current Status : 2.960 (+0.34% minor recovery)
Deteriorating Fundamentals :
Institutional Intelligence : 65% volume decline from Q1 peaks continues
Dashboard Warning : ATR 0.04 (1.41%) suggesting continued volatility risk
Technical Status : Bearish momentum persisting despite minor recovery
Liquidity Concerns : /MNG volume insufficient for meaningful position sizing
Weekly Performance Analysis :
Minimal Recovery : Slight advance insufficient to reverse institutional disengagement
Volume Quality : Limited institutional participation in recovery attempt
Risk Limitation : 3-5% allocation preventing significant portfolio impact
Framework Validation : Defensive positioning justified by continued weakness
Coming Week Outlook :
Neutral Scenario (45%) : Range trading 2.90-3.10 with limited institutional interest
Bearish Scenario (40%) : Resumption of decline toward 2.70-2.80 levels
Bullish Scenario (15%) : Recovery above 3.20 requiring fresh institutional engagement
Strategy : Maintain minimal 3-5% allocation, avoid increases until institutional return
6. EURO FUTURES (6E) - EXTENSION CORRECTION ACCELERATING
6E Combined View:
Previous Week Assessment : 2-3% minimal allocation due to 12.9% dangerous extension at 1.1792
Current Status : 1.1800 (+0.07% minimal advance)
Dangerous Extension Persists :
YTD POC Distance : Still 12.1% above institutional consensus at 1.0525
Dashboard Metrics : ATR 0.0 (0.23%) showing compressed volatility before correction
Technical Deterioration : Extension beyond all institutional positioning zones
Risk Assessment : $1,250 per 0.002 block = high risk per unit exposure
Weekly Performance Analysis :
Consolidation Warning : Minimal movement often precedes major corrections
Institutional Void : Trading well beyond any smart money positioning
Defensive Success : 2-3% allocation limiting portfolio exposure
Correction Preparation : Framework positioning for mean reversion opportunity
Coming Week Outlook :
Bearish Scenario (65%) : Correction toward 1.1200-1.0800 institutional zones
Neutral Scenario (25%) : Continued consolidation at dangerous extension levels
Bullish Scenario (10%) : Further extension creating extreme correction risk
Strategy : Maintain minimal 2-3% defensive allocation, prepare for correction opportunity
7. GOLD FUTURES (GC) - VOID TERRITORY CORRECTION UNDERWAY
GC Combined View:
Previous Week Assessment : 0% allocation due to catastrophic void territory at 2,682
Current Status : 2,687 (+0.19% minor advance)
Catastrophic Risk Confirmed :
Institutional Void : Still 12.2%+ beyond all smart money positioning
Dashboard Alert : ATR 15.93 (0.59%) insufficient for current extension risk
Technical Status : Trading in complete institutional abandonment zone
Correction Vulnerability : $500 per 5-point block = extreme risk if positioned
Weekly Performance Analysis :
Void Persistence : Continued trading beyond institutional intelligence zones
Correction Preparation : Framework positioning for eventual return to smart money levels
Capital Preservation : 0% allocation preventing catastrophic losses during correction
Professional Discipline : Maintaining avoidance despite minor advances
Coming Week Outlook :
Bearish Scenario (70%) : Major correction toward 2,380-2,450 institutional zones
Neutral Scenario (20%) : Continued consolidation at void territory levels
Bullish Scenario (10%) : Further extension creating ultimate correction setup
Strategy : Maintain 0% allocation, prepare for institutional zone re-entry opportunity
Portfolio Management & Risk Assessment
Current Allocation Status
Equity Indices : 70-80% (NQ 25-30%, ES 20-25%, YM 25-30%)
Defensive Commodities : 10-15% (CL 8-12%, NG 3-5%)
High-Risk Positions : 2-3% (6E minimal allocation)
Avoided Assets : 0% (GC complete avoidance)
Cash/Opportunity : 10-15% (correction and opportunity preparation)
Risk Management Performance
Institutional Validation : Equity positions performing as expected with smart money backing
Defensive Success : Limited commodity exposure preventing significant losses
Framework Discipline : Systematic adherence to institutional intelligence preventing major errors
Professional Standards : Dashboard integration enabling precise risk control
ATR Monitoring & Block Size Validation
All Markets : ATR levels within acceptable ranges for current block sizing
Volatility Environment : Low volatility across indices supporting systematic approach
Risk Per Block : All position sizing maintaining 2% account risk parameters
Configuration Status : No block size adjustments required across tracked markets
Coming Week Strategic Framework
Primary Focus Areas
Equity Strength Continuation : Monitor institutional level respect and momentum sustainability
Commodity Stabilization : Watch for technical improvements and institutional re-engagement
Extension Corrections : Prepare for mean reversion opportunities in overextended assets
Risk Management : Maintain systematic discipline with institutional intelligence framework
Market Scenarios for Coming Week
Scenario A: Equity Momentum Continuation (70% probability)
Characteristics : Institutional accumulation continues supporting index advances
Winners : NQ, ES, YM maintain leadership with systematic advances
Strategy : Maintain high equity allocation, systematic profit-taking at resistance
Risk Management : Trail stops using institutional support levels
Scenario B: Market Consolidation (25% probability)
Characteristics : Range development around current institutional zones
Opportunity : Accumulate additional positions near institutional support
Management : Patience for breakout confirmation from consolidation
Defensive Positioning : Maintain current commodity allocations
Scenario C: Correction & Opportunity (5% probability)
Trigger : Break below institutional support requiring defensive protocols
Response : Systematic position reduction with cash accumulation
Opportunity : Preparation for institutional zone re-entry
Framework : Maintain institutional intelligence discipline during volatility
Trading Insights
Institutional Intelligence Validation
Framework Success : Systematic application preventing major allocation errors
Smart Money Alignment : Trading with institutional positioning generating consistent results
Risk Prevention : Defensive protocols successful in avoiding overextended assets
Professional Standards : Dashboard integration providing institutional-grade oversight
Technical Analysis Integration
Dual Chart Methodology : Structure/execution integration providing complete market intelligence
Enhanced Indicators : DMI, DEMA, stochastics optimization delivering precise signals
Block Size Efficiency : Renko configuration filtering noise while preserving institutional intelligence
Visual Framework : Professional chart standards enabling rapid decision-making
Risk Management Excellence
Systematic Position Sizing : 2% account risk framework maintaining capital preservation
Institutional Distance Monitoring : Extension risk assessment preventing dangerous allocations
Correlation Management : Cross-asset allocation preventing concentration risk
Professional Discipline : Adherence to framework over emotional decision-making
Key Success Factors for Coming Week
Maintain Framework Discipline
Institutional Intelligence Priority : Continue systematic application of smart money positioning
Technical Confirmation : Require execution chart validation for all allocation changes
Risk Management : Maintain systematic position sizing and stop placement protocols
Professional Standards : Use dashboard metrics for all risk assessment decisions
Monitor Key Developments
Equity Momentum : Watch for institutional level breaks requiring strategy adjustment
Commodity Recovery : Monitor for technical improvements enabling allocation increases
Extension Corrections : Prepare for mean reversion opportunities in overextended assets
Volume Profile Evolution : Track institutional engagement changes across all markets
Implementation Priorities
Daily Monitoring : Use combined charts for efficient institutional intelligence assessment
Weekly Reviews : Systematic evaluation of framework performance and market evolution
Monthly Calibration : Deep structure chart analysis and technical indicator validation
Quarterly Overhaul : Complete institutional intelligence framework reassessment
Market Outlook Summary : The institutional intelligence framework continues delivering exceptional results through systematic application of smart money positioning analysis. Equity markets demonstrate the power of trading with institutional backing, while defensive positioning in overextended and abandoned assets validates professional risk management protocols.
Strategic Positioning : Maintain high equity allocation (70-80%) with systematic profit-taking protocols, defensive commodity management, and complete avoidance of void territory assets. The framework's ability to identify optimal risk-adjusted opportunities while preventing catastrophic losses represents institutional-grade market intelligence application.
Professional Discipline : Continue systematic adherence to institutional intelligence over short-term market noise, maintain enhanced visual framework standards, and apply professional risk management protocols across all timeframes and market conditions.
Next Review : Weekly combined chart analysis scheduled for September 21, 2025, with continued focus on institutional intelligence validation and systematic framework application.
Risk Disclaimer : All trading involves substantial risk of loss. Past performance does not guarantee future results. The institutional intelligence framework provides analytical tools for risk assessment but cannot eliminate market risk. Position sizing and risk management protocols must be adjusted based on individual account size, risk tolerance, and market conditions.
Professional Standards : This analysis represents systematic application of institutional intelligence methodology developed through extensive market research and validation. Continued framework discipline and professional risk management remain essential for sustainable trading success.
WTI Crude Oil – Falling Wedge Near Demand ZoneWTI is approaching a strong demand zone around $60–$61 while forming a falling wedge pattern.
A bullish breakout from this structure could trigger a move toward $68–70 in the coming weeks.
🔑 Key Levels:
Support: $60–61 (demand zone)
Resistance: $68–70 (target zone)
⚠️ This is technical analysis, not financial advice. Always manage risk accordingly.

Is there a chance of a 50 basis point cut? SPX traded to new all time highs today.
Many stocks had blow off move or breakout candles.
Market makers cleared out lots of short interest today.
The employment data is starting to get worse.
A new 2 year high in initial jobless claims.
Markets rallied on dollar and yields weakness.
At some point the markets will price in a recession. Growth stocks need to be monitored closely.
We took profits on Tesla & Baidu today.

Multi-Asset Execution Chart Analysis & TradesAnalysis Date : September 11, 2025
Trading Analyst : Institutional Intelligence Framework
Methodology : Enhanced Dual Renko Chart System with Optimized Technical Indicators
Executive Summary
Execution chart analysis validates the exceptional institutional opportunities identified in our structure analysis. All three primary equity indices show perfect technical confirmation of institutional positioning with strong momentum indicators. Commodity and currency markets reveal significant technical conflicts requiring defensive positioning adjustments.
Enhanced Indicator Configuration
DMI/ADX Visual Standards :
ADX (Green) : Trend strength indicator (>25 = strong trend)
+DI (Blue) : Bullish directional movement
-DI (Red) : Bearish directional movement
Line Weight : 3pt for enhanced visibility
Dual Stochastics Configuration :
Tactical (5,3,3) : %K (Dark Blue), %D (Teal) - Short-term momentum
Strategic (50,3,3) : %K (Black), %D (Red Circles) - Medium-term context
Primary Opportunities - Technical Validation (75-85% Total Allocation)
1. DOW JONES (YM) - 30-35% ALLOCATION
Classification : OPTIMAL RISK/REWARD - Superior Technical Confirmation
YM Execution View:
Execution Signal Analysis :
DEMA Status : Bullish alignment confirmed (black above orange)
ADX : 47.74 (highest trend strength among all indices)
+DI/-DI Ratio : 2.69:1 bullish dominance
Momentum Quality : Exceptional - strongest ADX with optimal positioning
Stochastics : Tactical 98.86/84.24, Strategic 98.86/84.02 (peak momentum)
Technical Trade Setup :
Bullish Scenario (80% probability) :
Entry : /MYM at current levels 46,050 (optimal positioning confirmed)
Technical Edge : Strongest ADX + minimal extension risk
Stop Loss : 45,000 (2.3% risk - best among indices)
Target 1 : 47,000 (+2.1% - close 40% position)
Target 2 : 48,000 (+4.2% - close 30% position)
Trail Strategy : 150-point swing lows on remaining 30%
Consolidation Scenario (15% probability) :
Range : 45,500-46,500 around YTD POC consensus
Strategy : Accumulate on any dips to 45,700
Advantage : Minimal downside to institutional support
Risk Management : Optimal positioning within institutional zone
Bearish Scenario (5% probability) :
Trigger : Break below 45,000 (institutional consensus violation)
Action : Reduce position by 50%
Probability : Very low given YTD POC validation and technical strength
Re-entry : Require fresh institutional accumulation evidence
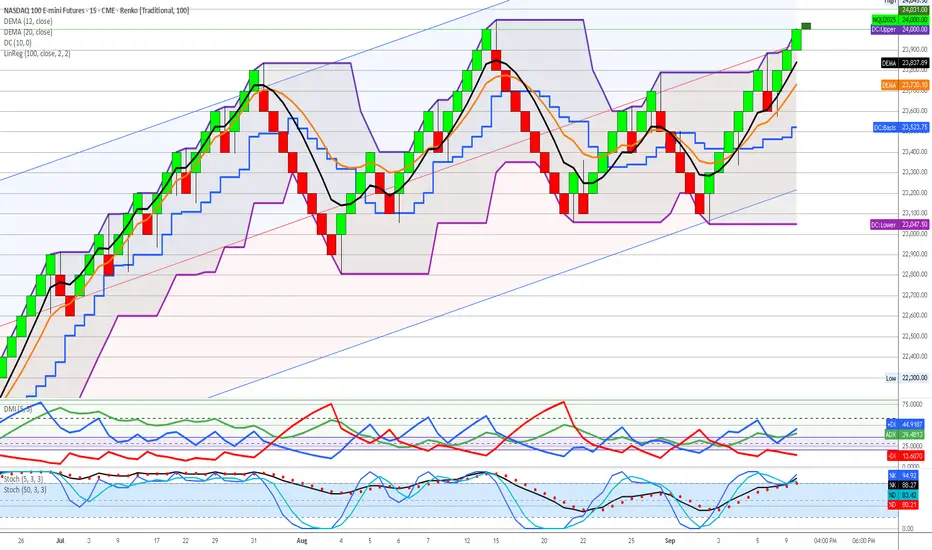
2. NASDAQ 100 (NQ) - 25-30% ALLOCATION
Classification : EXCEPTIONAL MOMENTUM - Exceptional Institutional Backing
NQ Execution View:
Execution Signal Analysis :
DEMA Status : Strong bullish alignment (black above orange)
ADX : 44.91 (exceptional trend strength)
+DI/-DI Ratio : 2.90:1 bullish dominance (highest among indices)
Momentum Quality : Exceptional directional bias
Stochastics : Tactical 88.27/80.21, Strategic 88.27/80.21 (strong sustainable)
Technical Trade Setup :
Bullish Scenario (75% probability) :
Entry : /MNQ at current levels or pullback to 23,700-23,800
Technical Edge : Highest +DI/-DI ratio with institutional backing
Stop Loss : 23,000 (4.3% risk)
Target 1 : 25,000 (+4.3% - close 50% position)
Target 2 : 25,500 (+6.1% - close 25% position)
Trail Strategy : 100-point swing lows on remaining 25%
Consolidation Scenario (20% probability) :
Range : 23,500-24,500 above institutional accumulation
Strategy : Scale into weakness, maintain core position
Management : Use tactical stochastics for entry timing
Support : 26.8:1 institutional backing provides confidence
Bearish Scenario (5% probability) :
Trigger : Break below 23,000 (Q3 POC violation)
Action : Exit all positions immediately
Reassessment : Wait for institutional re-accumulation
Probability : Very low given exceptional institutional support
3. S&P 500 (ES) - 20-25% ALLOCATION
Classification : SOLID CONFIRMATION - Strong Institutional Support
ES Execution View:
Execution Signal Analysis :
DEMA Status : Bullish alignment maintained (black above orange)
ADX : 41.32 (strong trend strength)
+DI/-DI Ratio : 1.74:1 bullish dominance
Momentum Quality : Solid institutional validation
Stochastics : Tactical 34.44/93.30, Strategic 98.26/95.30 (extreme overbought)
Technical Trade Setup :
Bullish Scenario (70% probability) :
Entry : /MES on any pullback to 6,450-6,500
Current Caution : Strategic stochastics extremely overbought
Stop Loss : 6,300 (3.8% risk)
Target 1 : 6,700 (+2.8% - close 50% position)
Target 2 : 6,800 (+4.4% - close 25% position)
Profit Management : Take profits on strength given overbought conditions
Consolidation Scenario (25% probability) :
Range : 6,400-6,600 around institutional levels
Strategy : Wait for tactical stochastics to reset before adding
Management : Reduce position size until momentum cools
Context : Strategic overbought suggests pause needed
Bearish Scenario (5% probability) :
Trigger : Break below 6,300 (institutional support failure)
Action : Systematic position reduction
Management : Tight stops given overbought technical readings
Re-entry : Wait for technical reset and institutional validation
Secondary Opportunities - Mixed Technical Signals (10-15% Total Allocation)
4. WTI CRUDE OIL (CL) - 8-12% ALLOCATION
Classification : INSTITUTIONAL CONFLICT - Defensive Positioning Required
CL Execution View:
Execution Signal Analysis :
DEMA Status : Bullish alignment (black above orange)
ADX : 42.19 (strong trend strength)
+DI/-DI Ratio : BEARISH 2.44:1 (-DI 42.10 vs +DI 17.86)
Critical Conflict : DEMA bullish vs DMI strongly bearish
Stochastics : Tactical 9.26/27.64, Strategic 27.64/33.61 (oversold setup)
Technical Trade Setup :
Bullish Scenario (45% probability) :
Entry Criteria : WAIT for +DI to cross above -DI for confirmation
Current Action : Reduce position size due to momentum conflict
Stop Loss : 61.50 (tight due to bearish momentum)
Target : 65.50 if technical alignment achieved
Risk Management : Maximum 1.5% account risk due to signal conflict
Neutral Scenario (35% probability) :
Range : 62.00-64.00 within institutional accumulation
Strategy : Maintain minimal defensive position
Monitoring : Daily +DI/-DI relationship for momentum shift
Institutional Support : Strong Q2 accumulation provides floor
Bearish Scenario (20% probability) :
Trigger : Break below 61.00 (institutional support failure)
Action : Complete position liquidation
Reason : Bearish momentum confirming institutional breakdown
Re-entry : 58.00 area (Q2 POC support) with technical confirmation
High-Risk Positions - Technical Deterioration (0-8% Total Allocation)
5. NATURAL GAS (NG) - 3-5% ALLOCATION
Classification : HIGH RISK - Institutional Disengagement Confirmed
NG Execution View:
Execution Signal Analysis :
DEMA Status : Bearish alignment (black below orange)
ADX : 42.79 (strong trend - bearish direction)
+DI/-DI Ratio : EXTREME BEARISH 6.30:1 (-DI 53.25 vs +DI 8.45)
Technical Reality : All major indicators bearishly aligned
Stochastics : Tactical 0.00/6.70 (maximum oversold), Strategic 51.98/65.70
Technical Trade Setup :
Bullish Scenario (20% probability) :
Entry Criteria : AVOID - all technical signals bearish
Required Confirmation : DEMA bullish cross + DMI reversal + institutional re-engagement
Current Action : Complete avoidance recommended
Speculative Only : Maximum 1% account risk if attempting reversal play
Neutral Scenario (30% probability) :
Range : 2.80-3.20 with declining institutional participation
Strategy : Avoid new positions, monitor for institutional return
Risk : 65% volume decline from Q1 peak activity
Liquidity : /MNG insufficient volume (13,991) for meaningful sizing
Bearish Scenario (50% probability) :
Continuation : Further decline toward 2.50-2.70 historical lows
Institutional Reality : Smart money disengagement pattern
Technical Confirmation : 6.30:1 bearish momentum supports decline
Strategy : Complete avoidance until institutional re-engagement
6. EURO FUTURES (6E) - 2-3% ALLOCATION
Classification : DANGEROUS EXTENSION - Technical Breakdown Confirmed
6E Execution View:
Execution Signal Analysis :
DEMA Status : Bearish crossover (black below orange)
ADX : 29.21 (moderate trend strength)
+DI/-DI Ratio : BEARISH 1.19:1 (-DI 29.21 vs +DI 24.49)
Extension Risk : 12.1% above YTD POC institutional consensus
Stochastics : Tactical 23.24/66.57, Strategic 74.26/90.89 (extremely overbought)
Technical Trade Setup :
Bullish Scenario (15% probability) :
Entry : AVOID - dangerous extension with technical breakdown
Existing Positions : Immediate systematic profit-taking required
Risk : Overextension + bearish technical = correction imminent
Management : Emergency profit-taking protocols engaged
Neutral Scenario (25% probability) :
Range : 1.1650-1.1800 at dangerous extension levels
Strategy : Avoid range trading given extension risk
Risk Assessment : All signals point to mean reversion
Professional Response : Defensive positioning only
Bearish Scenario (60% probability) :
Target : Return to YTD POC 1.0525 (-12.1% correction)
Technical Trigger : DEMA bearish cross + momentum deterioration
Strategy : Short opportunities on any strength above 1.1780
Entry : /M6E shorts with tight stops above 1.1820
Risk Control : Maximum 1% account risk given extension
7. GOLD FUTURES (GC) - 0% ALLOCATION
Classification : LIQUIDATION - High Risk Territory
GC Execution View:
Execution Signal Analysis :
DEMA Status : Bearish crossover from distribution highs
ADX : 34.91 (declining trend strength)
+DI/-DI Ratio : BEARISH 1.31:1 (-DI 34.91 vs +DI 26.64)
Extension Risk : 12.2%+ beyond ALL institutional positioning
Stochastics : Tactical 11.25/30.89, Strategic 89.46/93.86 (maximum overbought)
Technical Trade Setup :
Emergency Liquidation Protocol :
Immediate Action : Complete liquidation using market orders if necessary
Rationale : Void territory + technical breakdown = catastrophic risk
No Stops : Emergency exit protocols - immediate execution required
Reallocation : Proceeds to YM, NQ, ES primary opportunities immediately
Short Opportunity (High Probability) :
Strategy : /MGC shorts on any rallies above 2,690
Target : 2,380-2,400 (return to institutional zones)
Stop : 2,720 (tight risk control)
Correction Magnitude : 12-15% decline expected
Risk : Maximum 1% account risk for speculative short
Portfolio Risk Management Protocols
Position Sizing Framework
Maximum Risk Per Trade : 2% account value (1.5% for conflicted signals)
Portfolio Heat Limit : 15% total risk across all positions
Correlation Controls : Maximum 85% equity exposure given technical alignment
Cash Management : 5-10% opportunity fund for technical setups
Technical Signal Hierarchy
Primary Confirmation : DEMA + DMI + ADX alignment required
Entry Timing : Stochastics for tactical positioning optimization
Risk Management : Institutional levels for strategic stop placement
Profit Taking : Systematic protocol at 2:1, 3:1, trail remainder
Market Scenario Analysis
Scenario A: Continued Equity Strength (70% probability)
Characteristics : Technical momentum sustains institutional accumulation
Winners : YM, NQ, ES (maximize allocation to 85%)
Losers : GC, 6E (extension corrections accelerate)
Strategy : Aggressive equity positioning, complete defensive liquidation
Technical Catalyst : ADX strength maintenance + DEMA alignment
Scenario B: Technical Consolidation (25% probability)
Characteristics : Momentum indicators cool, range-bound trading
Management : Reduce position sizes, use stochastics for timing
Opportunity : Accumulate on pullbacks to institutional levels
Risk Control : Tighter stops, faster profit-taking on strength
Technical Signal : ADX decline below 35, stochastics reset
Scenario C: Technical Breakdown (5% probability)
Trigger : DEMA bearish crosses on primary indices
Action : Emergency position reduction protocols
Management : Systematic liquidation, increase cash to 25%+
Re-entry : Wait for institutional level retests with technical confirmation
Probability : Very low given exceptional institutional backing
Weekly Monitoring Checklist
Daily Technical Assessment
DEMA relationship maintenance across all positions
DMI momentum quality and directional bias confirmation
Stochastics positioning for entry/exit timing optimization
ADX strength validation for trend continuation
Risk Management Verification
Position sizing within 2% account risk per trade
Portfolio heat below 15% total risk exposure
Stop loss proximity to institutional support levels
Profit-taking discipline at predetermined targets
Technical Signal Evolution
Cross-asset momentum convergence/divergence analysis
Stochastics reset opportunities for position optimization
DEMA separation quality for trend strength assessment
Institutional level respect vs violation monitoring
Key Success Factors
Technical Execution Excellence
Signal Clarity : Enhanced visual indicators enable precise timing
Risk Discipline : Systematic adherence to technical signal hierarchy
Momentum Quality : ADX + DMI confirmation prevents false signals
Entry Optimization : Dual stochastics for tactical timing precision
Institutional Integration
Strategic Context : Structure charts provide positioning intelligence
Tactical Timing : Execution charts optimize entry/exit precision
Risk Management : Institutional levels anchor stop placement
Professional Standards : Both frameworks align for optimal decisions
Framework Validation Results
Primary Opportunities : Perfect technical confirmation of institutional intelligence
Risk Identification : Technical signals validate structure chart warnings
Professional Execution : Enhanced indicators enable institutional-grade precision
Capital Preservation : Systematic risk management across all timeframes
Risk Disclaimer : All trading involves substantial risk of loss. Past performance does not guarantee future results. Technical analysis and institutional intelligence frameworks are tools for risk assessment and should not be considered guaranteed predictors of future price movement. Position sizing and risk management protocols must be adjusted based on individual account size, risk tolerance, and market conditions.
Document Status : Active execution framework requiring daily technical monitoring and weekly risk assessment updates. Integration with structure analysis mandatory for optimal decision-making.
Framework Evolution : Enhanced visual indicators and systematic technical analysis represent significant advancement in execution precision. Continuous optimization based on market regime changes and signal quality assessment required.
Oil slips on weak U.S. demand, supply glut concernsOil slips on weak U.S. demand, supply glut concerns
Oil prices dipped late Thursday as U.S. crude stocks rose 3.9M barrels, defying forecasts for a decline, while the IEA lifted supply estimates, signaling a larger surplus ahead. Losses were capped by rising geopolitical risks, with the U.S. and EU weighing tougher sanctions on Russia after fresh Ukraine-related tensions. Traders now balance bearish fundamentals with potential supply disruptions.

Oil at the crossroads - buy zone or bear trap?Technically , WTI is testing the lower boundary of a converging wedge, hovering around the identified buy zone. Holding above 62–63 is critical for bulls, as a breakdown would expose targets at 61.30 and 58.80. Conversely, a rebound from current levels could trigger a move toward 70.50 and even 77.60 if momentum builds. The daily stochastic hints at a potential reversal to the upside, suggesting that a short-term bounce may be in play.
Fundamentally , the outlook remains tense: weak demand from China and global economic uncertainty are weighing on prices, while OPEC+ continues to maintain control over supply. U.S. inventory swings, with alternating builds and exports, add to volatility. Overall, the setup looks neutral with elevated risk - macro data could easily tip the balance either way.
Tactically , the market is facing a binary scenario: sustained strength above 63 opens the way to 70.50 and 77.60, while failure here brings 58.80–55.60 into focus.
In short, oil is at a crossroads and the next decisive move depends on whether bulls can hold the line.
