TGKA 1H Swing Conservative Trend TradeConservative Trend Trade
+ long impulse
+ expanding T2 level
+ support level
+ 1/2 correction
+ biggest volume Sp
Calculated affordable virtual stop loss
1 to 2 R/R take profit
Day Trend
"+ long impulse
+ T2 level
+ biggest volume 2Sp-
+ support level
+ 1/2 correction"
Monthly Trend
"+ long impulse
- below 1/2 correction
+ expanding T2 level
+ support level"
No context on Year
Wyckoff

Wyckoff Accumilation Live ExampleRichard Wyckoff has a theory regardign the markets phases, and this video exlaborates the accumilation with a live example from the main Swiss index SUI20
Best of Luch
MarketsTitan

Us30 longU30 forms a spring on the 4hr.
The general market is bullish on the daily, so underlying conditions are on our side, I can't stress enough the value of that,
So far, setup looks A+

MNHLDG TO CONTINUE MARK UPMy previous, last entry for MNHLDG got knocked out
*pls refer to the link
This is my new position for MNHLDG
In view of Local Spring Formation, along with Schematic #2 of SpringBoard (purple colored circle)
- i initiated the 1st position @ 22/8/25 (RM 1.51)
I added another position @ 25/8/25 (RM 1.56) in view of, probable successful test of The Local Spring
Nothing difficult here, straight to the points . Obvious setup.
Tight SL
PureWcykoff
EURUSD Long idea ( High Probability )Price has broken finished the pullback movement and make a bullish BOS in 15m TF, Which aligns with higher time frames and with fundamentals too, I consider this setup as a high probability.
I think we will have a strong and fast move toward the TP.
Good luck...

GBP/USD – VSA Signals Supply Emerging at 4H Resistance💡 Idea:
GBP/USD recently tested the 1.37–1.3750 resistance zone and showed clear supply signals in VSA terms. The price is rolling over with wide down-bars on increasing volume, confirming professional selling pressure. The pair is likely entering a markdown phase toward deeper 4H support levels.
📍 Trade Setup
Entry: 1.3470–1.3500 (pullback into broken support / minor supply test)
Stop Loss: 1.3575 (above last supply zone)
Target 1: 1.3340 (next 4H support)
Target 2: 1.3180 (major 4H support base)
R:R Ratio: ~1:3
📊 VSA & Technical Reasoning
Supply Bar at Resistance
At 1.37+, wide spread down-bars closed near the lows on ultra-high volume → classical VSA supply bar, confirming professional selling.
Upthrust / Trap Move
The wick above resistance acted as an Upthrust, luring breakout buyers before reversing sharply — a typical Wyckoff distribution signature.
No Demand Rally
Recent small up-bars into resistance came with narrow spread + low volume, showing lack of demand and confirming sellers are in control.
Lower Highs + Breakdown
Market structure has shifted into a downtrend sequence (lower highs & lower lows) aligning with VSA weakness.
Volume Confirmation
Volume on down-bars remains elevated vs. up-bars, validating that supply > demand. This suggests further downside continuation.
📌 Trading Plan
Look to short retracements into 1.3470–1.3500.
Expect price to break 1.34 support on increased supply.
Trail stop aggressively once 1.3340 is tested, targeting 1.3180 as the larger markdown objective.

COL Bullish Blueprint: $20 or $18.93 — Which Launchpad Wins?Coles is setting up for a sustained move higher. The structure is clean, and two key scenarios are worth tracking:
Scenario 1:
Shallow Pullback to ~$20
LVN Zone: Low Volume Node suggests weak price acceptance — price may dip but not stay.
Fib Confluence:
50% retracement from the recent 1-month 2-bar swing low aligns with this zone.
Yearly R1 Pivot:
Adds structural weight to the $20 area.
Expectation: Quick dip, then bounce — ideal for aggressive entries with tight invalidation.
Scenario 2:
Deeper Pullback to ~$18.93 (Preferred)
Major Support Cluster: Previous swing tops now act as support.
Macro Fib Level: 50% retracement from ATH to the March 14.81 low lands here.
Wick Memory: March’s long wick suggests liquidity and buyer defense — midpoint could act as a springboard.
Expectation: Stronger base, better risk-reward, and potential for a more explosive leg higher.
Invalidation: if we have a monthly close below $18.31 then the chances was this breakout was a false move.
please note, no time analysis done arrows show pathing

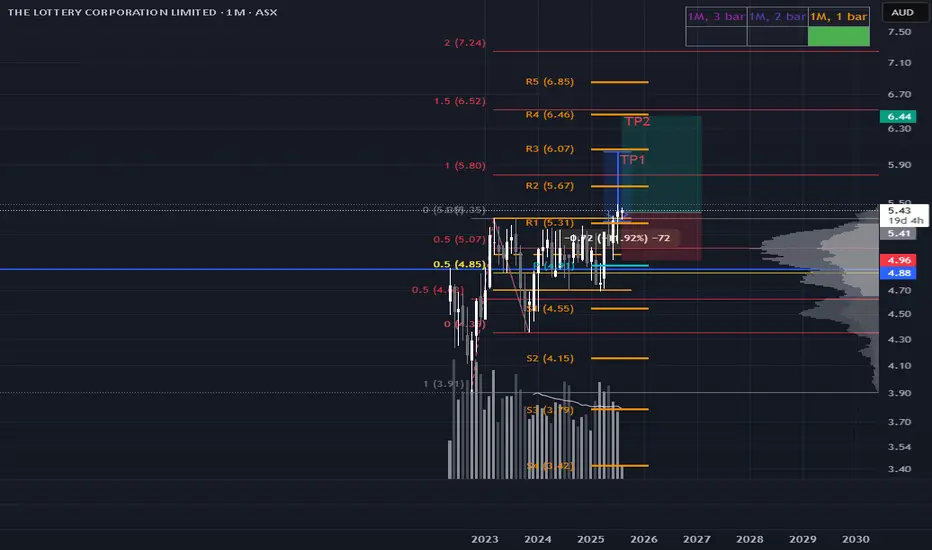
Won the Lottery with This One: TLC’s Breakout BeginsReally liking the structure on TLC. This one's a masterclass in “less is more.” Price has been quietly reaccumulating for roughly 2.5 years, and we’ve finally seen a clean breakout.
Initial Take-Profit:
A quick TP at ~$6.04 aligns with the full range height projection.
Upside Potential: Given the duration of the base, this breakout likely has legs well beyond the initial target.
Risk Management: Trail stop-loss beneath swing lows to stay adaptive while protecting gains.
This setup screams strength through simplicity. If volume continues to expand on up days, we could be entering a powerful markup phase.
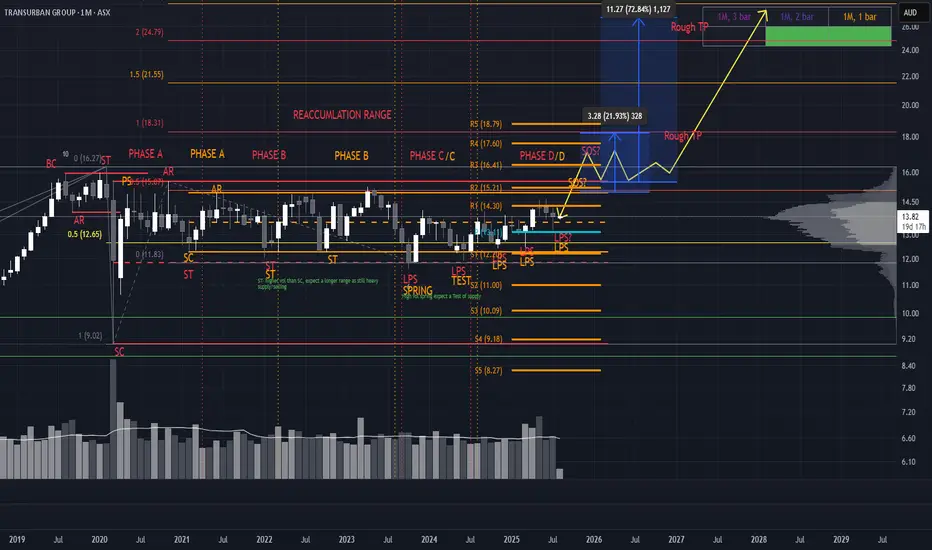
Two Ranges, One Breakout: TCL’s Wyckoff-Gann ConfluenceCurrently tracking two distinct Wyckoff ranges on TCL, each color-coded for clarity. The structure is clean despite a few lines—each range tells a story.
Accumulation Zones
Key buying opportunities are emerging at the LPS (Last Point of Support), marked by higher lows. These are classic signs of strength and absorption.
Resistance & Breakout Potential
Expect notable resistance around $15.55, but a breakout is likely. We’re approaching a Gann 4th-time breakout setup, which historically carries strong momentum. If price reaches this zone with expanding volume and wide candle spreads, it adds conviction for a Sign of Strength (SOS) and a potential pullback to retest.
Targets & Confluence For take-profit zones, I’m watching:
Yearly pivots
Range extensions from both Wyckoff structures (100%, 150%, 200%)
Gann extensions for harmonic targets
This setup blends structure, volume dynamics, and time-price symmetry. If the breakout confirms, TCL could offer a textbook Phase E markup.
*please note no time analysis is done, just looking at pathing
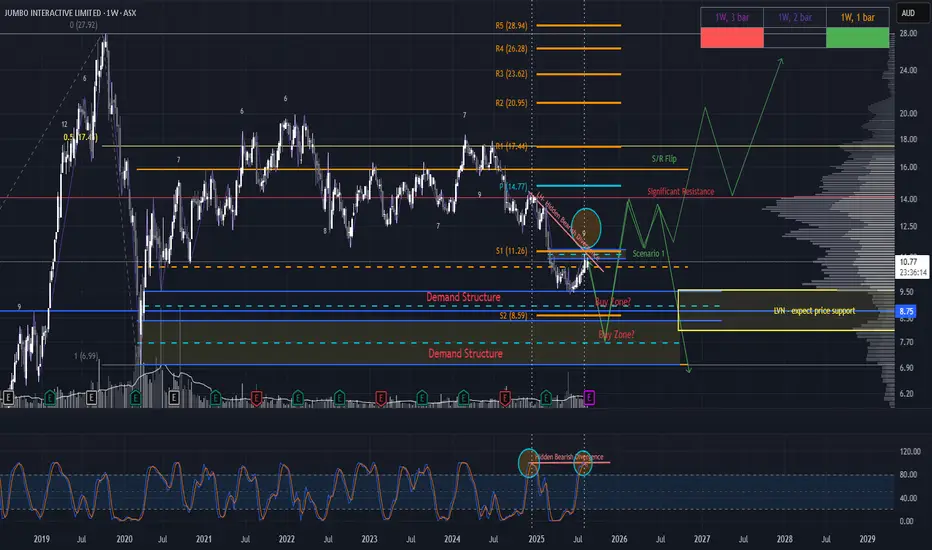
JIN Rallies into the Trap: Retail Shakeout or Reload?Jumbo Interactive (JIN) – Pre-Earnings Setup
JIN is primed for a classic retail shakeout, with the 26 August earnings release likely acting as a volatility catalyst. However, price action suggests the reaction could come ahead of the announcement, given the confluence of technical exhaustion signals.
Price Structure: Price has rallied for 9 consecutive bars, aligning with Gann’s reversal zone (7–10 bar swing rule). This rally is occurring on declining volume, into:
The yearly S1 pivot
A weekly fair value gap (FVG)
Hidden bearish divergence on the Stochastic RSI
Scenario Outlook: Expect a sharp reaction post-earnings (or sooner), targeting the Low Volume Node (LVN) or the Equilibrium of the monthly wick.
The ideal entry would be:
A closed daily dragonfly doji or bullish hammer candle in one of these two zones.
On elevated volume, signaling absorption and reversal
Profit Targets:
Initial TP: Macro 50% retracement ~$14 level or range high ~$16
Extended TP: Potential for a larger swing trade, contingent on a clean break above major resistance (S/R flip) with reaccumulation
Please note, arrows are not based on time analysis
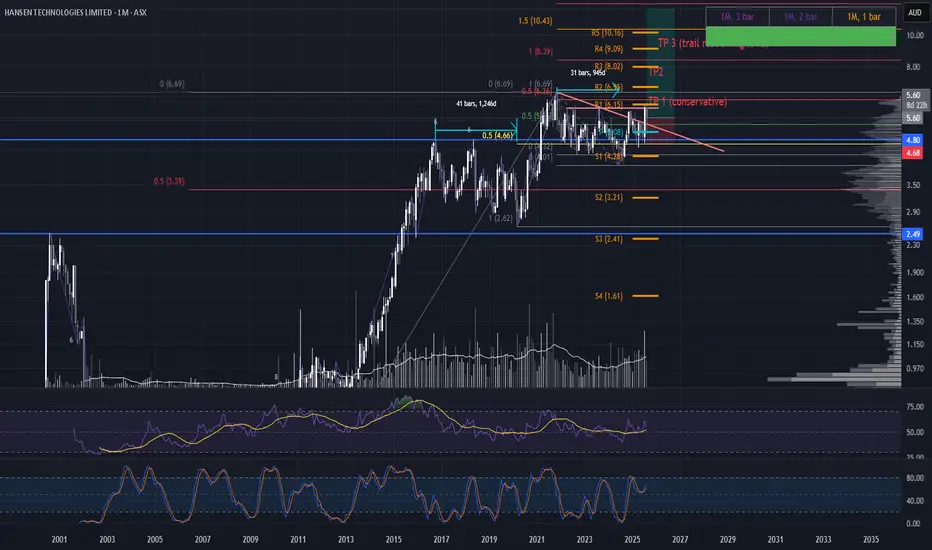
HSN Shakeout Play: Smart Money Reloading for ATH Breakout?Hansen Technologies (HSN) — Strategic Long Setup
Hansen Technologies is shaping up as a compelling long-term play. On 20/08/25, a slight earnings miss (−0.07%) triggered a sharp intraday sell-off, with price spiking down to $5.00 before closing at $5.60, forming a bullish hammer. This candle reflects late retail capitulation into aggressive smart money absorption—a classic shakeout signature.
Confirmation Trigger To validate this as a true shakeout, price must close above the 20/08/25 high of $5.87. A reclaim of this level would likely ignite a strong rally toward all-time highs, as trapped shorts and sidelined longs scramble to reposition.
Monthly Structure — Bullish Reaccumulation
Price has been reaccumulating for ~4 years above the 2016 ATH, building a solid structural base.
The descending trend line has been broken and potentially successfully retested via the 20/08/25 spike low.
Price has also tested the yearly pivot and the 50% Fib level projected from the COVID low to ATH.
This multi-timeframe alignment suggests institutional accumulation and long-term bullish intent.
Trade Scenarios
Aggressive Long Entry: Enter now while price is still consolidating near the spike low. This approach anticipates a breakout and positions early. The stop loss would be placed just below the monthly 2-bar swing low to protect against deeper downside.
Confirmation Long Entry: Wait for price to reclaim and close above $5.87, the high of the 20/08/25 candle. This adds confluence and confirms the shakeout thesis. The stop loss for this setup would sit just below the spike low at approximately $5.00, giving room for volatility while protecting capital.
GAMUDA CONTINUING MARKING UPThis is just a continuation from my previous thesis
**pls refer to the link below
I just want to mention that there is another formation of feather's weight (FW) (**Red line) since the Stepping Stone (SS)
I would be labelling this FW as a form of SS
It would be interesting if today's Bar / Candlestick, able to commit above yesterday's Bar/Candlestick (31/7/25)
-Noticed the huge selling blocks (*Purple Arrow)
EP n SL as attached (Position Intiated @ 31/7/25)
PureWyckoff

SCGBHD CONT MARKING UPThis is a continuation from my previous thesis
A simple , short , trading range, offer low risk entry
I Maintained my previous thesis
Current marking up is a continuation from previous Trading Range (Refer Link)
Position as attached
PureWcykoff

KGB CONTINUE MARKING UPI have been monitoring KGB since my last entry
*Link given
This is a typical Schematic #1 of Re-Accumulation Trading Range
I initiated my position today in the background of Stepping Stone (Red Line)
Based on the influx of buying demand for the past few days, looks like the on going,
Feather's weight & SpringBoard **Purple line, are forming in the theme of Absorption.
Tight risk for this one, im expecting, to get in back, if my current position got knocked out
*(only if low risk entry is formed)

PEKAT CONTINUE MARKING UP
Pekat, Currently in Marking Up Phase, in bigger picture.
**Kindly refer to my previous entry for Pekat
The Black Box, represent a Stepping Stone
**(A term in Wyckoff methode, describing a temporary point where price static 'sideway' before continuing the mark up phase)
In the background of reducing supply (green arrow),
there is on going formation of SpringBoard (purple arc line).
on top of that, formation of local spring , tally accordingly with its own, low supply vol @ 18/8/25 (purple arrow)
im well aware of the incoming QR release tomorrow / few days
With a Trigger Bar today, position initiated as attached
PureWyckoff

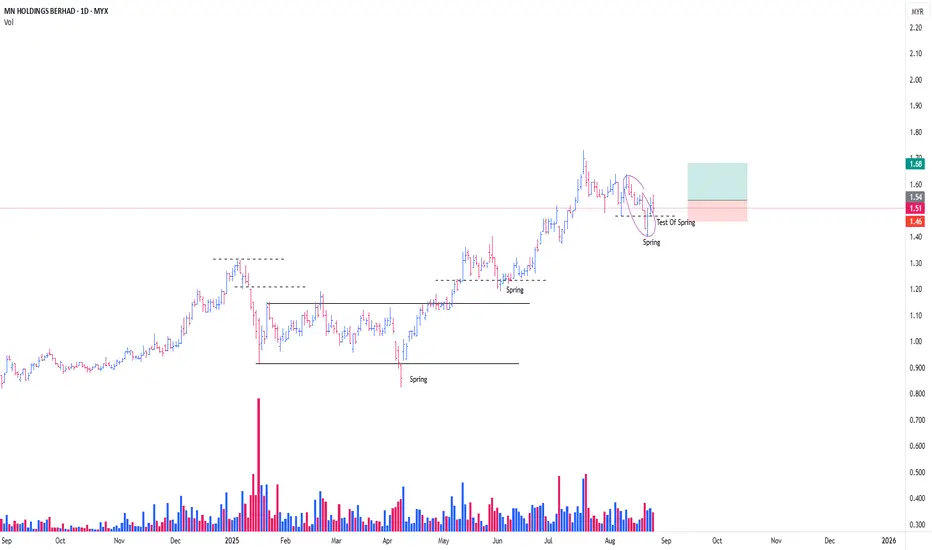
MNHLDG CONTINUE MARKING UPThis is a continuation from my previous entry
**Refer link
Referring to the Red Box, I see it as a Stepping Stone (SS) , a mere temporary stop centre,
before continuing marking up from previous Trading Range (Red Arc Line).
My hypothesis is that, this box are forming a mini Trading Range , in which the formation of local spring , prompted me to initiate position.
The 3 Bars (Or Candlesticks, whatever you prefer), are basically a SpringBoard [/b ] in the form of Absorption.
For Non Wyckoffian, this might be confusing.
Different POV produce different meaning & context/subcontext.
I intiated my position @ 31/7/25, added position today
PureWyckoff

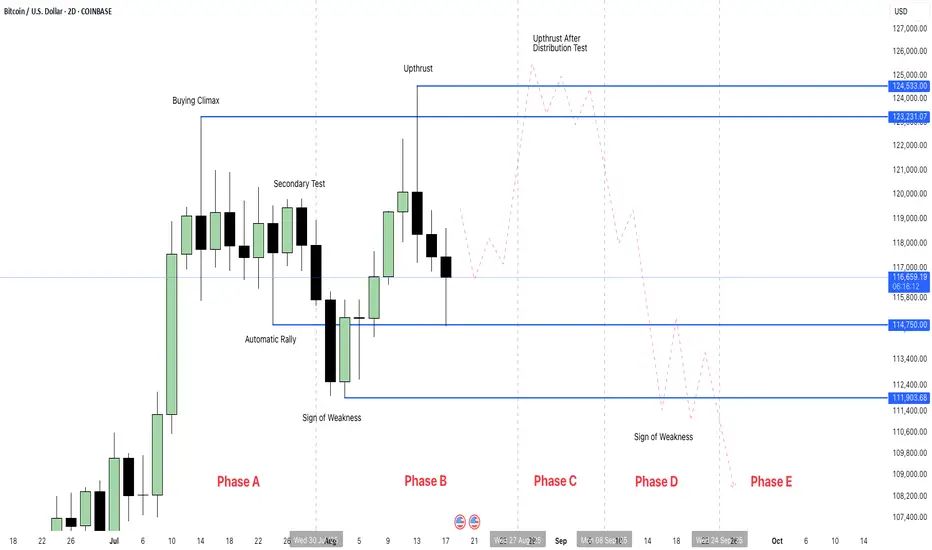
BTC Bitcoin in Distribution Phase BLOW-OFF TOPI believe Bitcoin BTC is in Wyckoff Distribution Phase B heading for Upthrust After Distribution (New ATH) Sweeping $124,500 price.
For me, that would be the BLOW-OFF TOP and the end of this cycles.
For this scenario to play out, after taking liquidity above the current ATH, it needs to start reversing and dropping.
If it closes above the current ATH, then this idea would be invalidated.
There are other factors which would confirm this idea but I am not gonna share it publicly.
Good luck and Happy Trading...
EUR/USD Buy idea to the upside Weekly EURUSD Analysis
My outlook for EU is similar to GU — I’ll be watching for a retracement into demand before looking for buys back to the upside. The key area on my chart is the 9H demand zone, where I’ll be monitoring for signs of accumulation before entering longs.
At the same time, I’ve marked a 6H supply zone sitting at a strong premium level. If the bullish scenario doesn’t play out, this would be an ideal area to catch potential sells to the downside. Either way, I’ll be waiting for price to slow down and confirm at one of my POIs before committing.
Confluences for EU Buys:
- Strong 9H demand zone responsible for the last break of structure.
- Overall bullish structure → pro-trend trade idea.
- DXY analysis aligns with bullish EU outlook.
- Imbalance above + liquidity that still needs to be taken.
P.S. If price breaks below the 9H demand zone, I’ll be eyeing the 5H demand zone just beneath, as it’s more discounted and potentially offers an even cleaner long setup.
Let’s have a strong week ahead!

GBP/USD Buys from 1.35000 back up to 1.36000This week’s focus is on the continuation of the bullish trend, with the main opportunity being a retracement back down into the recent demand zone left behind. From there, I’ll be looking for signs of a Wyckoff distribution to confirm an entry.
If price decides to push higher without retracing, I’ll instead look for a Wyckoff accumulation to form near the 5H supply zone that I’ve marked above current price.
Confluences for GU Buys:
- Recent break of structure to the upside confirms bullish intent.
- DXY has been bearish, supporting a bullish GU outlook.
- A retracement would allow price to re-distribute near the 5H demand zone.
- Clear liquidity above that still needs to be taken.
P.S. If price breaks structure to the downside, it could form a new supply zone — giving earlier sell opportunities. But if nothing confirms, then staying patient and waiting on our hands is also a valid option.

MINIMA - Technical Analysis. Are we entering a bull market?MINIMA - Technical Analysis. Are we entering a bull market?
Hello!
I am returning to an analysis of MINIMA. This market is remarkably interesting in both its structure and behavior. Today, I will review the latest structure and place it in the broader context, including the history observed on the Wrapped version. Unfortunately, TradingView does not allow overlaying two charts outside their native ranges, so I will refer to data from both Wrapped and MINIMA. Let’s begin.
I do not have formal education in this field. I am self-taught and place strong emphasis on Technical Analysis as the core of my decision-making process. While charts are difficult to read, I think they allow one to infer, to a meaningful extent, the hidden intentions of so-called “Smart Money.” The views below are strictly my own and may be incorrect. This publication does not constitute investment or educational advice as defined by any applicable regulations.
I will rely solely on Technical Analysis based on the Wyckoff methodology, VSA, and footprint analysis.
Background
As background, I use the WMINIMA chart supplemented by current MINIMA quotations. WMINIMA data show periods of distribution and accumulation on the higher timeframe. A key observation for me is the strong breakout around March 2024: price surged sharply and then printed a new, deeper low. The downtrend subsequently stalled at a higher low and transitioned into a range. On the charts, I mark accumulation/distribution structures relevant to the analysis.
Technical analysis and interpretation
For this study I created a composite view to capture the full history. The composite lacks full volume because WMINIMA does not provide it. For context, one of my archived screenshots shows the last visible candle at roughly 1.4 million in volume; based on bar height I estimate the highest volumes to be around 6 million.
pbs.twimg.com
I annotate events in line with Wyckoff. In Phase A of accumulation, I label the Selling Climax as “Seller’s Exhaustion,” as in my view the bar structure does not fully match a classic Climax Bar known from VSA; however, the message is the same - significant accumulation.
I first consider the highest-order, global structure marked in red. I observe rising volume on the advance that builds what I mark as an Upthrust. The next area of elevated volume begins around July 2024 - a demand response to declining price within the price zone that preceded the breakout. Both high-activity zones are in comparable price areas.
I then move to the current MINIMA chart.
On MINIMA, I see a local volume spike during the formation of the ATL (all-time low). I also note declining volume on the drop from a local top I labeled an Upthrust - this is a lower-order structure than the red one; I mark it in orange. Following this path leads to the area with the highest volume, which I interpret as Phase C of the orange structure. It is characterized by very high volumes(1W ~50kk to 6kk volume from 1W WMINIMA) and minimal spread. In my view, this indicates strong absorption by smart money - behavior consistent with “Bag Holding” in the Williams/VSA framework - similar to the candle that halted the decline at the ATL.
To validate this, I zoom in with a 1-month footprint. The 1-month view shows the last two candles with very large volumes. The three most recent candles all have negative delta, and delta represents a significant share of total volume. The buy/sell relation suggests aggressive, dominant selling. However, price does not fall despite repeated attempts to push it lower. I analyze where volume clusters within one standard deviation. The candles have lower wicks- particularly in June - suggesting a Shakeout. Given the negative delta and the price response, I conclude there is a lack of result relative to the effort: aggressive supply has been absorbed, with the largest market orders printing within a narrow price band.
In my interpretation, the orange structure is a lower-tier structure functioning as Phase C of the red, global accumulation. Considering the above, I judge it highly probable that these observations confirm ongoing accumulation. I place particular weight on the footprint: the activity occurred at the right place and time. The asset recorded the highest volumes in its history at what I think is Phase C of the global accumulation. Moreover, the market’s failure to decline under heavy selling reinforces this view.
At this stage, I consider the possibility of an accumulation spring that could push price once more lower - potentially below the ATL - taking out the structure; I justify this by the still elevated volumes. I also note prior resistance and consider that a potential shakeout low could terminate around 0.0138 USD. All in all, I think this market is worth monitoring. Confirmation of my thesis would be successful supply tests resolved in favor of the bulls, followed by development consistent with Wyckoff: Last Point of Support (LPS) leading to a Sign of Strength (SOS) and a Jump Across the Creek (JAC).
Thank you for reading. I wish you good health, effective analyses, and successful trades.
CatTheTrader

F 1H Long Swing Conservative Trend TradeConservative Trend Trade
+ long balance
+ support level
+ ICE level
+ 1/2 correction
- biggest volume 2Sp-
+ weak test
- above first bullish bar close entry
Calculated affordable virtual stop loss
1 to 2 R/R above 1D T1 take profit
Daily Trend
"+ long impulse
+ neutral zone"
Monthly Trend
"+ long impulse
+ long volume distribution
+ neutral zone"
Yearly Trend
"+ long impulse
+ volumed T2 level
+ volumed 2Sp+
+ 1/2 correction"

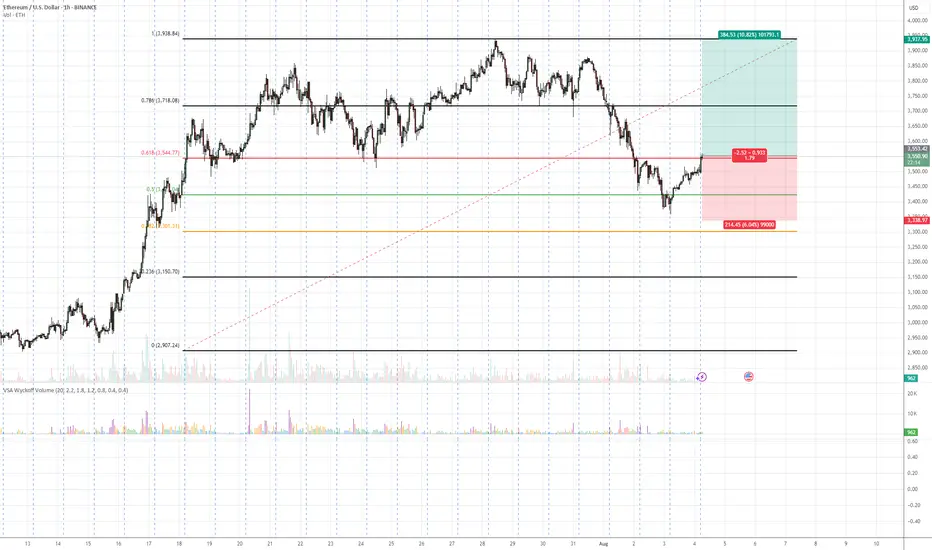
ETH/USDT – Bullish Reversal Potential from Fibonacci Confluence 💡 Idea:
Ethereum is showing signs of demand absorption at a critical Fibonacci support cluster (0.5 – 0.618 retracement). VSA patterns confirm that selling pressure is being absorbed, hinting at a possible markup toward previous swing highs.
📍 Trade Setup:
Entry: Current levels near 3,551
Target: 3,937 (+10.82%)
Stop Loss: 3,338 (below last absorption zone)
R:R Ratio: ~1.79:1
📊 Technical Reasoning (VSA)
1. Stopping Volume at Fibonacci Support
ETH tested the 0.5–0.618 retracement zone from its prior bullish impulse.
Wide spread down-bars on high volume failed to produce significant downside progress, signaling professional buying.
2. No Supply Confirmation
Following the stopping volume, the market printed narrow range candles on decreasing volume, indicating supply exhaustion.
3. Demand Emergence
The recent push above short-term resistance came with increasing volume and wider up-bar spreads, suggesting the start of an accumulation-to-markup transition.
4. Structure & Fibonacci Confluence
Current rally aligns with the Fibonacci golden zone and past structural support.
📌 Trading Plan:
Enter on confirmed breakout above minor resistance with volume expansion.
Scale out partial profits near 3,800 and let remainder ride toward 3,937.
Keep stop below 3,338 to avoid being shaken out by false breakouts.
Simple Psychology Tips Using Volume for Better TradingMany newer traders assume that when someone says "psychology" in trading, they are referring to mindset.
It is also widely believed that trading is about the BEST entries.
Now, think of it this way. It is not about winning trades, it is actually about managing losses well to allow you to take the winners over and over again. You might think that a 3 to 1 risk-to-reward strategy is boring, you might have gone all in on your favourite crypto project. But what makes the difference between gambling and trading is actually very, very simple. So simple, in fact, many overlook it or simply ignore it.
Most seek a silver bullet - high win rates and perfectly timed entries, then they overleverage and move stops on the one "good trade" they are seeking to make.
Whilst doing this, they tend to overload the 6 monitors they have purchased to trade with a thousand indicators, which they don't really need.
The candlesticks tell a story, volume supports that story. When you learn any technique from Elliott Waves to Wyckoff, they all have a dependence on volume - even if the correlation is not apparent.
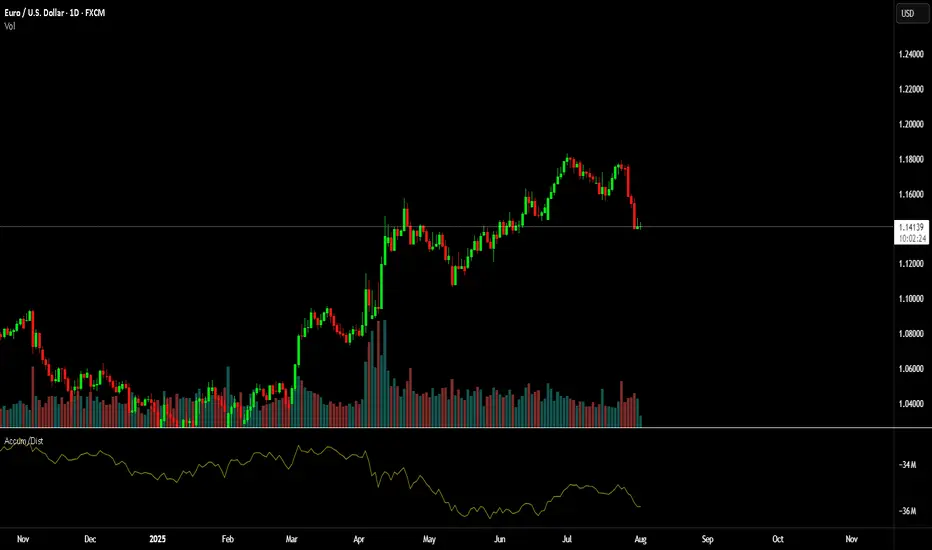
Look at this first image.
Price had moved down since the vertical line, the AD line also moved down - sell-off, in full swing. But then volume starts to shift before the AD line starts to increase.
Now, look at what happens next...
As we move forward and the new vertical line shows where volume spiked, the AD line starts to decrease as the price continues to rise.
This is enough of a story to start your analysis.
We then get a move with a lower high formed.
As this plays out, the sell-side volume rises, creating momentum for the short position.
Look a little closer and you will see, that the volume on the move up just before the drop was also decreasing. Making a divergence to price.
You might feel that the market is against you, or that the big players are single-handedly seeking your stops. But the truth is, the psychology in moves such as this one shown is where most retail traders either have greed that markets will only go up for ever or the fear that they are missing out on a market that only goes up forever.
It is that herd mentality that generates the liquidity for the professionals.
Losing 1% on a trade, is part of the process, risking 80%> on a single move will make you paper rich for about 10 minutes before the real losses set in.
This is where the psychology and the basic techniques such as risk management and understanding what candlesticks and volume bars are telling you, will make a world of difference to your results.
A/D line and volume are free on @TradingView and to be fair you don't need to overcomplicate it more than that!
Stay safe, have a great weekend all!!!
Disclaimer
This idea does not constitute as financial advice. It is for educational purposes only, our principal trader has over 25 years' experience in stocks, ETF's, and Forex. Hence each trade setup might have different hold times, entry or exit conditions, and will vary from the post/idea shared here. You can use the information from this post to make your own trading plan for the instrument discussed. Trading carries a risk; a high percentage of retail traders lose money. Please keep this in mind when entering any trade. Stay safe.