Wyckoffaccumulation

OHMI - One Hundred Million Inu 💯Memecoin Trade $OHMI
🟢 Narrative: One Hundred Million Inu 💯
🟢 Wyckoff Accumulation Schematic
🟢 On Balance Volume above resistance
🚨 Buy at your own risk. Community coin w active members 🚀

How to take sniper entries using wyckoff on LTF for big RRRBy entering on LTF and putting your SL on LTF and your TP on HTF you will get a huge RR ratio of more than 40. Here I am targeting 1.088 on HTF which is the next supply order block and no risk involved right now. ( 5 Min video )

ILMN - Wyckoff AccumulationJust thought I would share that ILMN appears to align with Wyckoff Accumulation patterns as it began to form a complex base from June last year.
The 200 day moving average is now begining to flatten out with the stock making a few attempts to rise above it since this year.
For those with patience, any dips in the coming days will be an opportunity to accumulate. However momentum traders will prefer to see a break above it's horizontal resistence @ 249 to initiate Longs.
You can read more about Wyckoff pattern here.
school.stockcharts.com
Disclaimer: Just my 2 cents and not a trade advice. Kindly do your own due diligence and trade according to your own risk tolerance and don't forget that money management is important! Take care and Good Luck!

📊 Wyckoff SchematicsThe Wyckoff Method involves a five-step approach to stock selection and trade entry, which can be summarized as follows:
Determine the present position and probable future trend of the market. Is the market consolidating or trending? Does your analysis of market structure, supply and demand indicate the direction that is likely in the near future? This assessment should help you decide whether to be in the market at all and, if so, whether to take long or short positions. Use both bar charts and Point and Figure charts of the major market indices for Step 1.
Select stocks in harmony with the trend. In an uptrend, select stocks that are stronger than the market. For instance, look for stocks that demonstrate greater percentage increases than the market during rallies and smaller decreases during reactions. In a downtrend, do the reverse – choose stocks that are weaker than the market. If you are not sure about a specific issue, drop it and move on to the next one. Use bar charts of individual stocks to compare with those of the most relevant market index for Step 2.
Select stocks with a “cause” that equals or exceeds your minimum objective. A critical component of Wyckoff's trade selection and management was his unique method of identifying price targets using Point and Figure (P&F) projections for both long and short trades. In Wyckoff's fundamental law of “Cause and Effect,” the horizontal P&F count within a trading range represents the cause, while the subsequent price movement represents the effect. Therefore, if you are planning to take long positions, choose stocks that are under accumulation or re-accumulation and have built a sufficient cause to satisfy your objective. Step 3 relies on the use of Point and Figure charts of individual stocks.
Determine the stocks' readiness to move. Apply the nine tests for buying or for selling (described below). For instance, in a trading range after a prolonged rally, does the evidence from the nine selling tests suggest that significant supply is entering the market and that a short position may be warranted? Or in an apparent accumulation trading range, do the nine buying tests indicate that supply has been successfully absorbed, as evidenced further by a low-volume spring and an even lower-volume test of that spring? Use bar charts and Point and Figure charts of individual stocks for Step 4.
Time your commitment with a turn in the stock market index. Three-quarters or more of individual issues move in harmony with the general market, so you improve the odds of a successful trade by having the power of the overall market behind it. Specific Wyckoff principles help you anticipate potential market turns, including a change of character of price action (such as the largest down-bar on the highest volume after a long uptrend), as well as manifestations of Wyckoff's three laws (see below). Put your stop-loss in place and then trail it, as appropriate, until you close out the position. Use bar and Point and Figure charts for Step 5.
🔹PS — preliminary support, where substantial buying begins to provide pronounced support after a prolonged down-move. Volume increases and price spread widens, signaling that the down-move may be approaching its end.
🔹SC — selling climax, the point at which widening spread and selling pressure usually climaxes and heavy or panicky selling by the public is being absorbed by larger professional interests at or near a bottom. Often price will close well off the low in a SC, reflecting the buying by these large interests.
🔹AR — automatic rally, which occurs because intense selling pressure has greatly diminished. A wave of buying easily pushes prices up; this is further fueled by short covering. The high of this rally will help define the upper boundary of an accumulation TR.
🔹ST — secondary test, in which price revisits the area of the SC to test the supply/demand balance at these levels. If a bottom is to be confirmed, volume and price spread should be significantly diminished as the market approaches support in the area of the SC. It is common to have multiple STs after a SC.
🔹Test — Large operators always test the market for supply throughout a TR (e.g., STs and springs) and at key points during a price advance. If considerable supply emerges on a test, the market is often not ready to be marked up. A spring is often followed by one or more tests; a successful test (indicating that further price increases will follow) typically makes a higher low on lesser volume.
🔹SOS — sign of strength, a price advance on increasing spread and relatively higher volume. Often a SOS takes place after a spring, validating the analyst’s interpretation of that prior action.
🔹LPS — last point of support, the low point of a reaction or pullback after a SOS. Backing up to an LPS means a pullback to support that was formerly resistance, on diminished spread and volume. On some charts, there may be more than one LPS, despite the ostensibly singular precision of this term.
🔹BU — “back-up”. This term is short-hand for a colorful metaphor coined by Robert Evans, one of the leading teachers of the Wyckoff method from the 1930s to the 1960s. Evans analogized the SOS to a “jump across the creek” of price resistance, and the “back up to the creek” represented both short-term profit-taking and a test for additional supply around the area of resistance. A back-up is a common structural element preceding a more substantial price mark-up, and can take on a variety of forms, including a simple pullback or a new TR at a higher level.
🔹PSY — preliminary supply , where large interests begin to unload shares in quantity after a pronounced up-move. Volume expands and price spread widens, signaling that a change in trend may be approaching.
🔹BC — buying climax, during which there are often marked increases in volume and price spread. The force of buying reaches a climax, with heavy or urgent buying by the public being filled by professional interests at prices near a top. A BC often coincides with a great earnings report or other good news, since the large operators require huge demand from the public to sell their shares without depressing the stock price.
🔹AR — automatic reaction. With intense buying substantially diminished after the BC and heavy supply continuing, an AR takes place. The low of this selloff helps define the lower boundary of the distribution TR.
🔹ST — secondary test, in which price revisits the area of the BC to test the demand/supply balance at these price levels. For a top to be confirmed, supply must outweigh demand; volume and spread should thus decrease as price approaches the resistance area of the BC. An ST may take the form of an upthrust (UT), in which price moves above the resistance represented by the BC and possibly other STs before quickly reversing to close below resistance. After a UT, price often tests the lower boundary of the TR.
🔹SOW — sign of weakness, observable as a down-move to (or slightly past) the lower boundary of the TR, usually occurring on increased spread and volume. The AR and the initial SOW(s) indicate a change of character in the price action of the stock: supply is now dominant.
🔹LPSY — last point of supply. After testing support on a SOW, a feeble rally on narrow spread shows that the market is having considerable difficulty advancing. This inability to rally may be due to weak demand, substantial supply or both. LPSYs represent exhaustion of demand and the last waves of large operators’ distribution before markdown begins in earnest.
🔹UTAD — upthrust after distribution. A UTAD is the distributional counterpart to the spring and terminal shakeout in the accumulation TR. It occurs in the latter stages of the TR and provides a definitive test of new demand after a breakout above TR resistance. Analogous to springs and shakeouts, a UTAD is not a required structural element: the TR in Distribution Schematic #1 contains a UTAD, while the TR in Distribution Schematic #2 does not.
👤 @AlgoBuddy
📅 Daily Ideas about market update, psychology & indicators
❤️ If you appreciate our work, please like, comment and follow ❤️

THESAUCE FX - NAS100 - BUY OR SELL?????I'm more interested in a buy more than a sell but we have to respect the market enough for it to tell us what it wants

TSLA Intraday Wyckoff Accumulation to Distributionas I was trading I had to show this example of accumulation, markup & possible distribution -


BUY TRADE ( Feb 27, 2023) Another mitigation plus invalidation of supply.
Note: Caption inside the charts .
RR: 1:16
ACCUMULATION SChematics entry point with proof before entering,

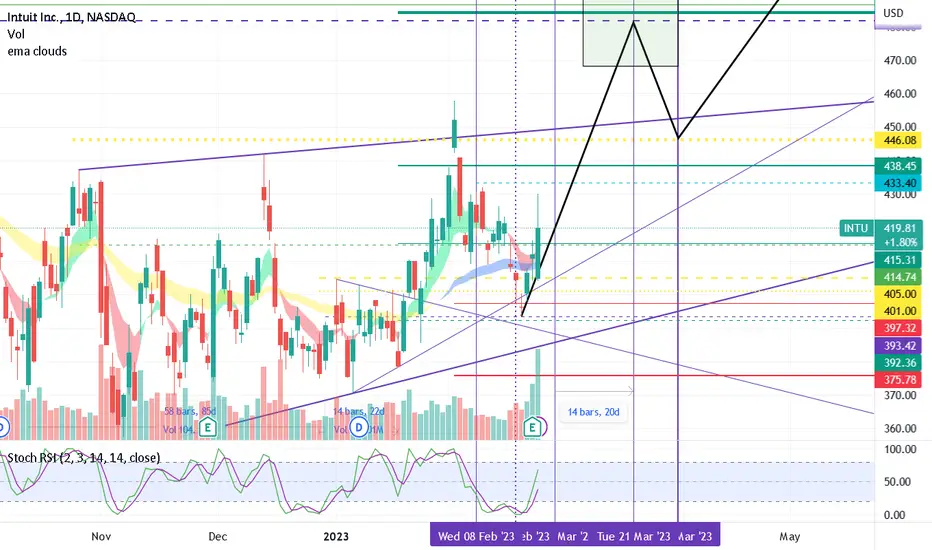
480s by end of MarchINTU saw an SOS after accumulation going into earnings, then the backup retest. On the earnings beat it began its markup and is headed to 480s by end of March.
After 480s it will need to retest 446 for support, if that holds it can continue into the 500s.
After possible fake breakout support GBP/USD can begin move upHello traders, I want share with you my opinion about British Pound. Looking at the graph, we can observe how is formed the accumulation scheme by Wyckoff. We see how the price enters the phase A, creates preliminary support (PS) that indicates that some buyers are showing up, but they are not enough to stop the movement. The selling climax (SC) is formed by intense sales, as the excess supply is absorbed by the buyers, the strong drop quickly turns into a rebound or an automatic rally (AR). Next, we see a secondary test(ST) that is tested in a truly downtrend ended. Further, the price goes into phase B. In fact, phase b is the stage at which a composite person accumulates the largest number of assets. During the phase B, there may be numerous secondary tests and in some cases they can produce higher highs (bull traps) and lower lows (bear traps) with respect to (sk) and (ar) phase A. Currently the price has moved into the phase C. This phase is a typical period of accumulation of assets, also called SPRING. It often acts as the last bear trap before the market begins to form higher lows. The bearish trap is prompting retail investors to give up their assets. Now the price is above the support level 1.1930 and I think the price can make a fake breakout and begin move up. So for the British Pound, I see 2 goals, resistance area (1) 1,2025-1.2045 and resistance area (2) 1.2130-1.2150. Please share this idea with your friends and click Boost🚀

wyckoff Accumulation 1 can apply on any timeframe PS—preliminary support, where substantial buying begins to provide pronounced support after a prolonged down-move. Volume increases and price spread widens, signaling that the down-move may be approaching its end.
SC—selling climax, the point at which widening spread and selling pressure usually climaxes and heavy or panicky selling by the public is being absorbed by larger professional interests at or near a bottom. Often price will close well off the low in a SC, reflecting the buying by these large interests.
AR—automatic rally, which occurs because intense selling pressure has greatly diminished. A wave of buying easily pushes prices up; this is further fueled by short covering. The high of this rally will help define the upper boundary of an accumulation TR.
ST—secondary test, in which price revisits the area of the SC to test the supply/demand balance at these levels. If a bottom is to be confirmed, volume and price spread should be significantly diminished as the market approaches support in the area of the SC. It is common to have multiple STs after a SC.
Note: Springs or shakeouts usually occur late within a TR and allow the stock’s dominant players to make a definitive test of available supply before a markup campaign unfolds. A “spring” takes price below the low of the TR and then reverses to close within the TR; this action allows large interests to mislead the public about the future trend direction and to acquire additional shares at bargain prices. A terminal shakeout at the end of an accumulation TR is like a spring on steroids. Shakeouts may also occur once a price advance has started, with rapid downward movement intended to induce retail traders and investors in long positions to sell their shares to large operators. However, springs and terminal shakeouts are not required elements: Accumulation Schematic 1 depicts a spring, while Accumulation Schematic 2 shows a TR without a spring.
Test—Large operators always test the market for supply throughout a TR (e.g., STs and springs) and at key points during a price advance. If considerable supply emerges on a test, the market is often not ready to be marked up. A spring is often followed by one or more tests; a successful test (indicating that further price increases will follow) typically makes a higher low on lesser volume.
SOS—sign of strength, a price advance on increasing spread and relatively higher volume. Often a SOS takes place after a spring, validating the analyst’s interpretation of that prior action.
LPS—last point of support, the low point of a reaction or pullback after a SOS. Backing up to an LPS means a pullback to support that was formerly resistance, on diminished spread and volume. On some charts, there may be more than one LPS, despite the ostensibly singular precision of this term.
BU—“back-up”. This term is short-hand for a colorful metaphor coined by Robert Evans, one of the leading teachers of the Wyckoff method from the 1930s to the 1960s. Evans analogized the SOS to a “jump across the creek” of price resistance, and the “back up to the creek” represented both short-term profit-taking and a test for additional supply around the area of resistance. A back-up is a common structural element preceding a more substantial price mark-up, and can take on a variety of forms, including a simple pullback or a new TR at a higher level

Here's a throwback to Wyckoff Logic Here's a throwback to Wyckoff Logic.
Recall market phases, when ranging ends (accumulation or distribution)
you jump the creek or break the ice then just like everything in life effect follows cause and you end up with either a mark-up or a mark-down.

FEB 16 2023- BUY TRADEUSDCAD buy trade
entry at 1min OB and wyckoff schematics - feb 16 2023 ---> TP feb 24 2023
-A clear demand to demand scenario because of imbalance.
TP: 1:100 RR

Wyckoff Accumulation Schematics 2Phase A: Phase A marks the stopping of the prior downtrend. Up to this point, supply has been dominant. The approaching diminution of supply is evidenced in preliminary support (PS) and a selling climax (SC). These events are often very obvious on bar charts, where widening spread and heavy volume depict the transfer of huge numbers of shares from the public to large professional interests. Once these intense selling pressures have been relieved, an automatic rally (AR), consisting of both institutional demand for shares as well as short-covering, typically ensues. A successful secondary test (ST) in the area of the SC will show less selling than previously and a narrowing of spread and decreased volume, generally stopping at or above the same price level as the SC. If the ST goes lower than that of the SC, one can anticipate either new lows or prolonged consolidation. The lows of the SC and the ST and the high of the AR set the boundaries of the TR. Horizontal lines may be drawn to help focus attention on market behavior, as seen in the two Accumulation Schematics above.
Sometimes the downtrend may end less dramatically, without climactic price and volume action. In general, however, it is preferable to see the PS, SC, AR and ST, as these provide not only a more distinct charting landscape but a clear indication that large operators have definitively initiated accumulation.
In a re-accumulation TR (which occurs during a longer-term uptrend), the points representing PS, SC and ST are not evident in Phase A. Rather, in such cases, Phase A resembles that more typically seen in distribution (see below). Phases B-E generally have a shorter duration and smaller amplitude than, but are ultimately similar to, those in the primary accumulation base.
Phase B: In Wyckoffian analysis, Phase B serves the function of “building a cause” for a new uptrend (see Wyckoff Law #2 – “Cause and Effect”). In Phase B, institutions and large professional interests are accumulating relatively low-priced inventory in anticipation of the next markup. The process of institutional accumulation may take a long time (sometimes a year or more) and involves purchasing shares at lower prices and checking advances in price with short sales. There are usually multiple STs during Phase B, as well as upthrust-type actions at the upper end of the TR. Overall, the large interests are net buyers of shares as the TR evolves, with the goal of acquiring as much of the remaining floating supply as possible. Institutional buying and selling imparts the characteristic up-and-down price action of the trading range.
Early on in Phase B, the price swings tend to be wide and accompanied by high volume. As the professionals absorb the supply, however, the volume on downswings within the TR tends to diminish. When it appears that supply is likely to have been exhausted, the stock is ready for Phase C.
Phase C: It is in Phase C that the stock price goes through a decisive test of the remaining supply, allowing the “smart money” operators to ascertain whether the stock is ready to be marked up. As noted above, a spring is a price move below the support level of the TR (established in Phases A and B) that quickly reverses and moves back into the TR. It is an example of a bear trap because the drop below support appears to signal resumption of the downtrend. In reality, though, this marks the beginning of a new uptrend, trapping the late sellers (bears). In Wyckoff's method, a successful test of supply represented by a spring (or a shakeout) provides a high-probability trading opportunity. A low-volume spring (or a low-volume test of a shakeout) indicates that the stock is likely to be ready to move up, so this is a good time to initiate at least a partial long position.
The appearance of a SOS shortly after a spring or shakeout validates the analysis. As noted in Accumulation Schematic #2, however, the testing of supply can occur higher up in the TR without a spring or shakeout; when this occurs, the identification of Phase C can be challenging.
Phase D: If we are correct in our analysis, what should follow is the consistent dominance of demand over supply. This is evidenced by a pattern of advances (SOSs) on widening price spreads and increasing volume, as well as reactions (LPSs) on smaller spreads and diminished volumes. During Phase D, the price will move at least to the top of the TR. LPSs in this phase are generally excellent places to initiate or add to profitable long positions.
Phase E: In Phase E, the stock leaves the TR, demand is in full control and the markup is obvious to everyone. Setbacks, such as shakeouts and more typical reactions, are usually short-lived. New, higher-level TRs comprising both profit-taking and acquisition of additional shares (“re-accumulation”) by large operators can occur at any point in Phase E. These TRs are sometimes called “stepping stones” on the way to even higher price targets.

Wyckoff Accumulation Schematics 1PS—preliminary support, where substantial buying begins to provide pronounced support after a prolonged down-move. Volume increases and price spread widens, signaling that the down-move may be approaching its end.
SC—selling climax, the point at which widening spread and selling pressure usually climaxes and heavy or panicky selling by the public is being absorbed by larger professional interests at or near a bottom. Often price will close well off the low in a SC, reflecting the buying by these large interests.
AR—automatic rally, which occurs because intense selling pressure has greatly diminished. A wave of buying easily pushes prices up; this is further fueled by short covering. The high of this rally will help define the upper boundary of an accumulation TR.
ST—secondary test, in which price revisits the area of the SC to test the supply/demand balance at these levels. If a bottom is to be confirmed, volume and price spread should be significantly diminished as the market approaches support in the area of the SC. It is common to have multiple STs after a SC.
Note: Springs or shakeouts usually occur late within a TR and allow the stock’s dominant players to make a definitive test of available supply before a markup campaign unfolds. A “spring” takes price below the low of the TR and then reverses to close within the TR; this action allows large interests to mislead the public about the future trend direction and to acquire additional shares at bargain prices. A terminal shakeout at the end of an accumulation TR is like a spring on steroids. Shakeouts may also occur once a price advance has started, with rapid downward movement intended to induce retail traders and investors in long positions to sell their shares to large operators. However, springs and terminal shakeouts are not required elements: Accumulation Schematic 1 depicts a spring, while Accumulation Schematic 2 shows a TR without a spring.
Test—Large operators always test the market for supply throughout a TR (e.g., STs and springs) and at key points during a price advance. If considerable supply emerges on a test, the market is often not ready to be marked up. A spring is often followed by one or more tests; a successful test (indicating that further price increases will follow) typically makes a higher low on lesser volume.
SOS—sign of strength, a price advance on increasing spread and relatively higher volume. Often a SOS takes place after a spring, validating the analyst’s interpretation of that prior action.
LPS—last point of support, the low point of a reaction or pullback after a SOS. Backing up to an LPS means a pullback to support that was formerly resistance, on diminished spread and volume. On some charts, there may be more than one LPS, despite the ostensibly singular precision of this term.
BU—“back-up”. This term is short-hand for a colorful metaphor coined by Robert Evans, one of the leading teachers of the Wyckoff method from the 1930s to the 1960s. Evans analogized the SOS to a “jump across the creek” of price resistance, and the “back up to the creek” represented both short-term profit-taking and a test for additional supply around the area of resistance. A back-up is a common structural element preceding a more substantial price mark-up, and can take on a variety of forms, including a simple pullback or a new TR at a higher level.

CADCHF Update I It will explode to the upside but be patientWelcome back! Let me know your thoughts in the comments!
**CADCHF Analysis - Listen to video!
We recommend that you keep this pair on your watchlist and enter when the entry criteria of your strategy is met.
Please support this idea with a LIKE and COMMENT if you find it useful and Click "Follow" on our profile if you'd like these trade ideas delivered straight to your email in the future.
Thanks for your continued support!

IOTA : Wyckoff trending idea looks promisingIOTA like many other tokens looks like playing the "Wyckoff accumulation Textbook".
Let's see if this plays out.
Note that marks signed on the chart are irrelevant with time and price. They were drawn randomly and not after checking the correct period time intervals and price changes.
Not financial advice!
This post is just an idea! Do you agree? What's your opinion?

Accumulation Phase D, right shoulder incomingBitcoin is following a textbook Wyckoff accumulation 3 pattern, which would bring us one more wave down before the start of the next bull market, increasing the mounting evidence we might that the next months will see a decline in price action and opening more opportunities for long-term accumulation.
This wave would form the right shoulder in a classic inverse H&S pattern, a pattern that BTC used in the past to reverse long-term market trends.
With a timeline set to complete the shoulder at the end of Q1, the path would be open for investors to move in with fresh money at the beginning of Q2 and send the price up.
The price target for this idea is 19k.


BTC - Final Boring Torturing Phase Before BreakoutAs we can see BTC is behaving very simmilary of what XRP did after the SEC lawsuit in 2020. Wyckoff accumulation pattern is almost done, we just have to go through last boring phase, which could drag quite some time. We could be doing a simple ABC correction. Its a phase where a lot of retail will sell, specially those that bought back in at this recent 24k high. Imagine if prices were to stay hoovering here till Sep., when most of retail tought we are already breaking out.
For those who understand Wyckoff accumulation pattern, we are currently in SOS (Sign Of Strength) phase and are haeding to LPS (Last Point of Support) in an ABC style which could be as low as 18.3k so don't get scared if that happens.
As far as ABC correction goes, we could be already be done with an A wave and are heading up a bit for a B, but i'm not shore about that as A wave could still be in the making.
I am not expecting any violent breakdown as there are just to little long positions open as opposed to short ones.
DISCLEMER:
I am not a financial advisor so non of this should be taken as a financial advise. Be well.

TSLA Re-Accumulation/DistributionTSLA price swings are signs of accumulation/distribution. Weakness in small time frame / Strength on Daily - this is either correction or liquidity grab into next move up
$190 support - Weakness under $188, $182 is LPS
*1hr support 21 EMA Resistance 8ema
*5ma Daily Support
Weekly anchored VWAP: $188
*1hr indicators are showing triple negative divergence
Powell could be the catalyst to push markets & Tesla into correction territory
*Options - $200 weekly Call Wall Wallstreet max pain will be between $188-$190 (this changes daily)
Weekly expected move: $207 high $197 low
Intraday: 2/7 (Bearish)
Trading between $198-$190 then $188-182
I was expecting an upthrust to $200-201 for a liquidity grab before correction... still possible, but 1 hr. bullishness is weakening
current bias is bearish for the short-term. *above 201.8 I can see this going to weekly highs
*Pay attention to Volume of Selling and Buying - Buying Volume is still larger* Low Volume Sell-off is a sign of re-accumulation

ES Wyckoff Accumulation - bullish case for equitiesBullush case for Equities:
After a clear distribution top followed by a markdown and underside retest of the previous range equities are looking like they are building a classic Wyckoff accumulation range.
This would fit very well with the macro picture of a short term resurgence of inflation, increasing rates and a relisation that the pause only comes AFTER the painful selloff. This sets up for a choppy sideways year for risk and a good probability of Lows in the latter half of the year followed by recovery thereafter.
Trader's market.
