BTCUSDT Bullish Reversal: Potential Move to Supply Zone at 93,58BTCUSDT has recently formed a strong low around 89,205, suggesting that the market could be preparing for a bullish reversal. The price has pulled back into the demand zone, offering a potential entry point for traders looking to capitalise on this move. This setup follows a break of structure (BOS) to the upside, indicating that the market may be shifting towards a bullish trend.
As the price approaches the demand zone, traders should closely monitor for any signs of confirmation, such as a bullish candlestick pattern or a significant increase in volume. These signals could provide the necessary confirmation that the market is ready to move higher. The strong low near 89,205 is expected to provide support, and a bounce from this level could push the price back towards higher levels.
The next key target for Bitcoin is the supply zone around 93,580, which represents a potential area of liquidity. Once the price enters this zone, it is important to monitor the price action for signs of rejection or continuation. If the price breaks through the supply zone, it could indicate further upside momentum. However, if the price fails to break through, a reversal could be expected, and traders should be prepared for potential pullbacks.
For those considering entering the market, it is crucial to wait for confirmation before placing any trades. Entering prematurely could expose traders to unnecessary risk, as the market could still reverse or consolidate. A well-timed entry at the demand zone with proper risk management strategies in place could yield positive results if the market continues to move higher.
In summary, BTCUSDT is showing signs of bullish potential after forming a strong low and pulling back into the demand zone. Watch for confirmation before entering, and use the supply zone at 93,580 as a key level to monitor for possible price rejection or breakout. Proper risk management is essential to navigate this setup and capitalise on potential price movements."
X-indicator

EURUSD approaching the support _longEURUSD is trading in a channel and soon price may come to support and pullback from here . let us see how it plays out .

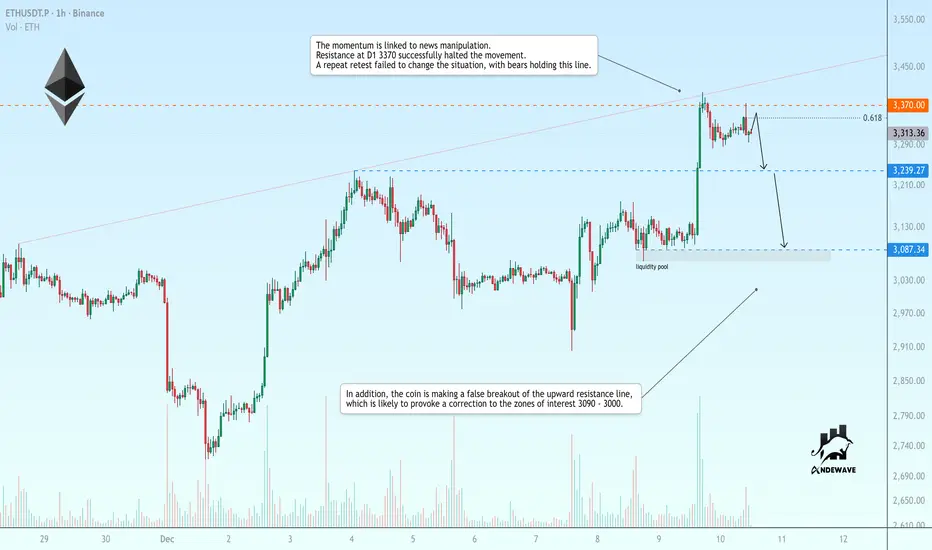
ETHUSDT is ready to rebound after a false breakoutThe momentum is linked to news manipulation. Resistance at D1 3370 successfully halted the movement. A repeat retest failed to change the situation, with bears holding this line.
In addition, the coin is making a false breakout of the upward resistance line, which is likely to provoke a correction to the zones of interest 3090 - 3000.
Scenario: keeping the price below 3350 may form a reversal setup and provoke a correction down.
GBPNZD higher bearish expecting
OANDA:GBPNZD we are have break of PA, later and break of H&S pattern, today we are have RBA from which expecting impact on this trade.
Here having strong bearish expectations.
SUP zone: 2.31100
RES zone: 2.28500, 2.27900


LINK USDT LONG SIGNAL---
📢 Official Trade Signal – LINK/USDT
📈 Position Type: LONG
💰 Entry Price: 14.064
Entry price=2
13.756
---
🎯 Take-Profit Targets (Partial Exits):
• TP1: 14.294
• TP2: 14.515
• TP3: 14.740
• TP4: 14.976
• TP5: 15.316
• TP6: 15.660
---
🛑 Stop-Loss: 13.355
📊 Timeframe: 15m
⚖️ Risk/Reward Ratio: ≈ 2.03 (based on TP6)
💥 Suggested Leverage: 5× – 10×
---
🧠 Technical Analysis Summary
LINK is showing signs of bullish momentum after holding above the key support level around 14.064. The market structure on the 15-minute chart suggests a potential upward move, with higher lows forming and price testing immediate resistance zones. The take-profit levels are aligned with previous swing highs and liquidity concentrations on the higher timeframes.
The critical upside targets are:
14.294 → 14.515 → 14.740 → 14.976 → 15.316 → 15.660
A confirmed break above TP1 (14.294) may accelerate momentum toward the subsequent targets, especially if supported by increasing volume and bullish market sentiment.
---
⚙️ Trade Management Rules
✔ Take partial profit at each TP level
✔ Move stop-loss to entry point once TP1 is reached
✔ Trail stop-loss upward as price advances
✔ No re-entry if stop-loss (13.872) is triggered
✔ Confirm bullish structure and momentum before entering
---
📌 TradingView Hashtags
#LINKUSDT #LINK #CryptoSignal #LongSetup
#TradingView #FuturesTrading #TechnicalAnalysis
---
Disclaimer: Always practice proper risk management and verify market conditions before entering any trade.

Apple Consolidates at Key Fibonacci Level: Is a Breakout Coming?Apple is sitting right under a big technical level: the 38.2% Fibonacci retracement around $279–280. This spot has been blocking price for days, and the stock keeps bouncing between this resistance and the support levels below.
Buyers have already defended the 50% ($276) and 61.8% ($273) Fib levels, which shows there’s still strength in the uptrend. But unless Apple finally pushes above $280 with conviction, it could swing back down to retest those support levels again.
In short: Apple is coiling up, and the breakout direction from here will tell us everything about the next move.

ES - December 10th - Daily Trade PlanDecember 10th- Daily Trade Plan - 6:45am
*Before reading this trade plan, if you did not read yesterday's take the time to read it first! (You can view the posts in the related publication section) *
If my posts provide quality information that has helped you with your trading journey. Feel free to boost it for others to find and learn, also!
My daily trade plan and real-time notes that I post are intended for myself to easily be able to go back and review my plan and how I did from an execution perspective.
--------------------------------------------------------------------------------------------------------
I am going to keep today's trade plan pretty simple. It is the Fed Rate Announcement today at 2pm. Most professional traders do not even trade today, especially after 11am. Many times, the initial move after the Fed meeting is a trap, not always. We could easily go 100pts one way or another. We have been building a massive consolidation pattern that should break out or breakdown this week. Below 6790 and we should be heading lower and could over several weeks re-test the 6530-6550 November lows. IF we are able to break out above 6900 we should head to ATH's.
Let's discuss how we can grab some points this am. I will only be looking to trade before 11:30am today and will need to be from one of the following key levels.
Our overnight high is 6857-60 and our overnight low is 6834. Yesterday 6837 was Mondays low, 6844 was yesterday's low. 6834 is also the weekly low. and 6842 is a previous week low with 6801 being last week's low. I will be surprised if price does break down that we lose below 6790 this week. I could be wrong, but we have some important levels below current price that needs to be tested before it can flush lower.
Key level today -
1. 6834 Flush and Reclaim
2. 6818 Flush and Reclaim
3. 6801 Flush and Reclaim
If price cannot come back down and retest the overnight low, any reclaim of 6848 should give us a retest of the overnight high at 6857. If we clear 6857, we still have some key resistance levels above and we need to clear 6872 to break out and test 6893 and then above there we should be off to ATHs with 6952 being big first target.
IF price does flush lower, I would be patient and let price build a base at or below one of the key levels and wait for price to show that it wants to hold above that level.
I will post an update around 10am EST
----------------------------------------------------------------------------------------------------------------
Purple = A Weekly Low (Current or Previous Week)
Blue = A previous day low (Day before or day in the past week)
Red - Overnight Session High/Low (Prior to my post)
White = Key Support/Resistance Levels

My people who is ready to BuyWe have a support zone on that yellow line I’ve put . It’s a lot of buy orders in that area so get ready to grab some buys. I am not so good at explaining but I hope gerrit 😊

Gold Stalls at 4195, Awaiting BreakoutGold is currently trading around 4195 and moving sideways after the recent decline, showing that the market is still waiting for a clear breakout signal.
Technical Outlook:
The price is stuck between 4188–4202, indicating consolidation. Buyers are defending the lower zone, while sellers are still dominating below 4205. A breakout from this range will likely determine the next directional move.
Market Bias:
Gold is neutral-to-bearish as long as it stays below 4205.
Trading Strategy (Short-Term):
🔻 SELL XAU/USD
Entry: 4198 – 4202
TP: 40 / 80 / 200 pips
SL: 4206
🔺 BUY XAU/USD
Entry: 4188 – 4191
TP: 40 / 80 / 200 pips
SL: 4184

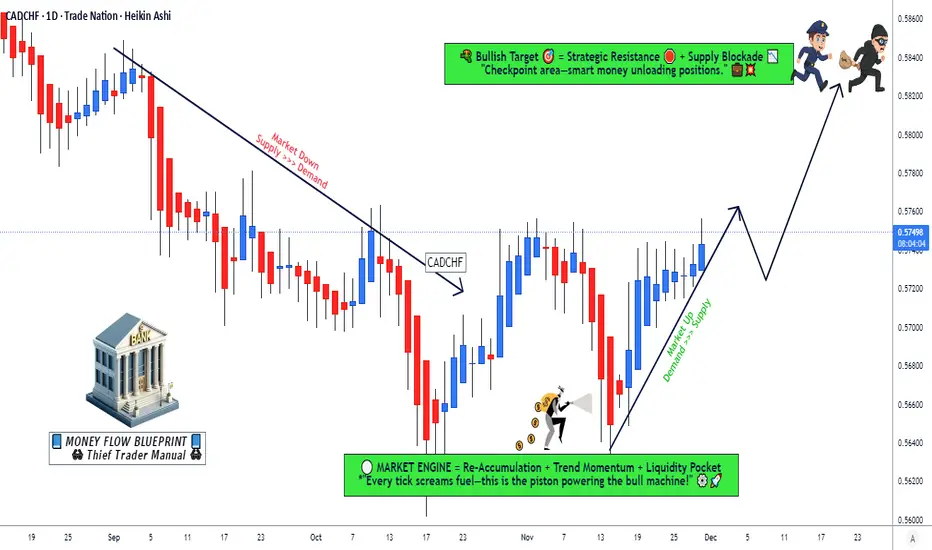
CAD/CHF Technical Roadmap for a Potential Upside Push📌 CAD/CHF Swing Trade — Thief Layer Strategy | Bullish Opportunity 🚀🇨🇦🇨🇭
Asset: CAD/CHF — “CANADIAN DOLLAR VS SWISS FRANC”
Market Type: Forex Swing Trade Setup
📈 Trade Plan (Bullish Bias)
This setup is based on Thief Strategy Layer Entries, a method that scales into the market using multiple limit orders to capture value zones and reduce average entry cost.
✅ Entry Plan — “Thief Layer Style”
Using multiple buy-limit layers, entering at:
0.56800
0.57000
0.57200
(You can increase or modify layers depending on your own market confidence and capital rotation.)
🛡️ Stop Loss (Manage With Discipline)
Thief SL: 0.56600
Dear Ladies & Gentlemen (Thief OG’s), adjust your SL according to your personal risk tolerance and strategy.
I am NOT recommending you to use my SL as your fixed level — protect your capital the way you see fit.
🎯 Take Profit (Escape With Profits)
Price faces moving-average resistance, overbought signals, and potential bull traps, so take profits without hesitation.
Primary TP: 0.58400
Again — this is NOT a fixed TP for you.
Make money and take money based on your own risk and your own timing.
📚 Market Logic & Why Bullish?
CAD is gaining momentum due to improved risk sentiment.
CHF weakness appears in correlated safe-haven flows.
Technical structure shows bullish demand zones aligning with MA support.
Layered buys allow high flexibility during any intraday volatility.
🔍 Related Pairs to Watch (Correlations & Key Notes)
💵 USD/CHF
When USD strengthens and CHF weakens, it often pushes CAD/CHF upward as well.
Watch for risk-on sentiment and U.S. macro prints — they indirectly drive CHF’s safe-haven behavior.
💵 CAD/JPY
A strong CAD here often confirms broad Canadian Dollar strength.
If CAD/JPY is bullish, it reinforces confidence in CAD/CHF longs.
💵 USD/CAD
If USD/CAD is falling, that means CAD is strengthening — supportive for CAD/CHF upside.
Oil prices also influence CAD heavily; rising oil generally lifts CAD.
💵 EUR/CHF
Good for tracking CHF strength/weakness cycles.
If EUR/CHF is climbing, that shows CHF weakening — positive for CAD/CHF bulls.
🔥 Final Words (Thief OG Style)
Stay patient. Let the layers fill.
Protect your capital. Book profits smart.
Trade your plan — not someone else’s emotions.

$SHOP: Higher Low and Flat Base Set-UpOverview of Recent Price Action
SHOP recently experienced a pullback of approximately 25% from its all-time high (ATH). Such retracements are a typical pattern for stocks that have been in a sustained long-term uptrend. The recent dip allowed the stock to reset its base, which means that any subsequent upward movement could mark the beginning of a new stage two uptrend.
Technical Strength and Higher Low Formation
Notably, SHOP has established a higher low, indicating that the stock may be regaining strength. This technical development suggests a potential shift in momentum, which could attract additional buying interest as the stock stabilizes and positions itself for a possible breakout.
Position Entry and Current Set-Up
A half-sized position was initiated yesterday as SHOP reclaimed the 21-day Exponential Moving Average (EMA). An additional allocation was made today after the stock surpassed the 50-day Moving Average (DMA). Currently, SHOP is trading just below a flat base, with the anticipation that it may soon break out above this level.
Potential Price Target
While specific price targets are not typically set, it is reasonable to expect that the stock could attempt to challenge its previous all-time high. If SHOP achieves this, it would represent a gain of about 12% from the breakout point.
Risk Disclaimer
Readers are strongly encouraged to conduct their own analysis and adhere to their personal trading strategies. It is crucial to understand that all investments carry inherent risks. Making informed decisions is essential when allocating capital within the financial markets.

XAGUSD – 4H OutlookBias: Short-term corrective move after hitting major supply zone.
XAGUSD just tapped a strong 4H supply zone around 62.70 – 63.00, and price immediately rejected with a clear wick. This confirms sellers are active at this level.
Structure-wise, silver has been moving in a parabolic impulse, and now the chart is showing the first signs of exhaustion. If the rejection holds, market likely forms a lower high before shifting into a deeper correction.
Key Levels
62.70–63.00 (Supply Zone – Strong Rejection)
61.98 (First support / retest area)
60.62 (Major 4H structure support)
59.31 (Bigger correction target)
What I Expect Next
Price retests the supply zone → forms a lower high
Pullback continuation toward 61.98
Break below opens the door to 60.62
Full correction target sits near 59.30
Momentum indicators also show bearish divergence + Stoch RSI cooling off, supporting a temporary downturn before any bigger trend continuation.
Summary
XAGUSD likely enters a short-term correction phase after rejecting a key supply area. I expect price to form a lower high and continue down toward the 60–59 zone unless buyers reclaim and hold above 63.

GBPUSD at support LongGBPUSD price has returned to the Support level from this area the price may resume to higher level within this channel . let us see how it plays out.

HYPER: waitHey guys! HYPERUSDT's navigating some choppy waters on the 1h timeframe after that sharp -10.34% pullback, but the structure underneath is actually holding up better than the headline number suggests. Let me break down what's happening here and where the opportunities might be developing.
Price is currently trading at $0.1517 after bouncing from a $0.1422 low, and despite the daily drawdown, we're still sitting comfortably above all major moving averages. The EMA20 at $0.1483, EMA50 at $0.1440, and EMA200 at $0.1375 are forming a bullish stack that's providing structural support. When you see price hold above this kind of moving average alignment after a significant wick down, it's telling you that buyers are defending key levels. That's not random - that's institutional memory and algorithmic support kicking in.
The technical indicators are painting a mixed but cautiously bullish picture. RSI's at 58.2, which keeps us in neutral territory but with a slight bullish lean. What's more important than the RSI level itself is the context - we saw a 50% lower wick formation on the recent candle, which is a strong signal that buyers stepped in aggressively to defend the $0.1422 low. That's real demand showing up when it matters most. The MACD's showing some short-term weakness with the histogram at 0.0014 sitting below the signal line at 0.0019, creating a bearish crossover that suggests momentum hasn't fully shifted back yet. But here's the thing - the ADX at 24.2 tells us we're not in a strong trending environment, which means these momentum signals might be less reliable than usual.
Stochastic at 56.8 and MFI at 48.1 are both dead neutral, confirming we're in a decision zone where the next move could go either way based on volume and external catalysts. The Bollinger Bands are showing price above the middle band at $0.1491 but below the upper band at $0.1560, suggesting we're in the upper half of the range without being overextended. The HMA55 at $0.1549 is creating an immediate resistance level that's worth watching closely.
Now let's talk about the volume situation, because this is critical. Current hourly volume is sitting at $2.8M, which is significantly below the $18M average. That's a massive discrepancy, and it tells us that this -10% move happened on weak conviction. When you see sharp price moves on below-average volume, it often means the move lacks staying power. Sellers aren't really committed here, and once buyers show up with size, we could see a quick reversal back toward resistance zones. The 24h volume of $105M is decent, but the recent hourly compression suggests we're in a consolidation phase waiting for the next catalyst.
Support levels are well-defined and worth respecting. The first major support sits at $0.1440 where the EMA50 converges with recent price structure. This level has been tested multiple times over the past sessions, and buyers have consistently defended it. Below that, $0.1422 represents the 24h low and the absolute line in the sand for the bullish case. If we break and close below $0.1422 with volume, the structure gets compromised and we'd be looking at a retest of the $0.1375 zone (EMA200) or potentially the lower Bollinger Band at $0.1423. That would shift the entire bias bearish.
On the resistance side, $0.1549 (HMA55) is the immediate hurdle, followed closely by $0.1560 (Bollinger Band upper). These two levels create a tight resistance cluster that price needs to clear with conviction to confirm a bullish continuation. A break above $0.1560 with increasing volume would target $0.1590-$0.1600 initially, and if momentum sustains, we could see a push back toward the $0.1650-$0.1700 zone where prior supply exists from the recent high at $0.1788.
For a trading setup, here's how I'd approach this. If you're looking to enter long, the ideal accumulation zone is $0.1440-$0.1455, right at that EMA50 support where buyers have shown up consistently. Your stop loss needs to be tight below $0.1418 to protect against a breakdown of the support structure. That gives you about 2-3% risk, which is manageable. Target 1 would be $0.1549 (HMA55) for a quick 6-7% gain and 2.5:1 R/R. Target 2 sits at $0.1590 for about 10% upside and 4:1 R/R. Target 3 extends to $0.1650 if momentum really kicks in, giving you 14% potential and nearly 6:1 R/R. Scale out at each target to lock profits while letting runners work.
Alternatively, if you're more conservative or want confirmation, wait for a breakout above $0.1560 with volume exceeding the $18M average. That would confirm buyers are back in control, and you could enter on the retest of $0.1549-$0.1560 as new support with the same target structure but slightly better R/R since your stop would be $0.1530.
The internal market state is showing a bullish bias with 6 bullish factors versus 2 bearish, but directional confidence is only 38.6%, which explains the mixed signals. The regime is trending, but not strongly, and that low-volatility filter being inactive means we could see expansion soon. Price structure is showing both a higher low (bullish) and a lower high (bearish), which confirms we're in a consolidation range waiting for resolution.
Bottom line - HYPER's in a wait-and-see mode with a slight bullish lean. The moving average stack and strong lower wick suggest buyers are defending structure, but weak volume and MACD divergence mean we need confirmation before getting aggressive. Watch $0.1440 support and $0.1560 resistance as your key decision levels. What's your take on this setup - are you waiting for the breakout or accumulating at support?

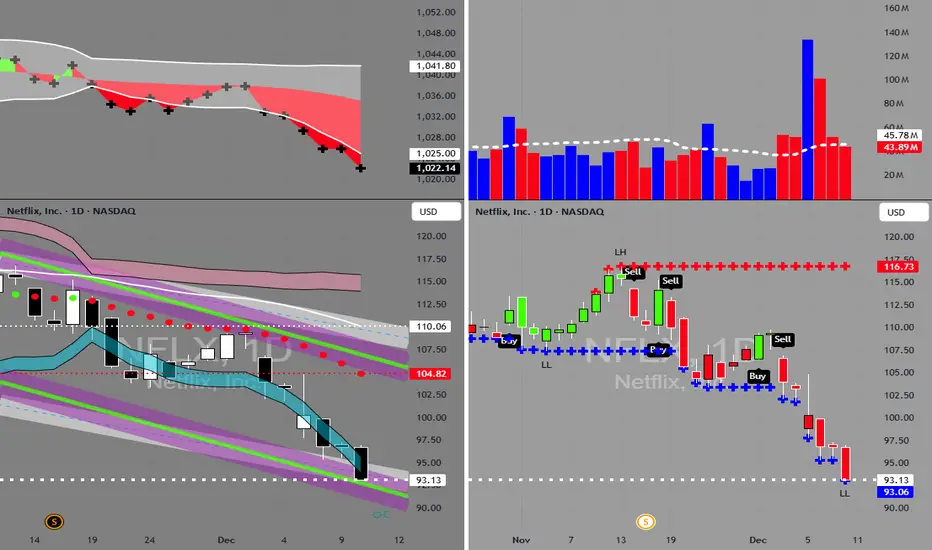
NFLX in BUY ZONEMy trading plan is very simple.
I buy or sell when at either of these events happen:
* Price tags the top or bottom of parallel channel zones
* Money flow volume spikes beyond it's Bollinger Bands
So...
Here's why I'm picking this symbol to do the thing.
Price in buying zone at bottom of channels
Money flow momentum is spiked negative and under bottom of Bollinger Band
Entry at $93.10
Target is upper channel around $105.00
Buying NASDAQ:NFXL for this trade

Strong Support and Resistance Area: 533.90-793.86
Hello, fellow traders!
Follow us to get the latest information quickly.
Have a great day!
-------------------------------------
(BNBUSDT 1D Chart)
The 533.90-793.86 area is a strong support and resistance area. A decline below this area is highly likely to trigger a long-term downtrend.
Therefore, if support is found around the 533.90-793.86 range, it would be a buying opportunity.
Since the HA-Low indicator formed at 871.15, if support is found around the 833.78-871.15 range, this would also be a buying opportunity.
Resistance levels are:
1st: 1028.57-1088.90
2nd: 1220.98-1302.65
The first and second levels above are resistance levels.
-
If the price holds above 793.86, it is expected to rise to around the circled range shown on the chart above.
BNB should be traded differently from BTC or ETH.
In other words, while you can continue to invest in BTC and ETH to purchase them, you should hold altcoins like BNB, XRP, and SOL by increasing the number of coins that represent profits.
Therefore, if the price rises after purchasing, you should sell the original purchase amount, leaving only the number of coins that represent profits.
This is because in a bear market, the price drops more sharply than expected.
BTC and ETH also show significant declines during bear markets, similar to altcoins. However, they tend to rebound faster than altcoins, allowing for continued investment and purchase.
However, to stabilize your psychological state, it's important to take some profits while you're in profit.
-
Thank you for reading to the end.
I wish you successful trading.
--------------------------------------------------

The bulls of Bitcoin gain more momentumFed Policy Analysis: Expected Rate Cut + Framework Reset, Bullish for Bitcoin Liquidity
1. Rate Cut Meets Expectations, Liquidity Easing Certainty Strengthened
The Fed delivered a widely anticipated 25-basis-point rate cut, lowering the federal funds rate to the 3.50%-3.75% range — its third cut this year. This move perfectly aligns with market expectations (89.4% probability per CME FedWatch), avoiding the risk of an "expectation gap shock."
While the statement’s mention of "a significantly higher bar for further rate cuts" may seem hawkish, Powell’s confirmation that "current rates are at the upper end of the neutral range" clarifies a "gradual easing" policy stance rather than an end to the easing cycle .
More crucially, the Fed simultaneously launched a new Treasury purchase program, which will directly inject market liquidity and form positive resonance with risk assets like Bitcoin. Historical data shows that Bitcoin’s average returns during Fed quantitative easing (QE) periods are 3.2 times higher than in regular periods . This liquidity injection ends the three-year quantitative tightening (QT) cycle, removing a key resistance for Bitcoin’s price movement .
2. Policy Framework Returns to Balance, Inflation Constraints Ease Marginally
The 2025 revision to the Fed’s monetary policy framework is a core highlight: it abandons the average inflation targeting system introduced in 2020, reverts to the traditional symmetric inflation target, and discards the employment shortfall rule to return to the original logic of balancing its dual mandates
Federal Reserve Board of Governors
.
This adjustment means the Fed will no longer deliberately tolerate inflation overshoots, but it also reduces the probability of "policy pivots triggered by a single inflation data point," making policy decisions more flexible . For the crypto market, the marginal easing of inflation constraints enhances Bitcoin’s appeal as a risk asset. Especially with U.S. core PCE moderately declining, the driving effect of liquidity easing on prices will be more pronounced .
The framework reset reflects the Fed’s response to post-pandemic economic changes — as global supply chain restructuring and labor market shortages end the low-inflation era, the previous framework’s limitations (which delayed inflation responses) are no longer applicable . This balanced approach provides a more stable policy environment for risk assets.
Bitcoin trading strategy
buy:91500-92500
tp:93500-94500-97000
sl:90500

NVDA SELLIf you have not SELL NVDA, than be prepare to SELL NVDA riding it back down to 93.00 to 77.00 as Profit Targets, Stop Loss will be determine later!
If anyone likes long mumbo jumbo garbage analysis, than this is NOT for you.
Also, if you are afraid of risk, failure, and want only a 100% sure thing, than
run as fast as you can from the market, because the market is NOT a sure thing,
so it is definitely NOT for you.
WARNING: This is just opinions of the market and its only for journaling purpose. This information and any publication here are NOT meant to be, and do NOT constitute, financial, investment, trading, or other types of advice or recommendations. Trading any market instrument is a RISKY business, so do your own due diligence, and trade at your own risk. You can loose all of your money and much more.

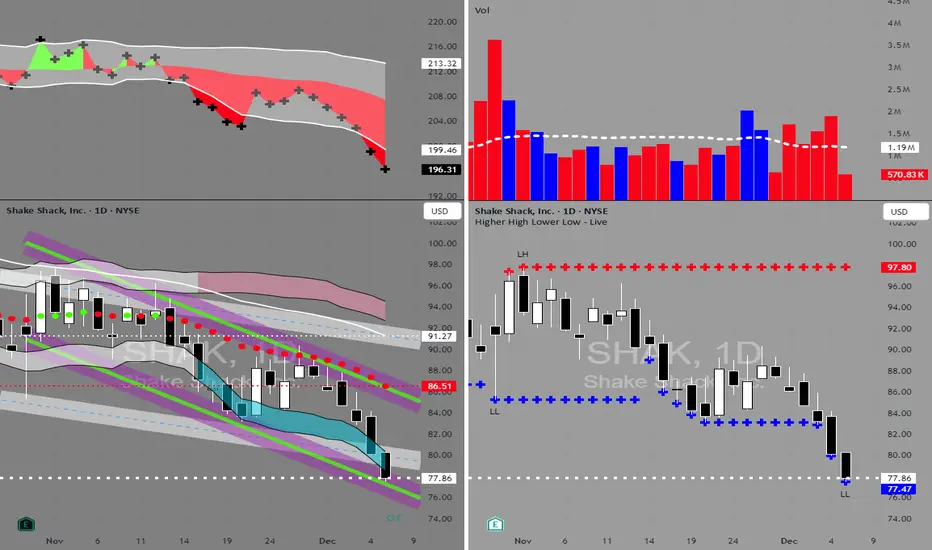
SHAK in BUY ZONEMy trading plan is very simple.
I buy or sell when at either of these events happen:
* Price tags the top or bottom of parallel channel zones
* Money flow volume spikes beyond it's Bollinger Bands
So...
Here's why I'm picking this symbol to do the thing.
Price in buying zone at bottom of channels
Money flow momentum is spiked negative and under bottom of Bollinger Band
Entry at $77.86
Target is upper lower channel around $86.50
Title: Trendline Break Setup – Gold Opportunity SHORTGold has moved into a key supply zone and broken the trendline, presenting a high-probability setup. Entry on trendline confirmation offers a strong risk/reward, targeting at least 4R.
Partial positions help manage risk,
with stops shifted to break-even after initial gains.
The combination of zone confluence and trendline break increases the chance of continuation, while monitoring price reaction allows for adaptive management.
