BTC/USD Looking sell major support area breakdown BTC/USD Analysis – Bullish Trend Breakdown Ahead?
Price is currently approaching a key structure area, and a break below major support could open the door for downside continuation.
📉 Sell Entry: 86,700
🎯 Technical Targets (1H Timeframe):
• 1st Target: 85,200
• 2nd Target: 83,600
• 3rd Target: 82,000
As always, use proper risk management and wait for clear confirmations before entering any position.
If you find this analysis helpful — Like, Follow, Comment, and Share!
Stay disciplined and trade safely.
X-indicator

Exited BTC 08/25/25Fully exited position by the end of August. According to my last idea on 9/5/24, the exit window was targeted from November 11, 2024 through October 20, 2025. We're a little shy of the closing date, but I sold a heavy first fraction of the entire bag on November 12, 2025 and then again in December with that initial spike to my sell target line around 94k at the top of the bull flag drawn on the September 5 idea. Failure to hold above 120k is close enough to that upper trend line for me. I'm fully out, and need to adhere to my original accumulation/distribution strategy regardless of how much further up this might go through the end of the year.
I will note that I have not seen a Pi-Cycle top signal, and the Fed is beginning to cut rates with the meeting today. Likely several other cuts to interest rates in the coming in the next 12 months. This could favor risk-on assets, but I think BTC looks weak, and will likely be a "sell the news" event. There is NO projected cross of the 111DMA and 350MAx2 price.
Because of this, I've copied this year's bull cycle (inversed) for a possible play through the end of next year. This is in keeping with the flattening of cycles and increased adoption into traditional financial vehicles. Next cycle strategy should see a new idea for accumulation by the end of 2026.

Bitcoin: Down She GoesDown and down she goes - where she's stops nobody knows.
But I guess the bottom will be in on Oct. 10th 2026?
Let's see...!

EUR/GBP Market Outlook – Personal View (Not Financial Advice)Price is currently sitting on a strong daily support level, which so far appears to be holding. On the 1H timeframe, price is ranging, with pockets of bullish candles showing early signs of interest from buyers.
Additionally, price is positioned at the lower boundary of a downward channel, adding confluence to this support zone.
If this support continues to hold, we may see the euro regain strength against the pound, which has been under pressure recently. A strong positive fundamental catalyst for the euro would further support this potential shift in momentum.
This analysis represents my personal view of the market and is not financial advice.

AUD/JPY-Supply Zone Rejection Signals Potential Bearish ReversalAUD/JPY is showing signs of weakening bullish momentum as price reacts sharply from the Strong Supply Zone at the top of the chart. This area has historically acted as a major distribution zone, and the latest rejection suggests that sellers are stepping back into control.
After forming multiple double-bottom rallies, price pushed upward but failed to sustain momentum beyond the supply ceiling. The sharp rejection indicates that liquidity has been collected from trapped buyers, and the market may now be preparing for a deeper corrective move.
The structure around the neckline and mid-buyer zone is critical. A break below this area—especially below the 100.000 level—would confirm a bearish shift. The chart already highlights a possible breakout-retest scenario, where price could break the buyer zone, retest it from below, and continue downward.
If sellers maintain pressure, the next target lies near the Support Zone around 98.500, aligned with previous range lows. A deeper move could even reach the broader Demand Zone Area, completing a full bearish correction.
Overall, the chart is signaling a potential reversal from supply, with sellers gaining strength and momentum shifting toward the downside as long as price remains below the supply zone and fails to reclaim the neckline.

XAU/USD Looking sell from supply zone at 4240 strong sellXAUUSD (Gold) – 1H Bearish Setup
Price is currently reacting from the 4240 supply zone, showing signs of weakness on the 1-hour timeframe.
I’m looking for a sell opportunity at the 4220 level.
Targets:
• TP1: 4207
• TP2: 4190
• TP3: 4171
Market structure remains bearish for now, but always remember:
✔️ Follow your trading plan
✔️ Use proper risk management
✔️ Protect your capital first
If you find this analysis helpful—Like, Follow, Comment & Share 🔄

Gold Bullish Continuation or Pullback MoveXAU/USD is maintaining a strong bullish structure after recovering from the major demand zone area and pushing through multiple resistance levels. Price action shows a clean transition from accumulation to expansion, supported by an upside channel, indicating consistent buyer control.
After the liquidity sweep below the range, the market formed a rounded base and began creating higher highs along the curve line. Even though the curve line was briefly broken, buyers quickly regained momentum, driving price back into the buyer zone near 4,250. This zone remains a critical decision area; holding above it may trigger a continuation toward the upper supply zone and the immediate bullish target around 4,360.
If price rejects from the buyer zone, a corrective pullback toward 4,180–4,140 is possible before another attempt upward. However, as long as the higher-timeframe demand zone remains protected, the main bias stays bullish. Market structure, channel formation, and prior liquidity sweeps all support the likelihood of further upside continuation.

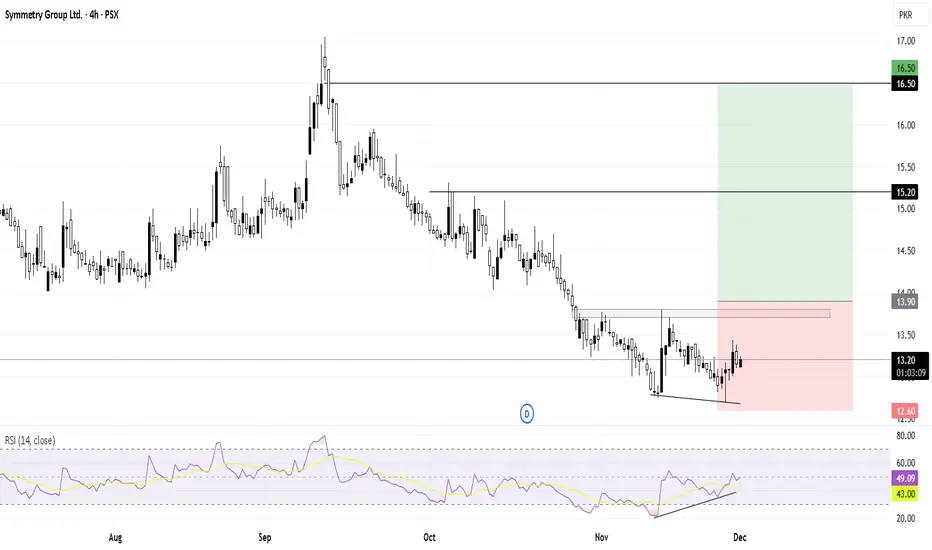
SYM Double Bottom Reversal SetupSYM has formed a double bottom along with bullish divergence , indicating a potential trend reversal. Confirmation will come on the breakout of the last supply zone. A stop loss can be placed below the last low, with take profit around the previous high.
GBP/USD BSL Target Confirmed After $1.3210 Liquidity sweep.This analysis breaks down the high-probability setups across two major markets: GBP/USD and XAU/USD, utilizing institutional concepts like Liquidity, Order Blocks (OB), and Structural Breaks.

Bitcoin Price Falls To $86,000; Will It Shake Out Weak Hands?Bitcoin is trading at $86,005, holding just above the $85,204 support level. The asset remains trapped under a persistent downtrend that has lasted more than a month. This would preventing any sustained recovery attempts.
If market conditions worsen or short-term holder selling accelerates, Bitcoin could break below $85,204. A drop through this support would expose the price to $82,503 and potentially deepen losses as fear rises across the market.
However, if buyers step in and support strengthens, Bitcoin could reclaim upward momentum. A bounce from current levels could send BTC toward $89,800. A decisive move above that resistance would be essential for Bitcoin to retest $90,000 and invalidate the bearish thesis.
ETHUSD SIGNALThis signal is generated using a disciplined, data-driven approach that evaluates price action, trend dynamics, and liquidity distribution. The trade setup highlights a moment where market conditions align to create a balanced opportunity with a favorable risk-to-reward profile.
The analysis emphasizes precision and clarity, focusing on key decision zones where buyers or sellers are most likely to take control. This signal is crafted to help traders navigate the market with structure, consistency, and confidence.
📌 Signal Breakdown
Entry Level: Identified through market structure validation and momentum confirmation
Stop-Loss (SL): Placed at a strategic invalidation zone for controlled downside risk
Take-Profit (TP): Target levels modeled around liquidity pockets, trend projections, and volatility range
Technical Reasoning: A brief yet clear explanation outlining the logic behind the chosen direction
Market Scenarios: Expected price behavior under both bullish and bearish conditions
⚠️ Disclaimer
This signal is not financial advice and is intended solely for analytical and educational purposes. Always manage your risk appropriately and stay adaptable to changing market conditions.

NAS100 — Bearish Below 25,333 with Target at 25,054Price remains capped below the 25,333 key level, keeping the market in a clear bearish structure. As long as price trades under this zone, bullish attempts are likely to fail, and any rebounds should be viewed as corrective only. A sustained move below the intermediate supports at 25,181 and 25,166 strengthens the downside momentum and confirms continuation toward the primary bearish target at 25,054. Momentum and structure remain aligned to the downside while the key level holds.

Gold & Silver Are On Fire Right Now!🌕 Gold is up — heading towards its fourth straight monthly gain, hitting a fresh two-week high on expectations of an upcoming rate cut by the Federal Reserve.
💎 Silver just smashed a new all-time high — zooming to $56.78/oz, rallying ~16.6% this month alone!
📈📉 With global rate-cut hopes rising, safe-haven metals are drawing fresh investor love. Whether you call it “hedge”, “insurance”, or “bullish vibe” — the trend is clear: metals are in demand.
👉 Bottom line: If you’ve been waiting for a strong entry into commodities — now might be the moment. Gold and silver are ringing the bell loud and clear! 🔔


GBPJPY Market Cycle Position
The chart is currently in a small Markdown correction inside a larger uptrend — not a full distribution.
Accumulation happened at the lows around 96–98.
Markup continued up to 102+.
Distribution near 102–102.3 (sideways + upper wicks).
Now: price is in an early Markdown correction, pulling back toward support at 100.5–101.
This area acts as LPS (Last Point of Support).
🔹 Last 5 Candles
-5: Red, long upper wick → selling pressure.
-4: Small body, small lower wick → first slowdown.
-3: Very small candle → balance (stall).
-2: Small green → buyers showing.
Last candle: Small red with lower wick → sellers weak, buyers defending.
🔹 Conclusion
The chart is in a mild Markdown phase, testing support before potentially starting a new Markup leg upward.

NAS100 Shorting Opportunity NAS100 resting at the short term resistance level, and expected a quick sharp downfall

GOLD 1H Chart Technical AnalysisDear Traders,
Please also consider the important news events on the economic calendar, as they may significantly impact market volatility and price movement.
We are currently observing price consolidating between two key weighted levels, with an upside gap at 4156 and a downside gap at 4040. To identify the next directional range, we need to focus on these 2 scenario marked.
Price may continue to move sideways and retest these zones until one of the weighted levels decisively breaks and locks, which will confirm the direction for the next market leg. Refer to the arrows marked on the 1H timeframe, which highlight the two potential scenarios and assist with accurate entry timing.
Scenario 1 – Bullish Continuation
If price breaks the resistance and locks above 4155, we anticipate a continuation toward higher targets 4193 & 4233, supported by the bullish structure.
Scenario 2 – Support Test & Bounce
If price fails to lock above resistance, we expect a retracement toward the lower support zones at 4100 & 4060 for a potential support test and bounce.
We will keep both scenarios in mind as we continue taking buy entries from dips. Our updated weighted levels and structural zones will help us track any downward movement and position ourselves to capture upward bounces effectively.
As always, we will continue executing our dip-buying strategy, targeting 20–40 pips per entry. Each structural level consistently provides a 30–50 pip bounce, offering clean, high-probability entry and exit opportunities.
The Quantum Trading Mastery

BTCUSD Sell Setup: Targeting 82,000 After Resistance BounceBitcoin (BTCUSD) is currently showing signs of downside pressure from the $86,500 zone, where price has struggled to break higher. As long as it remains below this resistance area, bearish momentum is likely to continue.
Analysis:
BTC is rejecting the upper resistance zone, indicating potential for a corrective move toward the 82,000 support level. A sustained trade below 86,500 increases the probability of further decline. Manage risk carefully as volatility remains high.
🗝️ KEY LEVELS
🔻 Entry: 86,500
🎯 Target: 82,000
🛑 Stop-Loss: 88,200

Short Nifty :: Nifty Open - PDH Nifty opened at previous day high and a pretty good shot apart, ready, short, nifty, and enjoy the money, cheers, guys

GBPUSD Trend change, short squeeze support at 1.3150The GBPUSD remains in a bullish trend, with recent price action showing signs of a breakout within the broader uptrend.
Support Zone: 1.3150 – a key level from previous consolidation. Price is currently testing or approaching this level.
A bullish rebound from 1.3150 would confirm ongoing upside momentum, with potential targets at:
1.3265 – initial resistance
1.3300 – psychological and structural level
1.3335 – extended resistance on the longer-term chart
Bearish Scenario:
A confirmed break and daily close below 1.3150 would weaken the bullish outlook and suggest deeper downside risk toward:
1.3110 – minor support
1.3080 – stronger support and potential demand zone
Outlook:
Bullish bias remains intact while the GBPUSD holds above 1.3150. A sustained break below this level could shift momentum to the downside in the short term.
This communication is for informational purposes only and should not be viewed as any form of recommendation as to a particular course of action or as investment advice. It is not intended as an offer or solicitation for the purchase or sale of any financial instrument or as an official confirmation of any transaction. Opinions, estimates and assumptions expressed herein are made as of the date of this communication and are subject to change without notice. This communication has been prepared based upon information, including market prices, data and other information, believed to be reliable; however, Trade Nation does not warrant its completeness or accuracy. All market prices and market data contained in or attached to this communication are indicative and subject to change without notice.

Gold Is Loading Pressure — The Next Breakout Will Be Violent1. Market Structure Overview
Price is currently respecting a rising channel, showing a consistent sequence of higher highs – higher lows, but with gradually compressed momentum near the upper boundary and the resistance zone.
Key observations:
- Price is hovering near the upper trendline of the ascending channel.
- The resistance zone is directly above current price, causing hesitation and wicks.
- The chart shows a potential indecision → correction → continuation pattern forming.
This reflects a market preparing for a bullish continuation, but only after a controlled pullback.
2. Expected Scenarios for Today
✓ Primary Scenario – Bullish Retest Before Breakout (High Probability)
Price is likely to:
- Pull back toward the midline/lower edge of the ascending channel (yellow zone).
- Form a higher low within structure.
- Execute a clean retest of the ENTRY ZONE highlighted on your chart.
- Break above the Resistance Zone → Continue toward higher targets.
This matches your projected structure perfectly.
Entry Logic:
- Wait for price to retest the rising trendline and show bullish confirmation.
- The ENTRY ZONE is valid and aligns with trend continuation.
Upside Targets:
- TP1: 4,215–4,225
- TP2: 4,250+
- TP3 (extended): 4,280+ if the breakout is impulsive.
✓ Secondary Scenario – Compression Before Break
If price stays inside the channel and moves sideways:
- Market remains bullish but indecisive.
- This builds liquidity for a stronger breakout later.
- No selling is recommended unless structure breaks.
This scenario still favors bulls—just slower.
3. Trend Bias (Intraday)
The dominant trend is:
➡️ BULLISH – Buy the dip, do NOT chase breakouts
Signs confirming bullish bias:
- Higher lows remain intact.
- Structure respects the ascending channel perfectly.
- Resistance is tested multiple times → weakening.
- Volume spikes on bullish waves, fades on corrections.
4. Professional Conclusion
Gold remains in a strong bullish continuation structure inside the rising channel.
Your ENTRY ZONE is positioned perfectly for a high-quality retest trade.
Plan of Action:
- Wait for the pullback to the trendline.
- Confirm bullish rejection.
- Enter long within the zone.
- Target the liquidity sweep above resistance.
Smart, calculated, high-probability setup. 🔥

SOL Bleeds Below 130 – Sellers Take Full ControlSolana broke down again, slicing through 130 support after repeated rejections from the 180–220 OB cluster. Structure is fully bearish with no bullish MSB to confirm a reversal.
RSI dropped to 36 and MACD just crossed back bearish. This chart screams continuation unless bulls pull off a fast reclaim of 140.
Momentum is fading hard. Expect lower prices if trend stays intact.
Bias: Bearish
Pair: SOL/USDT
Timeframe: 12H
This is not financial advice, only data analysis. Please consult a qualified financial professional for personalized guidance.

BTC: Continue Going LongAfter testing the resistance level of 92K, BTC declined again to build up momentum, waiting for the next upward movement. As I have mentioned multiple times, levels below 90K are suitable buying opportunities, and today we continue to go long on BTC.
BTC Trading Strategy for Today:
BTCUSDT buy@86000-87000
TP:90000-92000
All signals for consecutive long positions have been profitable. I will continue to send accurate signals at the opening of the market every day—don’t miss out.
