symmetrical triangle pattern forming in BTC✅ 1. Measure the triangle height
A symmetrical triangle target =
Height of the widest part of the triangle → projected from breakout point
From your chart:
Top of triangle: ≈ 96,600 USDT
Bottom of triangle: ≈ 80,600 USDT
Height = 96,600 – 80,600 ≈ 16,000
So the measured move is ~$16,000.
📈 2. Bullish breakout target
Breakout area looks around 92,000–94,000 depending on how you anchor it.
Using 93,000 as midpoint breakout zone:
Bullish target = 93,000 + 16,000 = 109,000 USDT
Bullish target range:
➡️ 108,000 – 110,000 USDT
This lines up with the psychological 110K zone, which would likely create resistance.
📉 3. Bearish breakdown target
Breakdown would occur near 88,000–90,000 depending on exact slope.
Using ~89,000 as average:
Bearish target = 89,000 − 16,000 = 73,000 USDT
Bearish target range:
➡️ 72,000 – 74,000 USDT
This also lines up with the major liquidity zone around 72K–74K.
🎯 Final breakout targets
Bullish breakout target:
⭐ 108,000 – 110,000
Bearish breakdown target:
⭐ 72,000 – 74,000
X-indicator

XAUUSD Anaysis todayHello traders, this is a complete multiple timeframe analysis of this pair. We see could find significant trading opportunities as per analysis upon price action confirmation we may take this trade. Smash the like button if you find value in this analysis and drop a comment if you have any questions or let me know which pair to cover in my next analysis.

BTC Awaits a Liquidity Sweep Before Any Real RallyBitcoin on the H4 timeframe continues to hover inside a tight equilibrium band around 91,500–93,500, with price repeatedly tapping both edges of the range without showing directional commitment. The current movement suggests liquidity hunting rather than trend development, as every push toward 92,000 quickly gets absorbed.
Macro conditions still lean supportive thanks to the low-rate outlook, yet capital flows are favoring metals over crypto, leaving BTC with a muted recovery after the prior drop. Buyers remain cautious while sellers lose momentum, causing price to float above two demand/FVG layers at 89,500–90,500 and 86,500–88,000.
The scenario with the highest probability is a final liquidity flush. BTC may continue consolidating around 92,000–93,000 before sliding to 90,000 and dipping into the deeper FVG at 88,000–86,500. A clean reaction there would open room for the next impulsive leg upward.

XAU-USDFor today, the lower-timeframe gold has a divergence on the 15-minute chart 🕯
To confirm this, the line I marked needs to be broken, which is at the price of 4238 ⭕️
If this level is broken, there will be a sell signal 🚨🔽

T: Approaching the Buy ZoneThe dividend king AT&T is progressing with the intermediate wave C of primary wave 2. There is a lot of confluence support between $23 and $20. If that support box breaks, then $18 - $17 is another major cluster of support. Good thing about these boomer stocks is that they don't fluctuate that fast. It is relatively easier to manage stops and even something goes wrong, there is a hefty dividend to thank you for holding the bag. In the long term, the few remaining telecom stocks would be a great hedge against a meltdown related to the high-flying tech bro ones! I will be more than happy to put my pocket change towards buying each support zone for the next 3-6 months or so.

OVERVIEW MARKET XAUUSD #3 I 12/12📌 Market Context
Gold continues to maintain strong bullish momentum after a solid push from lower support levels. Price has now reached a short-term high and is trading near a high-liquidity zone, an area where the market typically shows consolidation or hesitation.
The overall trend remains bullish, supported by the rising trendline.
Key Volume Profile zones are still located much lower, indicating that price is currently trading in a premium zone — not ideal for initiating new buy positions at this level.
Buyers remain in control, but the current highs may trigger a corrective reaction before the next move develops.
📌 Price Scenarios
🔵 Scenario 1: Break Above the High → Bullish Continuation
If price completely breaks the current high with a strong H1 candle:
Nearest upside targets:
4,295
4,305
This scenario follows the trend, but the R:R will not be attractive for buyers entering at these elevated levels.
🔴 Scenario 2: Pullback into Volume Zones → Ideal Buy Opportunities
This is the main and safest scenario: If price fails to break the high and begins to retrace, potential buy zones include:
VAH zone: 4,221
POC zone: 4,200 – 4,206
VAL zone: 4,182 – 4,189
These Volume Profile zones previously generated strong bullish momentum, making them highly likely to produce a reaction or bounce.
🟡 Scenario 3: Trendline Break → Bullish Weakness
If price breaks below the rising trendline: The short-term trend turns weak.
Downside targets:
4,205
4,188
Potentially deeper to 4,170 if strong selling pressure occurs. This scenario only activates when buyers lose control.
📌 Summary
- Price is currently at the highs, making it unsuitable for new buy entries.
- Wait for a pullback into Volume Profile zones to secure better entries and improved R:R.
- The main trend remains bullish, so prioritize buying at support zones — avoid selling unless there is a very clear signal.
- Watch price behavior around VAH – POC – VAL for the safest entry confirmation.

Mastering MACD: A Complete Guide to Momentum🔵 Mastering MACD: A Complete Guide to Momentum, Trend Phases, Reversals & Professional Signals
Difficulty: 🐳🐳🐳🐳🐋 (Advanced)
This article goes far beyond simple MACD crossovers. You will learn where MACD comes from, why it was created, and how professionals use it to read momentum, trend phases, acceleration, deceleration, and early reversals.
🔵 THE ORIGINS OF MACD (A SHORT HISTORY)
The MACD (Moving Average Convergence Divergence) indicator was developed in the late 1970s by Gerald Appel , a technical analyst and investor.
At that time, traders relied heavily on moving averages to identify trends. While useful, moving averages alone could not explain one critical question:
Is momentum strengthening or weakening inside the trend?
Gerald Appel solved this by measuring the distance between two moving averages and tracking how that distance expands and contracts.
This simple idea allowed traders to:
Detect trend acceleration and deceleration
Spot momentum exhaustion before reversals
Combine trend direction and momentum in one tool
Later, in the 1980s, Thomas Aspray introduced the MACD histogram , making momentum pressure visible instead of hidden inside lines.
This transformed MACD from a crossover tool into a true momentum phase indicator .
MACD still works today because institutions, funds, and algorithms continue to rely on moving averages.
🔵 WHY MOST TRADERS MISUSE MACD
Most traders reduce MACD to one idea:
Buy when MACD crosses above the signal line
Sell when MACD crosses below the signal line
While MACD crossovers are frequently used to signal potential trend reversals, their effectiveness improves when they occur at extreme MACD levels, far above or below the zero line, where momentum exhaustion is more likely.
MACD is not a buy or sell button.
MACD is a momentum and trend phase analyzer .
To master MACD, you must understand:
Zero-line regimes
Histogram pressure
Momentum expansion and contraction
Divergences
Continuation behavior
Structure confirmation
Multi-timeframe alignment
MACD shows how momentum changes around trend, not where price will go next.
🔵 MACD STRUCTURE (WHAT IT IS REALLY MEASURING)
MACD consists of three components:
MACD line = difference between fast EMA and slow EMA
Signal line = smoothed average of MACD
Histogram = distance between MACD and signal line
Because of this construction, MACD measures the rate of change between trends .
Expanding MACD means momentum is accelerating.
Contracting MACD means momentum is fading.
🔵 ZERO-LINE REGIMES (TREND PHASE IDENTIFICATION)
The zero line is the most important level in MACD.
Bullish MACD Regime
MACD stays above zero
Pullbacks stall near zero
Histogram remains mostly positive
Bearish MACD Regime
MACD stays below zero
Rallies fail near zero
Histogram remains mostly negative
Professional rule: Trade in the direction of the zero-line regime. Ignore signals against it.
🔵 HISTOGRAM PRESSURE (THE REAL EDGE)
The histogram reveals momentum pressure before crossovers appear.
Expanding histogram = momentum acceleration
Contracting histogram = momentum deceleration
Below the zero line, higher histogram lows indicate weakening bearish momentum and a potential bullish shift
Above the zero line, lower histogram highs indicate fading bullish momentum and a potential bearish shift
Histogram turning points often precede:
Trend pauses
Pullbacks
Reversals
The histogram is the heartbeat of MACD.
🔵 MOMENTUM DIVERGENCES (EARLY WARNING SYSTEM)
Bearish Divergence
Price makes higher high
MACD or histogram makes lower high
Momentum weakens before price
Bullish Divergence
Price makes lower low
MACD or histogram makes higher low
Selling pressure fades
Divergences work best:
After extended trends
Near major structure levels
When histogram contracts sharply
🔵 MACD AS A TREND CONTINUATION TOOL
MACD excels at trading pullbacks in strong trends.
Bullish Continuation
MACD above zero
Histogram pulls back toward zero
Histogram turns positive again
Bearish Continuation
MACD below zero
Histogram retraces upward
Histogram turns negative again
This is the professional way to use MACD inside trends.
🔵 MACD + PRICE STRUCTURE CONFLUENCE
MACD becomes powerful when aligned with structure.
Higher highs + rising MACD = healthy trend
Higher highs + flat MACD = weakening momentum
Break of structure + MACD zero-line flip = regime change
Structure retest + histogram expansion = high-probability entry
MACD filters false breakouts by revealing momentum behind price.
🔵 MULTI-TIMEFRAME MACD ALIGNMENT
Professional rule:
Lower timeframe setups must align with higher timeframe MACD regime.
HTF MACD above zero = long-only bias
HTF MACD below zero = short-only bias
HTF histogram expanding = trend acceleration
This alignment significantly improves consistency.
🔵 EXAMPLE TRADING FRAMEWORK
Bullish Setup Checklist
MACD above zero
Histogram contracts then expands
Price forms higher low
Bearish Setup Checklist
MACD below zero
Histogram retraces then expands negatively
Price forms lower high
🔵 COMMON MACD MISTAKES
Trading every crossover blindly
Ignoring zero-line regime
Using MACD without structure context
Overreacting to small histogram changes
Treating MACD as a prediction tool
🔵 CONCLUSION
MACD is not a simple crossover indicator. When mastered, it becomes a complete framework for:
Reading momentum strength
Identifying trend phases
Detecting exhaustion early
Trading continuation setups
Confirming structure shifts
Aligning multi-timeframe bias
MACD does not predict price.
It reveals how momentum evolves around trend.
How do you use MACD? Histogram pressure, zero-line regimes, or divergences? Share your approach below.

USD/JPY overall market viewAs you can see from the chart the upward trend on the 4H which was since mid Oct till now is getting weaker, on the chart it will show the sell and buy zones as well... Feel free to reach out to me if you need extra clarification or help

Gold Pushing Higher? Key Levels in SightThis chart shows gold steadily climbing along an upward curve, with momentum picking up after a rounded-bottom pattern. Price is now heading toward two marked targets around 4333 and 4379, suggesting the bullish trend may still have room to grow. (Not financial advice.)
Do you think gold can break above the first target zone, or will it pull back before moving higher?

Gold (XAUUSD) Technical & Fundamental Analysis
The recent Federal Reserve decision to cut rates by 25 bps combined with a natural-to-hawkish FOMC statement and Powell’s dovish press conference has created a unique dynamic in the markets. While the statement initially suggested caution, Powell’s tone opened the door for additional cuts in 2026, effectively removing the possibility of near-term hikes. This shift has fueled risk appetite, driving equities higher and simultaneously supporting precious metals as real yields decline.
Gold, traditionally sensitive to interest rate expectations, responded positively to this dovish tilt. Lower rates reduce the opportunity cost of holding non-yielding assets like gold, and Powell’s comments reinforced the bullish outlook for XAUUSD.
On the 4H chart, XAUUSD has broken out of a consolidation zone (highlighted in purple) and is now trading near 4,286, marking a strong bullish continuation. Key observations:
Breakout Confirmation: Price decisively cleared the upper boundary of the prior range, signaling strong momentum.
Trend Structure: The asset is respecting an ascending channel, with the breakout aligning with the channel’s midline trajectory.
All moving averages are sloping upward, confirming bullish bias.
Trading Strategy
Bullish Bias: The breakout and dovish macro backdrop favor long positions.
Entry Options:
Aggressive: On minor pullbacks toward 4,265 (previous resistance turned support).
Conservative: Wait for a confirmed break above 4,300 psychological level.
Targets:
First: 4,330
Second: 4,380–4,400

Bitcoin Approaches Key Resistance and Prepares for Its Next MoveHi everyone, Domic here!
This week, the market has provided enough support for Bitcoin to recover, but not enough of a catalyst for a true breakout. The Fed’s 0.25% rate cut continues to favor risk assets, yet investors remain cautious ahead of the December 16 Nonfarm Payrolls report. If labor data weakens, expectations for further rate cuts will rise — a direct tailwind for BTC. On the other hand, an overly strong report could trigger selling near dynamic resistance zones such as the EMA34.
On the news side, the crypto market is lacking major catalysts: no new ETFs, no sudden inflows, and no events on the scale of a halving. Because of that, BTC’s current recovery is driven more by technical factors than by news.
Technically, BTC has bounced from the 86,000–88,000 zone with a clear set of bullish signals: long lower wicks, improving volume, and solid absorption of selling pressure. Price is now testing the EMA34 around 93,846 — a level where BTC has been rejected multiple times since October. This is a crucial “checkpoint,” and if price closes above it on the daily chart, the trend structure will shift significantly. The next target would be the EMA89 near 101,023 — considered the final line of defense for the long-term downtrend. A breakout above EMA89 would almost confirm a new bullish cycle.
In the main scenario, I expect BTC to face mild rejection at the EMA34 and pull back to the 90,500–91,500 zone to gather liquidity before attempting another push. If buyers defend this area well, BTC could break above 94,000 and move toward 96,500 – 98,000 – 101,000, with 101,000 (EMA89) being the decisive level that would open the door to a true “acceleration phase.”

ETH-USDTEthereum has two scenarios here.
One is stabilization above 3190, which is a short-term support 💰💰
In this case, it could rise up to 3450 🔼🚨
This would be the bullish scenario.
The second scenario is a breakthrough and continuation of the correction below 3190,
which could lead to further decline down to 3036 🔽📣

Gold Just Paused at a Strange Level What is Coming Nex🔹 MARKET BRIEFING – XAU/USD (1H)
Market State:
– Price has broken out of the short-term consolidation, followed by a clean retest structure forming right at the breakout zone a classic continuation signal.
Key Levels from Chart:
– Entry Zone: around the retest area just above 4280–4286
– Stop Loss: 4262 – 4264
– Take Profit 1: 4317
– Take Profit 2: 4381
Next Move:
– As long as price holds above the SL zone and respects the breakout retest structure, XAU/USD is positioned for a continuation leg toward 4317, with potential extension toward 4381.

SOL-USDTIt exactly bounced back from yesterday's support around $129 that I had identified, and it grew about 8% 🚀📣
Currently, the short-term support for today is $135, which, if maintained, could allow it to rise up to $147 🔼💰
🔤🔤🔤

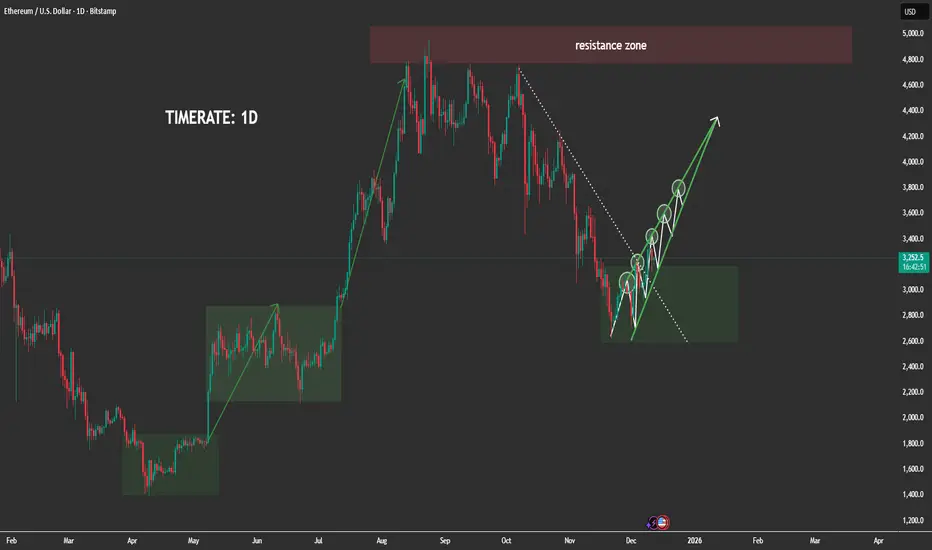
The ETH Move No Trader Is ExpectingETHEREUM 1D MARKET ANALYSIS
1. Current Price Structure
- ETH previously completed a strong bullish impulsive wave, breaking through multiple resistance levels before reaching the major 4,800–5,000 resistance zone, where the market formed a clear distribution top.
-After distribution, price entered a large corrective decline, following the descending dotted trendline visible on your chart.
-Recently, ETH has formed a broad accumulation block (highlighted in green), similar to the previous accumulation phases that triggered massive ETH rallies earlier in the year.
Inside this zone, ETH is now building a series of higher lows, showing early signs of bullish reconstruction.
-The current rising green structure indicates that price is forming a stair-step bullish pattern, preparing for a potential macro reversal.
2. Key Liquidity Zones
-Major Resistance Zone: 4,800–5,000
-This is the next major destination if ETH successfully completes the accumulation and transitions into expansion.
-Accumulation Block: 2,750–3,150
-This is where smart money is currently active — sweeping liquidity, trapping sellers, and accumulating long positions.
-Multiple liquidity grabs have already occurred inside this range, confirming strong institutional absorption.
-The current structure closely mirrors previous accumulation rectangles on the chart that led to massive bullish expansions.
3. Today's Market Scenario (1D Outlook)
Matches perfectly with the upward projection on your chart.
🔹 Main Scenario – Bullish Continuation After Accumulation
ETH is likely to follow this sequence:
-Continue building higher lows inside the accumulation block.
-Retest the inner structure trendline without breaking the macro zone.
-Form a clean break above the descending dotted trendline — signaling a bullish structure shift.
-Retest the broken trendline to form the final higher low.
-Begin expansion to the next major liquidity magnets:
-Short-term targets: 3,600 → 3,800
-Mid-term continuation: 4,200 → 4,500
-Macro target: 4,800–5,000 resistance zone
This is fully aligned with the green arrow projection you drew.
4. Market Psychology
-Big players are actively accumulating within this wide range clear repeated liquidity sweeps prove institutional activity.
-Retail traders are losing positions during sudden spikes and false breakdowns, which is typical behavior during accumulation phases.
-The market is more likely preparing for a major trend reversal, not a continuation downward.
-The price behavior mirrors earlier patterns:
Accumulation → Trendline Break → HL Retest → Massive Expansion
-This repetition increases confidence in the bullish outlook.
5. Intraday Strategy Guidance (1D)
Given the macro accumulation:
-Avoid selling aggressively the probability is against sustained bearish continuation.
-Best opportunities come from buying dips inside the accumulation zone.
-Watch for liquidity sweeps below local lows to identify smart-money entries.
High-probability setups:
✔️ Strategy 1: Buy the Bottom of the Range
Entry zones: 2,750–3,150
Targets: 3,600 → 3,800
✔️ Strategy 2: Buy the Retest After Trendline Breakout
This is the cleanest and safest setup.
Targets: 4,200 → 4,500 → 4,800+
ETH is currently in the prime zone where large investors position themselves before a new bullish cycle.
XAUUSD | Gold Signal |Dec 12,2025The strategy is to continue the upward trend, using the 4265-4263 range as a base for buying on dips and expecting further gains.
#XAUUSD #GOLD
Buy positions entered at 4268-4263, and the price has now reached the 4280 area as expected. The next key level is to push towards the 4295-4300 range.

XAUUSD Aggressive Scalp Swing LongOANDA:XAUUSD XAU/USD – Aggressive Scalp/Swing Long (15m timeframe) – Updated Signal Entry Zone: 4,280 – 4,285 (buy limit or market if already bouncing)
Stop Loss: 4,274 (tight, just below today’s low – risk max 9–11$)
Take Profit Targets: TP1: 4,295 – 4,297 (quick scalp – 50–60% position)
TP2: 4,308 – 4,313 (main target – previous highs + upper red zone)
TP3: 4,325 – 4,330 (runner if we get strong follow-through)
Risk/Reward: 1:2 up to 1:5 depending on how many targets you let run Confluence & Reasoning (right now): Price just printed a strong bullish engulfing + pinbar reversal exactly at 4,280 demand
Holding the blue ascending trendline for the 4th time
Higher-timeframe daily trend still very bullish (Gold > 4,200 = structural bull)
Volume spike on the reversal candle
Risk events mostly priced in, safe-haven flows supporting
Execution tips: If you’re not in yet → buy the break & close above 4,288 for confirmation
Already in from 4,280–4,285 → move SL to breakeven now
Partial at 4,295–4,297, let the rest run with trailing stop
#Gold #XAUUSD #GoldTrading #XAUAnalysis #Commodities #DayTrading #SwingTrading #NotFinancialAdvice This is NOT financial advice. Trading involves high risk. Always use proper position sizing and manage your own risk.

XAUUSD Bullish Setup: Key Levels 4264 & 4300 in Focus. Analysis:
Gold is showing signs of renewed bullish momentum, supported by improving risk-on sentiment and strengthened by expectations that the Federal Reserve may cut rates twice in 2026. This macro backdrop continues to support upside pressure in precious metals.
On today’s chart, I’ve marked two important technical levels guiding the current bullish setup:
🟢 Key Support:
4264 – Primary support and the level where buyers are expected to remain active
🔺 Resistance Levels:
4300 – Immediate resistance; a clean break above this opens bullish continuation
4340 – Bullish target and next major upside zone
As long as gold remains above 4264, the market structure favors further upside. A breakout and sustained hold above 4300 would confirm bullish strength and likely drive price toward the 4340 target zone.
The current sentiment environment — with expectations of future Fed rate cuts — adds fundamental momentum to the technical bullish setup, increasing the probability of an extended rally.
📌 Bias: Bullish above 4264
📈 Breakout Confirmation: Close above 4300
🎯 Target: 4340
⚠️ Key Watch: Retest of 4264 for trend continuation
Regards: Chart Analyst Pro.
#Gold #XAUUSD #GoldAnalysis #GoldForecast #TechnicalAnalysis #PriceAction

BTCUSD 15m chart you shared (as of Dec 12, 2025):BTC/USDBITSTAMP:BTCUSD BTCUSD 15m chart you shared (as of Dec 12, 2025):BTC/USD – Potential Long Setup (15m timeframe)**
Entry Zone: 91,800 – 92,200 (current demand zone + lower boundary of the pink support area)
Stop Loss: 91,400 (below the recent swing low)
Take Profit Targets: TP1: 92,534 (recent high / supply zone)
TP2: 93,000 – 93,250 (upper resistance zone)
TP3: 94,000+ if momentum continues (trail stop)
Risk/Reward: ~1:2.5–1:4 depending on exact entry and target **Reasoning: Price is holding the key horizontal support (~92,000) after a sharp drop
Bullish trendline still intact from the lows
Higher-timeframe structure remains bullish (daily/4h uptrend)
Potential inverse head & shoulders forming on lower timeframes
Trade Management: Wait for bullish 15m/5m candle close + volume spike above 92,200 for confirmation
Scale in if price sweeps 91,800 liquidity and reverses strongly
Move SL to breakeven after +1.5R
#Bitcoin #BTCUSD #CryptoTrading #BTCAnalysis #Crypto #SwingTrading #NotFinancialAdvice
This is NOT financial advice. Trade at your own risk. Always do your own research and use proper risk management.


Liquidity grab short ideaCOINBASE:BTCUSD so I’m sure you can all see the giant ascending triangle on Bitcoin. In my statistics the only reliably relevant patterns that work on Bitcoin are descending triangles with a 68% hit rate. So with that in mind I’m already skeptical. It’s also not a secret that the weekly dmi is rising (volatility and momentum rising on indicators) while price is tanking. I’ve been trading this range and just recently we’ve gotten two equal highs above triangle where there’s definitely untapped liquidity. My plan is to sell my long above the equal highs and place a short on rejection tp 1 below last weeks lows at least.

My BSE Intraday Trade Setup 05 Dec 2025For All Intraday Lovers – Follow for Live Trade Setups & DM for Strategy Details
Today I explored a clean intraday opportunity in BSE Ltd using my BTR Auto Buy/Sell Signal System.
Here’s the complete breakdown of why this setup worked beautifully:
📌 Why I Chose BSE Today
✔ Perfect Intraday Volatility – Smooth swings, no wild spikes
✔ High-quality structure around demand & supply zones
✔ Works amazingly with algorithmic signals
⏱ Timeframe Used
➡️ 15-Minute Chart – My preferred timeframe for intraday traders
Stable… Reliable… Noise-free…
📊 Indicator Used
🚀 BTR Auto Buy/Sell Trend System
✔ Proven 70% win rate
✔ Generates clean Buy/Sell signals
✔ Non-repaint logic for stable intraday entries
🎯 Entry Logic
🔹 Enter ONLY when BTR generates a fresh Buy/Sell signal
🔹 Align with demand/supply zones for best accuracy
🔹 Today’s Buy came perfectly from the Demand Zone
🔹 Captured a smooth +30 points intraday move
🏁 Exit Strategy
🎯 Targets: 25 / 50 / 75 / 100 points
🛡 Stop Loss: Day Swing Low/High
(Keeping SL outside noise ensures high reliability)
📈 Today’s Live Example: BSE Trade – 15 Min Chart (05/12/2025)
✔ Demand Zone created
✔ BTR gave a clean Bullish Signal
✔ Entry triggered
✔ Smooth intraday uptrend
✔ Exit achieved with 30 points profit
Chart attached for full transparency.
⚡ Want More Live Intraday Setups?
💬 DM Me for BTR System access
📌 Follow for real-time setups & intraday guidance
Trade smart. Trade disciplined. Trade BTR.

XAU/USD | Gold smashes through the supply zone(READ THE CAPTION)Good morning folks, Amirali here.
As you can see, Gold smashed through the supply zone and it is now being traded in the 4270-4320 FVG zone.
I expect Gold to rise to 4320 level, and then a reaction before reaching the NDOG + LV of 4330 level. If Gold goes through this level, I expect to reach the bearish OB. Should it fail, a drop to FVG zone and consolidatiON there is expected.
