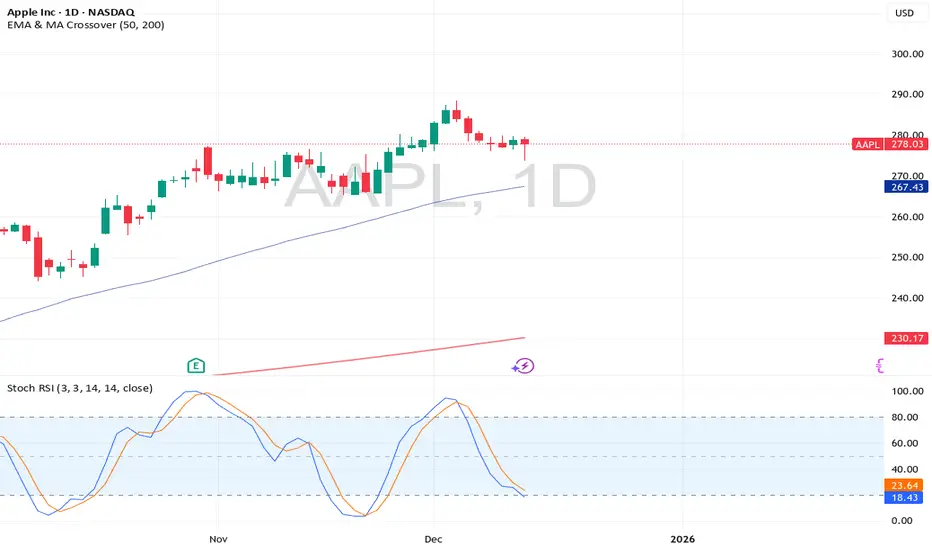
The #1 Reason Apple is in A Buy Position Still...Apple is still very much a very good stock to
buy my entry was yesterday...And i
was very scared of this entry
Because i thought it will gap up.
This is what didn't happen. Even though
am humbled to witness that there is still
time to catch Apple.
This is because if you look below you will notice
that the momentum in the trade is yet
to reverse itself or crossover .
So this is an early entry
Thats why i got whipsawed..Even though
am still positive in the position
If my eyes where glued to the screen during the market
open i would have sold my position
out of fear.
This is why you have to trust your trading system
no matter what.
Maybe i trust my trading system to
the point that i don't have to look at
the screen for at-least 24 hours.
If you can position your mind
in the place where you
don't have to look at your screen
for at-least 24 hours then you know
that you have found a powerful
trading system.
So remember the point is that
on this price action we are waiting for a reversal
on the momentum
it hasn't yet happened so if you
enter now.You will be trading
a position
So expect to get whipsawed and
calculate you risk management accordingly.
Trade safe.
Rocket Boost this content
to learn more
Disclaimer: Trading is risky please learn risk management
and profit taking strategies.
Also feel free to use a simulation
trading account before you trade with real money
X-indicator
25.12.12 Nasdaq AnalysisWelcome to Acid Trade.
Hello everyone, as of December 12th, 2025, I will be analyzing the Nasdaq chart today.
This is Acid.
15 Minute Chart Analysis
Let’s first review yesterday’s results.
In the previous video, I mentioned that a long position should be taken once the resistance trendline and the 25,566 level were broken.
That breakout occurred at the white circle, and from that entry, the market climbed approximately 152 points, resulting in a $3,000 profit.
For the short-side opportunity, the entry occurred when the rising trendline after the market opened was broken.
This sell signal appeared at the blue circle and led to a 186-point decline, giving a $3,720 profit.
Therefore, the total profit for December 11th was $6,720.
Daily Chart Analysis
Looking at yesterday’s candle (December 11), the price tapped the daily 20-EMA and bounced back, leaving a long lower wick.
Nasdaq is currently trading inside a previous volume zone, with the downside open toward 25,120 and potentially 24,945 if momentum continues lower.
Today’s Strategy
Today, Nasdaq temporarily broke below the short-term rising trendline, but this happened due to a pre-market gap-down, creating the yellow-box gap zone.
Because the sell-off was not strong and price action remains sideways, the market is effectively consolidating.
At the moment, Nasdaq is forming a larger box range:
Top: 25,879 forming a double top
Bottom: 25,400 forming a double bottom
A breakout from either side will likely determine the next major trend direction.
Today’s trading strategy should focus on identifying that breakout level and reacting once confirmation appears.
Conclusion
Nasdaq is moving within a key range between 25,879 and 25,400, and a breakout will define the next major trend direction.
Watch for a confirmed break with supporting volume before taking a position.
Today’s session is all about timing the breakout and reacting quickly.

USDJPY SellUSDJPY
Bias: Sell (pullback short)
Sell
Entry / Current Price: 155.70–155.80 zone
(sell on rejection / failure to break above)
Stop Loss: 156.05
→ 35 pips
Take Profit 1: 155.30
→ 40 pips
Take Profit 2: 154.95
→ 75 pips
Take Profit 3: 154.50
→ 120 pips
⸻
🧠 Reasoning (quick)
• Strong selloff earlier → current move looks like a retracement
• Price sitting under prior structure + liquidity zone
• JPY pairs often fake up before London continuation
• Clean R:R if rejection holds
⸻
⏱️ Estimated Time to TP1
• London open: ~30–90 minutes
• Tokyo continuation: could be slower (1–3 hours)
⸻
📊 Confidence Level
7.5 / 10
(Higher confidence if London fails to break above 155.80–156.00)

New Name, New Year, New War: Venezuelan invasion coming soon? The Trump administration has made its intentions toward Nicolás Maduro clear. Removing the Venezuelan president is a stated goal, but the path the administration is willing to take remains uncertain.
A former U.S. ambassador to Venezuela has described the deployment of American ground troops as a “last option”, but anything is possible with Trump and his newly named Department of War.
Washington has already seized a tanker carrying Venezuelan crude and is preparing to intercept additional shipments. Also, the U.S. has carried out more than twenty strikes on vessels it claims were involved in drug-smuggling operations. Each step raises the risk of a broader confrontation.
Metal markets might rally on escalation. Silver remains in a strong vertical trend. The move above 63 pushed price into fresh record territory before a modest pullback. Gold has broken through the recent range and printed a new swing high near $4,285 before pulling back.
Any significant development in Venezuela, such as a new seizure or a military operation, could trigger a higher open in metals when markets resume.

Price Action.No matter what indicator you used there is no point except for 20 EMA. As you see the price is going down below the 20 EMA. Just short it.

RSI Beta Test Access (Invite-Only)I’m opening a limited beta test for my upgraded RSI V2 indicator, built specifically for scalpers and intraday traders who want earlier confirmation and cleaner momentum reads.
If you’d like free access during the beta phase and can provide feedback, send me a DM here on TradingView and I’ll add you to the invite-only list.
This version will remain private while it’s being tested.
Thanks in advance to everyone who participates.

EURUSD Monthly Chart w/Out NoiseBias then look left for liquidity levels.
It’s why traders are stopped out up to 9/10 times.
What if there was another way?
Look at the monthly high in September the EURUSD makes.
Then, breakout long traders are taken out buying too high after such a big move already made.
Look left.
The liquidity zone is around the middle of those big candles.
See in Oct, Nov, and Dec price sweeps those big candles, that’s where the smart money is buying, lower, much lower.
Then a buying spree is complete and price is now topped to the brim with buy side liquidity making the next move up more possible.
My analogy, & the pilots amongst us might understand me,
Example 1,
when a big jet aircraft in emergency circumstances has to dump some fuel in order to complete its flight.
I have other examples but I’ll leave it there.
EURUSD has a strong path to 1.19 now. 30 minute chart shows the building blocks as it rejects 1.17 and lower.
* Trading is risky, brokers and market makers can easily manipulate price in the short term, not always in the negative “I’m out to get you way” we think, to balance orders and create sell liquidity when everyone is loaded on buying.”
Protects price and the asset.
* Then news can tip sentiment very quickly. This can be real news like a massive war starting or fake news to cause short term panic and gear, institutional greed but often it’s reasons stated above.
Look left at the previous candles, 4hr and above, yr Bias is right, but following bullish extended moves, if low lying liquidity exists, FVG’s, OB’s , price sweeps Lower to key support areas, and this ensures the maximum amount of liquidity it scoops up, dumping longs and then swooping on the new buy orders. It’s refueled and aims for recent high.

Are U.S. Dollar Bears getting exhausted?Still holding on to my EUR/USD short positions since late June/early July and it’s been quite a game of patience at this point but as I have been analyzing the U.S. Dollar for the past few months, from a purely technical analysis perspective, I’m currently still seeing the U.S. Dollar potentially carving out a bottom here and make a run to re-visit the 100 - 102 price zone.
I know markets are highly anticipating a Federal Reserve rate cute in September but with inflation still sticking around, it may not be such a sure thing just yet.
All eyeballs and ears will be on tap for Powell’s speech on Friday.
Technical analysis signals:
• Descending Broadening/Expanding Wedge (Bullish Pattern)
• MACD Histogram showing a sign of potential bearish exhaustion

$HUT HUT8 Q1 2026 forecastThis is mimicking the Jan 2025 rally almost perfectly, it would invalidate if it gets back above that resistance line.

Gold Intraday Trading Plan 12/12/2025Gold rose as expected from 4205 yesterday and reached 4285, breaking 4250 resistance. I am expecting it to retest 4250 again and rise from there. My first target is 4307, send target 4336, final target 4367

Eurjpy on the down fall lets go Monthly sellswe having the last drop of the month lets take it sample but it will payout huge

EURUSD H4 Buy area GoldBach Algo 1 Trending MarketEURUSD (H4)
Bias: Buy Zone
GoldBach Algo 1: Aligns with bullish trend
Market Condition: Trending upward
Good luck and trade safe!

Buy EUR/GBP at lower part of channel.The EUR/GBP pair has been drifting lower for nearly a month now trying to find support and a clear channel has been forming. The lower part of the channel also coincides with cluster support and just before 38.2% Fib retracement of previous move from May25. This is just a relief rally for the GBP and with fundamentals not looking good for the UK, eventually I believe the trend higher will continue. Now seems like a good time to buy in the coming week.
Buy Limit : 0.8702 lower channel
Stop : 0.8658 under 38.2% Fib retracement
Profit : 0.8768 before descending trendline
Risk 1 : 1.5 / Stop 44 pips


GOOGL | InformativeNASDAQ:GOOGL
Technical Summary
GOOGL is breaking down from a multi-week consolidation near the highs. The chart shows repeated failures to hold above the 314–316 resistance band and a clean rejection from the upper Keltner region. Price is now closing below the internal support level at 309–310, shifting the bias to a bearish continuation.
The volume profile shows a clear low-liquidity zone beneath current price, opening the door for a rapid move toward 299.66, followed by the Keltner lower band around 289.
Bearish Factors
1. Failure at Prior Highs
Price made a higher-high earlier but was unable to sustain any momentum. The recent candles show compression followed by a decisive bearish break, signaling the end of upward strength.
2. Breakdown Through 309–310 Support
The red line on your chart marks the bearish threshold. Today’s close sits below that area, confirming sellers have taken control. This level now becomes resistance.
3. Rejection at the Keltner Mid-Level
The mid-band around 316 acted as resistance several times. GOOGL failed to reclaim it even during strong sessions, showing loss of bullish momentum.
4. Volume Profile Gap
There is a thin volume pocket between 309 and the next major volume shelf at 299.66. Once price enters a low-volume region, continuation moves tend to accelerate until reaching the next high-volume area.
5. Trend Context
The structure has shifted from impulsive upward movement to sideways distribution, followed by a clean bearish break. Sellers are stepping in aggressively at upper levels and defending every retest.
Short Scenario
Breakdown Confirmation:
Bearish below 309–310, as long as price remains under this level on a daily close.
Targets:
• First target: 299.66 (primary volume node)
• Second target: 289 (Keltner lower band and major support cluster)
Invalidation:
A daily close back above 316, which would reclaim prior structure and negate the breakdown setup.
Outlook
GOOGL has transitioned from strength to distribution and is now breaking cleanly beneath support. If price remains below the 309–310 band, the chart favors continuation lower toward 299 and potentially 289.
If you want, I can also prepare the optimized TradingView headline for maximum visibility.

NZDCAD Great idea on zoneThe Dow Jones Industrial Average (DJIA) surged to a fresh record on Thursday as investors rotated out of pressured tech names and into stocks tied more closely to economic growth following the Federal Reserve’s (Fed) latest interest rate cut. Visa (V) helped lead the Dow higher after an analyst upgrade, while the S&P 500 hovered near flat and the Nasdaq slipped as traders digested a sharp pullback in major tech stocks.

VLO | Bearish Continuation | SHORTNYSE:VLO
Technical Summary
Valero (VLO) has shifted from a strong uptrend into a clear corrective downtrend. The chart now shows a completed lower-high and lower-low sequence, repeated failures to reclaim monthly structure, and a breakdown through the key support zone at 171–173.
Price is currently sitting inside a weakening demand area that has been tested multiple times. The most recent daily close shows sellers in full control, with no meaningful reaction from buyers.
Bearish Factors
1. Lower-High Structure
The uptrend has already transitioned into a downtrend. After the last swing high, price printed a clean lower high and failed to recover. This confirms a trend shift and favors continuation lower.
2. Breakdown of Support (171–173)
The 171–173 support has been tested several times. Each bounce became weaker, signaling demand exhaustion. The latest close below this zone indicates that former support is now behaving as resistance.
3. Rejection from the Keltner Basis
Price failed to hold above the Keltner mid-band near 175. This reinforces the bearish bias and suggests momentum is not strong enough to reclaim previous structure.
4. Volume Profile Gap Below
The volume profile shows a thin liquidity pocket from 170 down toward 163. When price enters these low-volume zones, continuation moves tend to be fast until the next high-volume node is reached. The next major value level aligns with the 161.87 zone.
5. Trend Context
The overall structure reflects distribution at the highs and increasing selling pressure. Until VLO can reclaim and close above the 175 area, the market favors continuation to the downside.
Short Scenario:
Breakdown Confirmation:
A daily close below 171 confirms continuation toward the value gap.
Targets:
• First target: 161.87 (major volume node)
• Secondary target: Keltner lower band near 163
Invalidation:
A daily close back above 175, reclaiming the Keltner basis and prior structure, invalidates the short thesis.
Outlook
VLO is displaying a textbook shift in trend from bullish to corrective, with weakening support and a clean liquidity pocket below. Unless price can reclaim key structure, the chart supports a move toward 162 over the coming sessions.

USDCHF Remains Range-Bound as Momentum WeakensUSDCHF continues to oscillate within a clearly defined horizontal range that has contained price action since mid-summer. The pair is once again pressing into the lower portion of this consolidation zone, following a sharp downswing that reflects renewed bearish pressure within the structure.
The broader trend context remains downward, with price trading below both the 50-day SMA and the 200-day SMA. The 50-day average has acted as dynamic resistance through most of the range, and the 200-day SMA continues to slope lower, reinforcing the longer-term bearish bias even as price fluctuates sideways in the near term.
Momentum indicators align with this softness. The MACD hovers near the zero line, showing weak directional conviction and minimal trend acceleration. The RSI has slipped toward the lower half of its range, suggesting that downside momentum is increasing but not yet stretched into oversold territory. Combined, these readings imply a lack of upward momentum as the pair tests the lower boundary of its multi-month box.
Overall, USDCHF remains in a neutral-to-bearish posture while contained inside its established range. How the market responds around the lower edge of this structure may determine whether consolidation continues or broader trend forces reassert themselves.
-MW

RKLB | Overextended Into Supply | SHORTNASDAQ:RKLB
Ticker: RKLB (Rocket Lab)
Timeframe: 1H
Bias: Short / Mean Reversion
Author: SHKSPR
Summary
RKLB just printed a parabolic leg straight into a major institutional supply zone, with the final candle closing outside the upper Keltner Channel. This is a statistically powerful signal for exhaustion and mean reversion. Volume profile confirms a thin liquidity pocket below, making the downside path clean.
This move is not sustainable without a pullback — and the chart is flashing a clear short.
Bearish Confluence:
1- Price Closed Outside Keltner Channel
RKLB broke beyond the upper KC band — a sign of volatility blowout and potential exhaustion.
Moves outside the channel historically revert back toward the median band.
2- Rejection From Supply (62.75–63.00)
The candle wicked into a well-defined supply zone:
Prior imbalance
Strong seller presence
Immediate rejection
Absorption at the top of the move
This is the exact area where smart money distributes.
3- Volume Profile: No Acceptance Above
The profile shows a thin volume region above the supply block.
Price briefly visited and got rejected instantly — signaling:
No willingness to build value above
Buyers are exhausted
Sellers are defending levels aggressively
4- Clean Targets Below
TP1: 61.87 — micro HVN + structural retest
TP2: 60.48 — Keltner median + volume shelf
A break below TP1 accelerates the drop.
5- Structure: Parabolic → Stall → Wick Reversal
Classic blowoff pattern:
Vertical expansion
Micro topping wick
Shift in momentum
High R/R short window
Market psychology: buyers trapped at the top, sellers preparing to unwind the move.
Trade Plan:
Short Zone: 62.75–63.00
Stops: Above 63.50 high
Targets:
TP1: 61.87
TP2: 60.48
Invalidation: 1H candle close above supply zone
Final Outlook
RKLB is extended, rejected from supply, out of volatility bounds, and sitting above a liquidity vacuum. Unless buyers reclaim and hold above the supply zone, the path of least resistance is down.
This is a high-probability mean-reversion short setup backed by structure, volatility, and volume profile.

Gold Extends Its Advance as Price Re-Approaches Major ResistanceThe chart shows Gold continuing to build on its broader uptrend, with price pressing back toward the well-defined resistance zone near 4,379 after several weeks of steady consolidation. Recent candles reflect renewed momentum, supported by both trend structure and indicator behavior.
Price remains firmly above the 50-day SMA, which has acted as dynamic support throughout the advance. The 200-day SMA is also trending higher and well below current price, reinforcing the longer-term bullish structure. A rising short-term trendline has guided the market from the November lows, and price is currently respecting this structure as it approaches the upper boundary of the range.
Momentum indicators show improving participation. The MACD has crossed back above its signal line, suggesting strengthening upside momentum after a cooldown phase. Meanwhile, the RSI is hovering near the upper portion of its range but remains below overbought territory, reflecting constructive momentum without immediate signs of exhaustion.
Overall, the technical landscape leans constructively bullish, with price retesting resistance while supported by rising averages and improving momentum. How price behaves around the 4,379 zone may determine whether consolidation continues or the prevailing trend resumes.
-MW

After Russell2000 Post-Tease Breakout, Crypto Bull Run FollowsSince Bitcoin's inception the Russell2000 (IWM) has mimicked a similar pattern involving a tease > dump > breakout with crypto always following suit into a new bull cycle. We all have noticed how most altcoins (such as LTC) didn't follow BTC in price action the past couple of years, but upon yesterday's IWM Breakout into price discovery, we should see altcoins (like LTC) (alongside all kinds of other speculative assets, cyclicals, commodities, etc.) follow suit. This set up suggests a crypto bull run starting now and likely ending within the next 6-12 months.

NXP
📈 1. TECHNICAL ANALYSIS
1.1 Long-term Trend & Channel Structure
Your chart shows a multi-year rising channel (2018–2025). Key observations:
• Price has respected this ascending channel for several years → long-term bullish structure.
• Current price is near the midline of the channel, not at extreme areas.
• The recent bounce from the lower mid-channel suggests buyers are active around 200–210 USD.
Conclusion:
As long as NXPI holds above 200–210, the long-term uptrend remains intact.
⸻
1.2 Moving Averages (EMA 9 / 50 / 200)
From the chart:
• EMA 9 is crossing above EMA 50 → bullish short-term momentum.
• Price is trading slightly above EMA 200, indicating a healthy medium-term trend.
Conclusion:
Momentum is shifting from neutral/bearish to positive.
⸻
1.3 RSI (14)
• RSI is currently near 60–65.
• It recently bounced from oversold levels near 30, showing strong reversal momentum.
Interpretation:
• RSI is not overbought yet, leaving room for additional upside.
• Bullish momentum is increasing.
⸻
1.4 MACD + RSI Combo Indicator
• MACD has formed a bullish crossover.
• Histogram is turning positive.
• Combined with RSI recovery, this supports a short-term bullish trend.
⸻
1.5 Key Support & Resistance Levels
Support zones
1. 210–215 USD → First important support
2. 195–200 USD → Strong structural support & lower band zone
Resistance zones
1. 235 USD → Immediate resistance
2. 255–260 USD → Strong historical resistance & upper channel area
3. 285–300 USD → Major top of long-term channel
⸻
📊 Technical Summary
Indicator Signal
Long-term trend Bullish (ascending channel)
EMA structure Bullish reversal forming
RSI Positive, not overbought
MACD Bullish crossover
Momentum Strengthening
Risk level Medium (price in middle of channel)
Overall technical outlook:
➡️ Bullish bias, but price is approaching a medium-term resistance zone around 235–255 USD.
⸻
🧠 2. FUNDAMENTAL ANALYSIS
Here is the latest macro-level fundamental overview for NXPI (NXP Semiconductors):
2.1 Business Overview
NXP is a major semiconductor company focused on:
• Automotive chips (ADAS, EV, infotainment)
• Industrial IoT
• Mobile & secure payment chips
• RF technologies
Automotive accounts for ~50% of revenue, making company performance closely tied to auto market trends.
⸻
2.2 Revenue & Earnings Outlook
Fundamentally:
• NXPI has strong cash flow and stable margins.
• Automotive semiconductor demand remains structurally high due to:
• EV transition
• Advanced driver-assistance systems
• Increasing chip content per vehicle
However:
• Industrial IoT demand has been soft recently.
• Some customers have been reducing excess chip inventory → short-term revenue pressure.
Overall, analysts expect moderate growth in 2025, driven mainly by automotive recovery.
⸻
2.3 Financial Strength
• Good free cash flow generation.
• Strong balance sheet.
• Aggressive share buyback programs.
• Maintains healthy profit margins compared to other semiconductor players.
Valuation:
NXPI is generally considered undervalued vs. premium peers like NVDA, AVGO, AMD, due to slower growth but higher stability.
⸻
2.4 Risks
• High exposure to automotive sector → cyclical.
• Global semiconductor supply-demand cycles.
• Competition increasing in MCU, automotive, and RF domains.
• Geopolitical risk (U.S.–China tensions).
⸻
✅ Combined Technical + Fundamental Outlook
Technical:
Momentum is improving, indicators turning bullish, long-term structure intact.
Fundamental:
Solid company with strong automotive demand drivers; moderate growth expected but stable cash generation.
Overall Bias:
Neutral-to-Bullish medium term
Bullish long term
⸻
⚠️ Disclaimer (as you requested):
This analysis is only my personal view based on the chart and publicly available information. I take no responsibility for any buy or sell decisions. Please do your own research or consult a financial advisor before making investment decisions.
⸻

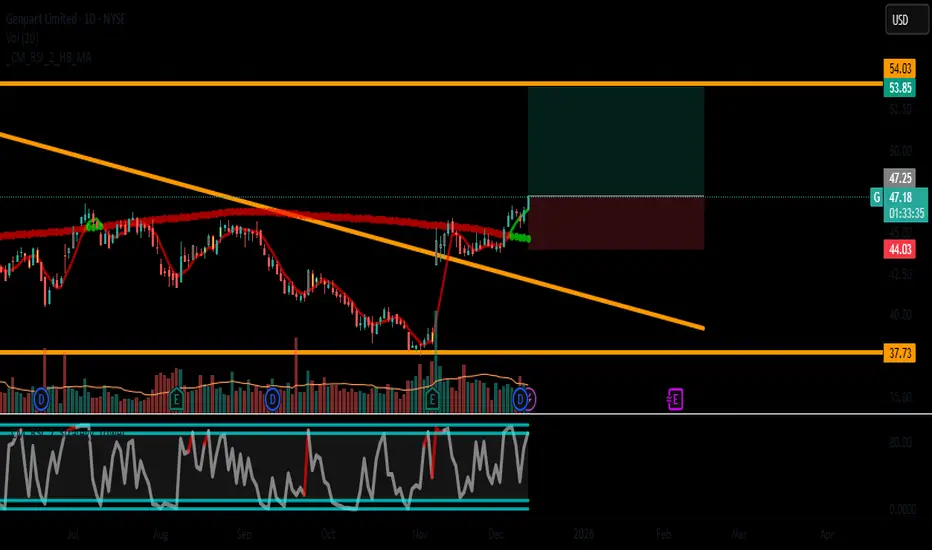
Genpact Limited- PERFECT CONVERGENCE TRADE SETUPTICKER: G (Genpact Limited)
TIMEFRAME: Daily + 4H + 1H (Rare Triple Alignment)
STRATEGY: Trend Continuation with Exceptional Fundamentals
📊 TECHNICAL ANALYSIS - TRIPLE BULLISH CONFIRMATION
MULTI-TIMEFRAME ALIGNMENT:
• DAILY: 🟢 BULLISH Trend, 🟢 BUY Signal
• 4HOUR: 🟢 BULLISH Trend, 🟢 BUY Signal
• 1HOUR: 🟢 BULLISH Trend, 🟢 BUY Signal
Rare perfect alignment across all timeframes
KEY LEVELS:
Current Price: ~$46.40
Immediate Target: $47.80 (Bollinger Upper Band)
Major Target: $53.51 (Fibonacci 161.8% Extension)
Critical Support: $44.00 (Strong Multi-Support Zone)
INDICATOR CONFIRMATION:
• RSI Daily: 70.7 (Strong momentum, NOT overbought)
• MACD: Bullish across all timeframes
• Bollinger Bands: Price riding upper band (strength)
• SMA Stack: Price > SMA20 > SMA50 (Perfect order)
• Volume: Consistent above average
CHART PATTERN:
Flag Pattern consolidation after breakout
Higher Highs & Higher Lows since September
Cup & Handle formation completing
💼 FUNDAMENTAL SUPERIORITY
EXCEPTIONAL SCORE: 10/10
text
• DEBT/Equity: 0.33 (Excellent balance sheet)
• P/E Ratio: 15.0 (Fair valuation)
• Interest Coverage: 7.7x (Strong solvency)
• Revenue Growth: +6.5% YoY
SECTOR ADVANTAGE:
Business Services sector outperforming
Digital Transformation tailwinds
Global BPO Leader - market position strength
INSTITUTIONAL SUPPORT:
88% institutional ownership
Recent analyst upgrades
Strong insider buying
🎯 TRADE PARAMETERS - HIGH PROBABILITY SETUP
ENTRY ZONE: $46.80 - $47.20
Ideal entry on slight pullback to trendline
STOP LOSS: $44.00 (-6.4%)
Below Daily SMA50
Below recent swing low
Below psychological $44 support
TAKE PROFIT: $53.51 (+13.8%)
161.8% Fibonacci extension
Measured move from flag pattern
Previous all-time high resistance
RISK/REWARD: 1:2.16 (Excellent)
📅 TIMEFRAME & POSITION MANAGEMENT
TRADE DURATION: 4-8 weeks
SMART POSITIONING:
STAGE 1 (50%): Entry at $47.00
STAGE 2 (30%): Add at $46.50 if retested
STAGE 3 (20%): Add on break above $48.50
PROFIT TAKING STRATEGY:
25% at $49.50 (Resistance break)
25% at $51.00 (Psychological level)
50% at $53.51 (Final target)
TRAILING STOP:
Breakeven at $48.00
Trail 8% after $50.00
Final stop at $49.50
⚠️ RISK MITIGATION
MONITOR THESE SIGNALS:
Daily RSI: Watch for divergence above 75
Volume: Should expand on breakout
Sector Rotation: Out of services into tech
Market Sentiment: Overall bullish bias needed
INVALIDATION CONDITIONS:
Daily close below $45.74 (immediate support)
RSI reversal with price making new highs
Volume dries up on upward moves
📈 PRICE SCENARIOS & PROBABILITIES
PRIMARY (75%): $53.51 Target Hit
Clean breakout, steady uptrend
Fundamentals continue to support
Sector remains favorable
SECONDARY (20%): $51.00 Partial Profit
Resistance at $51 holds initially
Consolidation before final push
Still profitable trade
MINOR (5%): Stop Loss Hit
Market correction or sector rotation
Unexpected fundamental news
Failed breakout scenario
🏆 WHY THIS IS A TOP-TIER TRADE
Rare Triple Alignment: All timeframes bullish
Fundamental Excellence: Perfect 10/10 score
Technical Precision: Clear levels, high probability
Risk Management: Favorable R/R ratio
Catalyst Ready: Sector tailwinds + institutional support
EDGE FACTORS:
No contradictory Connors signals
Low float stock with institutional accumulation
Consistent earnings growth history
Strong technical structure
📌 EXECUTION CHECKLIST
CONFIRM: Daily close above $46.50
CONFIRM: RSI maintaining above 65
CONFIRM: Volume > 1.2M shares
ENTRY: $47.00 zone
STOP: $44.00 (hard stop)
TARGET: $53.51 (scale out)
TRADE SIZE RECOMMENDATION: 3-4% portfolio allocation
CONFIDENCE LEVEL: 8.5/10
PATIENCE REQUIRED: Medium (weeks, not days)
Disclaimer: This analysis is for educational purposes. Past performance doesn't guarantee future results. Always conduct your own research and consult with a financial advisor.
✅ LIKE if you agree with this setup!
💬 COMMENT your take on G below!
🔔 FOLLOW for more high-probability trades!
🔄 SHARE with fellow traders!
#G #Genpact #Trading #Stocks #Investing #TechnicalAnalysis #FundamentalAnalysis #Breakout #TradingView #StockMarket