“Bitcoin / U.S. Dollar” (BTC/USD) on the 4‑hour timeframe from B1. Price Movement: The candlestick pattern indicates an ascending trend channel (blue lines) with a recent breakout above the upper channel line (circled area), suggesting bullish momentum.
2. Target Point: A red horizontal line marks a target at 95,919.5, implying the expected upside if the bullish move continues.
3. Support Zone: A red shaded rectangle highlights a demand zone between 85,755.8 and 88,210.8, acting as a key support level.
4. Green Rectangle: Represents a potential profit zone extending from approximately 88,210.8 to the target 95,919.5, indicating an expected price surge.
5. Current Price: BTC/USD is trading around 92,089 (as of 02:50:26), sitting above the support and aiming for the target.
6. Analysis Implication: The setup suggests a bullish continuation after the breakout, with traders likely watching for sustained movement above the channel to confirm the upward run toward the target, while keeping an eye on the support zone for any reversal🚀📈
X-indicator

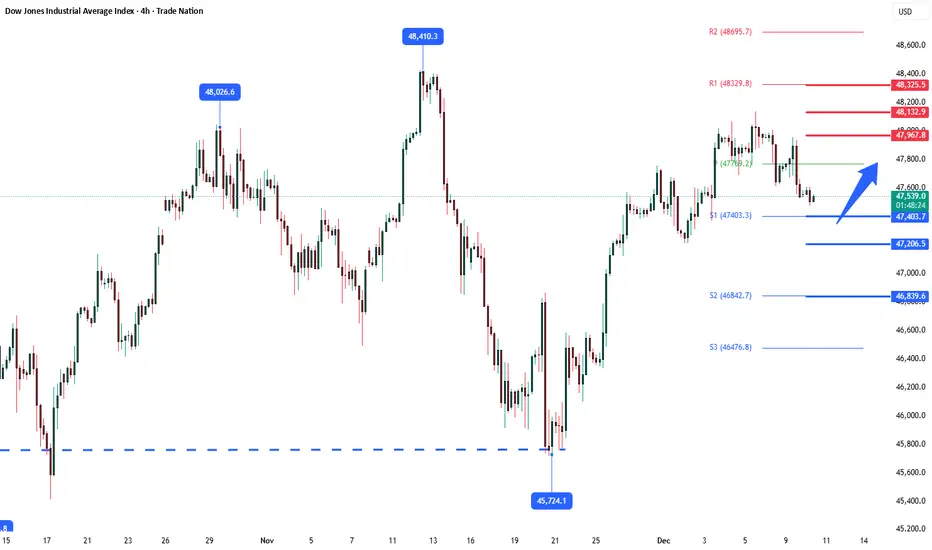
DowJones key trading levels ahead of FOMC rate decision Key Support and Resistance Levels
Resistance Level 1: 47967
Resistance Level 2: 48132
Resistance Level 3: 48325
Support Level 1: 47400
Support Level 2: 47200
Support Level 3: 46840
This communication is for informational purposes only and should not be viewed as any form of recommendation as to a particular course of action or as investment advice. It is not intended as an offer or solicitation for the purchase or sale of any financial instrument or as an official confirmation of any transaction. Opinions, estimates and assumptions expressed herein are made as of the date of this communication and are subject to change without notice. This communication has been prepared based upon information, including market prices, data and other information, believed to be reliable; however, Trade Nation does not warrant its completeness or accuracy. All market prices and market data contained in or attached to this communication are indicative and subject to change without notice.
Solana Buy Now 1 : 3 RRit's time for another spike on solana baaby , give it a full motion , higher high are confirming the bullish momentum

NSDQ100 wait-and-see mode ahead of tonight’s FOMCMarkets remained in wait-and-see mode ahead of tonight’s FOMC decision, keeping equity moves muted. The S&P 500 slipped -0.09%, with futures flat this morning, signalling no strong pre-Fed risk appetite for US equities, including tech.
Key Macro Drivers for NDX
US 10yr yields rose +2.4bps to a 3-month high, continuing the global bond selloff.
Higher yields remain a headwind for long-duration tech stocks, keeping upside in the NASDAQ capped.
Australia’s 10yr yield hit a late-2023 high, confirming that the global tightening in bond markets is still broad-based.
Elsewhere, Franco-German spreads tightened, offering limited relief for global risk sentiment.
Fed in Focus
Markets are pricing a ~90% probability of a 25bp Fed rate cut tonight, which would be the third consecutive cut since September.
Since the last meeting, unemployment has risen to 4.4%, reinforcing the case for near-term easing.
However, inflation concerns are creating deep policy divisions, meaning forward guidance for 2025 is likely to remain intentionally vague.
Powell is unlikely to clearly signal additional cuts, especially with succession uncertainty growing as Kevin Hassett is seen as a leading candidate to replace him.
Implications for NASDAQ 100
Near-term direction hinges on Powell’s tone, not the cut itself.
Dovish guidance → NDX upside via yields pullback.
Cautious / inflation-focused tone → further yield pressure and likely NDX consolidation or downside.
Until the press conference, NDX is likely to remain range-bound with headline-driven volatility tonight.
This communication is for informational purposes only and should not be viewed as any form of recommendation as to a particular course of action or as investment advice. It is not intended as an offer or solicitation for the purchase or sale of any financial instrument or as an official confirmation of any transaction. Opinions, estimates and assumptions expressed herein are made as of the date of this communication and are subject to change without notice. This communication has been prepared based upon information, including market prices, data and other information, believed to be reliable; however, Trade Nation does not warrant its completeness or accuracy. All market prices and market data contained in or attached to this communication are indicative and subject to change without notice.

TOTAL MARKET CAP. The total crypto market cap is still in a strong weekly uptrend, currently bouncing off the main ascending channel support and trading around the 3.1T area.
The price has respected the long-term ascending channel since 2023, and the recent correction from the 4T+ highs has so far held at the lower trendline and within the Ichimoku cloud, keeping the macro bullish structure intact.
Recent weekly candles show a rejection wick at the channel support, followed by a positive reaction, indicating that buyers are defending this zone rather than a complete breakdown occurring.
DYOR | NFA

Gold (XAU) — Short-Term Bearish Pressure Before Bullish ContinuaGold is showing signs of short-term downside pressure. I expect an initial decline into the 4100–4130 zone. However, if the Federal Reserve does not deliver the expected rate cuts and maintains higher levels for longer, there is a real possibility of an extended drop toward the 3940–4000 area before the market stabilizes.
Despite these short-term risks, the medium- and long-term outlook remains bullish. The current structure still reflects a healthy corrective move within a larger upward trend. Once liquidity is cleared below, I expect strong bullish continuation toward the 4600–4700 zone.
Higher-timeframe momentum still favors buyers, and the overall price behavior aligns more with institutional accumulation than with true trend exhaustion.
Drop your asset in the comments + hit the like button and I’ll prepare a custom analysis for you.
Stay patient and trade with precision.

Gold (XAU/USD) – Range Consolidation with Bullish Upside Target1. Market Structure
Range → Attempted Breakout:
Price has been moving in a broad consolidation / rising channel, with multiple rejections near the upper boundary.
Higher Lows, Weak Highs:
Buyers are defending higher lows, but sellers are still strong near resistance → this is compression, not a confirmed trend.
Bias: Neutral-to-bullish only if support holds.
---
2. Key Levels (Very Important)
🔴 Support Zone (Red Area)
4,170 – 4,163
This is a major demand zone.
Multiple candle wicks show aggressive buying here.
If this zone fails → structure breaks bearish.
✅ As long as price stays above 4,163, longs are still valid.
---
⚪ Current Price Area
Around 4,190–4,200
Price is sitting mid-range → not ideal for new entries unless confirmation appears.
---
🔵 Resistance / Target Zone
4,250 – 4,260
Clear range high + prior rejection zone
Marked as your TARGET POINT, which technically makes sense.
🚨 Expect selling pressure here on first touch.
---
3. Trade Idea Implied by the Chart
Bullish Scenario (Preferred)
Entry:
Rejection + bullish candle close above 4,170–4,180
Stop Loss:
Below 4,160
Target:
4,250–4,260
✅ Risk–reward is solid only if entry is near support.
---
Bearish Scenario (Invalidation)
A strong 3H close below 4,160
That would:
Break the demand zone
Flip structure bearish
Open downside toward 4,120–4,100
---
4. What I’d Watch Next (Discipline Check)
✅ Bullish engulfing / strong rejection at support → okay to long
❌ Chasing price in the middle of the range → poor trade
🚨 Fake break above 4,250 without volume → likely reversal
---
Bottom Line
This is a range-based long setup, not a breakout yet.
Best trades are patience trades here.

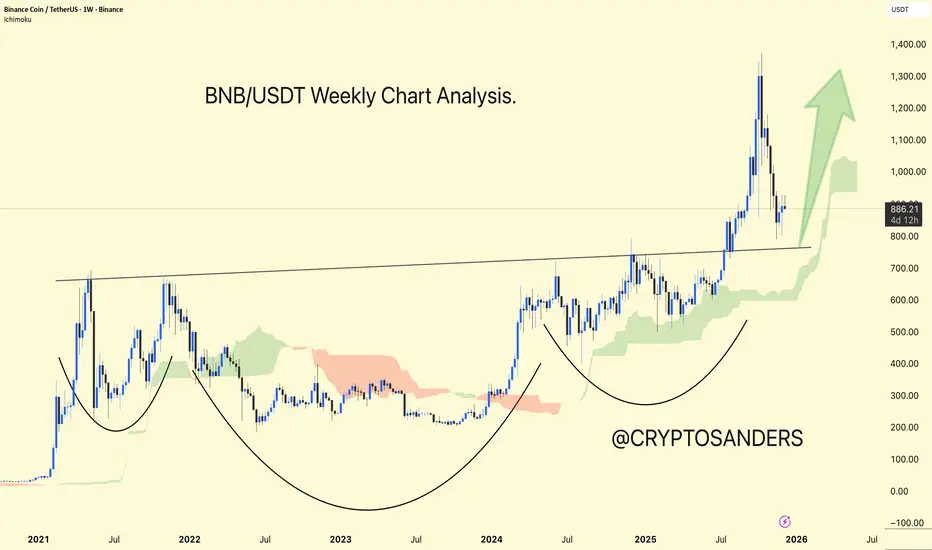
BNB/USDT Weekly Chart Analysis.BNB/USDT is trading in the range of 800 to 900 and remains within a larger bullish structure, but on higher timeframes, the price is still below a significant resistance band in the 1,160–1,180 zone.
Recent technical analysis indicates that BNB is trading above its key moving averages, with most indicators in "buy" territory, confirming the ongoing uptrend. However, some readings are approaching overbought levels.
On the chart, significant resistance is shown near 1,160–1,180 (the upper wedge boundary), while support is initially found around 1,095–1,100 and then at 1,050–1,020 if the wedge base is broken.
DYOR | NFA,
All-In-One Magnificent 7 — Market Strength Engine NQThe All-In-One Magnificent 7 indicator converts the combined percentage performance of AAPL, MSFT, AMZN, NVDA, TSLA, META, and GOOGL into a single market-strength signal.
It displays the composite trend, moving-average direction, acceleration icons, significant change markers, and bullish/bearish bias zones — giving a real-time read on mega-cap leadership.
This tool helps confirm directional bias for ES/MES, NQ/MNQ, SPX/QQQ, and intraday trades by showing whether the Magnificent 7 are strengthening, weakening, or accelerating.
Ideal for futures traders, options traders, and anyone using market breadth for confirmation.
This is for educational purposes only. Not financial advice.

Possible long on GUSell side liquidity taken in order to force a break of structure.
this Stop Hunt gives a blueprint of where instituitions entered the market after collecting sell order and stop losses on buys(sell side liquidity).
Using this knowledge i have set pedning buy orders targeting the last major high, analysis done using H4 and H2 timeframes

USDT dominance (USDT.D) USDT dominance (USDT.D) remains elevated and is in a major uptrend, indicating that a significant portion of crypto capital is still parked in stablecoins and in a risk-off position.
Current Structure:
USDT.D is around 5-6%, having broken above a long-term descending trendline that had capped dominance since 2022. This is typically a cautionary signal for risk assets when it remains above that breakout level.
From a technical perspective, USDT.D still appears to be in a large corrective pattern, with significant downside support around 4.2% and 3.8%; losing those levels would confirm a new downtrend in dominance and is usually accompanied by a strong rally in BTC and altcoins.
DYOR | NFA,

BTC: Liquidity Sweep SetupBTC: Liquidity Sweep Setup
Bitcoin continues to operate inside a broad equilibrium zone after completing a prolonged downward phase earlier in the month. The decline lost momentum as price entered a high-participation area, where trading activity became increasingly balanced and rotational. Since then, the market has developed a wide consolidation band, signaling a temporary standoff between directional conviction and liquidity accumulation.
Recent sessions show price repeatedly rotating through the center of this zone, forming alternating impulses that lack continuation. This pattern reflects a market focused on collecting orders rather than trending. Each short-lived push quickly transitions back into the range, indicating absorption on both sides and limited willingness from participants to sustain directional movement.
The lower portion of the range has begun attracting more activity, suggesting interest from larger players seeking efficient fill zones before any expansion. Price behaviour here is characterized by controlled sweeps, shallow recoveries, and frequent re-tests of the mid-band — signs of liquidity harvesting rather than aggressive distribution.
Forward behaviour on the chart implies that the market may first dip into the lower liquidity pocket to finalize order collection. Once this pocket is satisfied, conditions become favourable for a transition into an expansion phase targeting the upper boundary of the current equilibrium. This type of structure is common before major repricing, as it reflects the buildup of untriggered positions awaiting execution.
Overall, Bitcoin is in a preparation phase where energy is being stored, volatility is compressing, and liquidity is reorganizing. The next significant development is likely to emerge once the market completes its sweep of inefficient areas inside the range and finds a stable base for expansion.

Gold. This is what the opportunity setup looked like.Gold.
This is what the opportunity setup looked like way back in August of 2023.
Price was $1922. Now $4226. Over 120% higher.
There is no such opportunity now.

THE GREAT ROTATION: Forget $BTC, Watch $GDXJWhile the retail crowd is hyper-fixated on the flashing lights of CRYPTOCAP:BTC , NASDAQ:QQQ , and AMEX:SPY , a massive shift is happening in the shadows.
The "Easy Money" party in Tech and Crypto is getting crowded. The music is still playing, but the Smart Money is quietly grabbing their coats and heading for the exit.
Where are they going? They are rotating into the one sector that has been coiled, compressed, and ignored. The Destination: AMEX:GDXJ (Junior Gold Miners).
🧠 THE MACRO CHESS MOVE
Markets are a mechanism for transferring wealth from the impatient to the patient.
The Trap: Buying extended highs on CRYPTOCAP:BTC and NASDAQ:NVDA hoping for "one last pump."
The Opportunity: Buying the Divergence. Gold Spot ( AMEX:GLD ) is screaming at highs, but the Miners are lagging. This is a rubber band stretched to its breaking point. When it snaps back, the move isn't slow—it’s violent.
🔬 THE TECHNICAL BLUEPRINT (Daily Chart)
Forget the noise. Look at the structure.
1. THE COIL (The Setup) We are tracking a pristine Bullish Pennant formation. After an explosive rally from $90, price didn't crash—it hovered. This is institutional absorption. They are soaking up every share under $110.
2. THE LINE IN THE SAND (Support) $100 - $102. This is the fortress. As long as price holds this zone, the bulls are in total control.
3. THE IGNITION (The Trigger) $112. Mark this level. Alert it. Tattoo it. A daily close above $112 is the signal that the accumulation phase is over and the Markup Phase begins. This is "Blue Sky" territory.
🎯 THE PAYOFF (Scenario Mapping)
If the Capital Rotation kicks into high gear:
First Stop: $120 (The Psychological Barrier).
The Measured Move: $135+. This isn't a random number; it's the mathematical projection of the previous impulse leg.
🔥 THE VERDICT
The herd is looking Left ( CRYPTOCAP:BTC ). The Professionals are looking Right ( AMEX:GDXJ ). The chart is coiled. The macro winds are shifting. The rotation is real.
Don't watch the history books. Watch the charts.
⚠️ Disclaimer
This content is for educational and informational purposes only and does not constitute financial, investment, or trading advice. The author is not a licensed investment advisor or portfolio manager. Trading financial markets involves high risk. All decisions are made at your own discretion.
🚀 Follow us for more No-BS trade ideas & indicators AlphaRank

Breaking: Uranium Energy Corp. (UEC) Reports Earnings Today Uranium Energy Corp. (UEC) Reports Earnings today before market open . Uranium Energy Corp Reports Results for First Quarter of Fiscal 2026 and here is the highlight;
Maintained Low-Cost Production Profile: Achieved Total Cost per Pound(1) of $34.35, including Cash Cost per Pound(1) of $29.90 and Non-Cash Cost per Pound(1) of $4.45, based on production of 68,612 pounds of precipitated uranium and dried and drummed U3O8 (uranium concentrate) for the quarter.
Irigaray Plant Upgrades Completed: A full refurbishment of the yellowcake thickener and calciner to support 24/7 operations was finalized at the Irigaray Central Processing Plant ("CPP"). Drying and drumming operations have resumed, and approximately 49,000 pounds U3O8 were packaged between November 13-30, 2025.
Adding a Second Powder River Basin Satellite at Ludeman: Development decision made to advance the fully permitted Ludeman in-situ recovery ("ISR") Project's first planned wellfield. Engineering of the satellite ion-exchange ("IX") plant is progressing, and procurement of IX vessels is underway.
Technically, the stock is in a bullish flag pattern, increased momentum could lead to a move to the $20 resistant amidst bullish sentiment.
Analyst Summary
According to 5 analysts, the average rating for UEC stock is "Strong Buy." The 12-month stock price target is $15.8, which is an increase of 13.18% from the latest price.
About UEC
Uranium Energy Corp., together with its subsidiaries, engages in exploration, pre-extraction, extraction, and processing of uranium and titanium concentrates properties in the United States, Canada, and the Republic of Paraguay. The company was formerly known as Carlin Gold Inc. and changed its name to Uranium Energy Corp. in January 2005.

The euro bulls are gathering their strength.Technical Side: Critical Support Battle, Clear Bull-Bear Dividing Line
The current price of 1.16260 resides at multiple technical junctures, with well-defined levels guiding the short-term trend:
Key Support Zones (Layered & Resilient)
1.Immediate Strong Support: 1.1618–1.1625A confluence of the recent rally’s starting point and a psychological integer level, forming a robust near-term defense. Price consolidation around this range reflects balanced buying interest.
2.Secondary Support: 1.1585–1.1590Aligns with the daily Ichimoku Cloud base, a key dynamic support level in technical analysis. A break below this zone would weaken the bullish structure.
3.Critical Support: 1.1547A make-or-break level for the current uptrend — sustained below this level could trigger a deeper correction toward lower technical targets.
Core Resistance Zones (Concentrated Supply)
1.Primary Resistance: 1.1664The peak of a double-top pattern, where previous failed breakout attempts have left concentrated selling pressure.
2.Key Resistance: 1.1682A confluence of the Bollinger Bands upper band and the upper edge of the prior consolidation range, representing the threshold for a new bullish leg.
3.Upside Target: 1.1720–1.1750Clear rally space opens up if 1.1682 is breached with volume confirmation, as the resistance zone transforms into a new support base.
Indicator Signals (Mixed but Bullish Bias Intact)
- 4-hour Chart: Price remains firmly above the Bollinger Bands middle band, confirming the bullish-dominated structure has not reversed.
- 1-hour Chart: Stochastic oscillator is in the overbought zone (above 80), signaling short-term profit-taking may lead to mild consolidation or a shallow pullback.
- MACD: Red momentum bars are narrowing on the 4-hour timeframe, indicating bullish momentum is temporarily fading — caution is warranted for a potential "fake breakout" without fresh momentum.
EUR/USD trading strategy
buy:1.16200-1.16300
tp:1.16600-1.16800-1.17000
sl:1.15900

The Bitcoin bulls are gathering strength to launch an attack.Capital Flows: Mid-Tier Whales Absorb Supply, Optimized Selling Pressure Structure
The capital landscape exhibits a "hidden opportunities amid divergence" characteristic: While some mega-whales (holding >10,000 BTC) have recently sold Bitcoin to rotate into Ethereum, mid-tier whales (holding 100–1,000 BTC) have maintained consistent accumulation — absorbing the supply from large holders. Data shows this mid-tier cohort has increased holdings by 9% over six months, emerging as a critical market backstop.
On-chain metrics reveal that the $93,500–$98,500 range has absorbed 1.5 million BTC, forming a dense accumulation zone (chip peak) that provides fundamental support for future rallies. More importantly, leveraged capital has undergone large-scale deleveraging: Bitcoin futures open interest has declined from recent highs, eliminating volatility risks from excessive speculation. The current capital structure is increasingly healthy, clearing obstacles for bullish momentum to accelerate.
Bitcoin trading strategy
buy:91000-92000
tp:93000-94000-96000
sl:90000

Brent Crude downtrend continuation The Brent Crude continues to display a bearish outlook, in line with the prevailing downward trend. Recent price action suggests a corrective pullback, potentially setting up for another move lower if resistance holds.
Key Level: 6417
This zone, previously a consolidation area, now acts as a significant resistance level.
Bearish Scenario (rejection at 6417):
A failed test and rejection at 6417 would likely resume the bearish momentum.
Downside targets include:
6235 – Initial support
6177 – Intermediate support
6120 – Longer-term support level
Bullish Scenario (breakout above 6417):
A confirmed breakout and daily close above 6417 would invalidate the bearish setup.
In that case, potential upside resistance levels are:
6464 – First resistance
6530 – Further upside target
Conclusion
Brent Crude remains under bearish pressure, with the 6417 level acting as a key inflection point. As long as price remains below this level, the bias favours further downside. Traders should watch for price confirmation around that level to assess the next move.
This communication is for informational purposes only and should not be viewed as any form of recommendation as to a particular course of action or as investment advice. It is not intended as an offer or solicitation for the purchase or sale of any financial instrument or as an official confirmation of any transaction. Opinions, estimates and assumptions expressed herein are made as of the date of this communication and are subject to change without notice. This communication has been prepared based upon information, including market prices, data and other information, believed to be reliable; however, Trade Nation does not warrant its completeness or accuracy. All market prices and market data contained in or attached to this communication are indicative and subject to change without notice.

WTI Crude bearish below 5980The WTI Crude continues to display a bearish outlook, in line with the prevailing downward trend. Recent price action suggests a corrective pullback, potentially setting up for another move lower if resistance holds.
Key Level: 5980
This zone, previously a consolidation area, now acts as a significant resistance level.
Bearish Scenario (rejection at 5980):
A failed test and rejection at 5980 would likely resume the bearish momentum.
Downside targets include:
5796 – Initial support
5728 – Intermediate support
5667 – Longer-term support level
Bullish Scenario (breakout above 5980):
A confirmed breakout and daily close above 5980 would invalidate the bearish setup.
In that case, potential upside resistance levels are:
6025 – First resistance
6100 – Further upside target
Conclusion
WTI Crude remains under bearish pressure, with the 5980 level acting as a key inflection point. As long as price remains below this level, the bias favours further downside. Traders should watch for price confirmation around that level to assess the next move.
This communication is for informational purposes only and should not be viewed as any form of recommendation as to a particular course of action or as investment advice. It is not intended as an offer or solicitation for the purchase or sale of any financial instrument or as an official confirmation of any transaction. Opinions, estimates and assumptions expressed herein are made as of the date of this communication and are subject to change without notice. This communication has been prepared based upon information, including market prices, data and other information, believed to be reliable; however, Trade Nation does not warrant its completeness or accuracy. All market prices and market data contained in or attached to this communication are indicative and subject to change without notice.

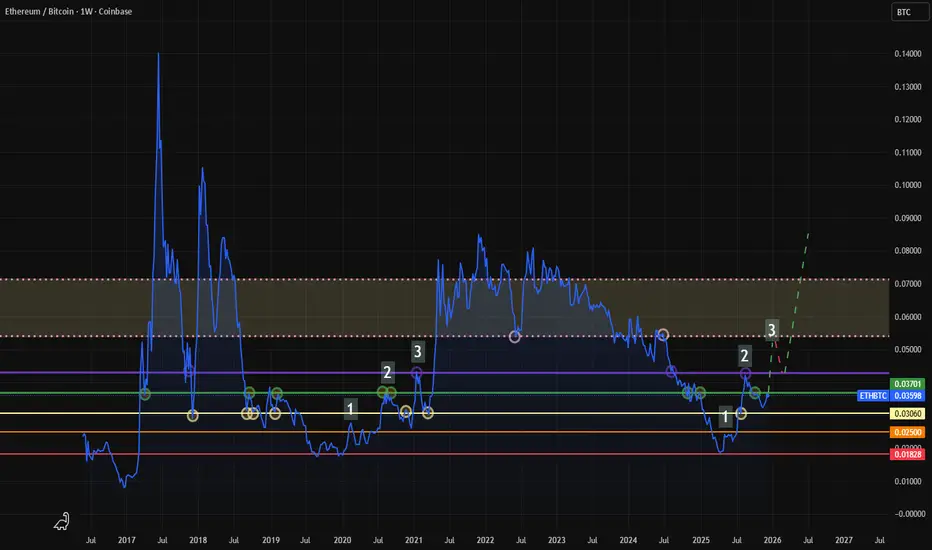
ETHBTC - HTF 3 Wave Buildup + Key Support & ResistanceMost important chart in crypto right now.
Be positioned before 0.043
Buy any dips after the Santa Rally down to current resistance 0.037
Distribute/TP within the shaded box area
The decline of gold is clear.Gold Short Strategy Analysis: Fundamental Weakness + Technical Bearishness, Downside Momentum Building
(I) Fundamental Side: Geopolitical Safe-Haven Failure, Short-Term Supply-Demand Imbalance
Geopolitical support for gold has completely collapsed: Events such as the Japan earthquake and border clashes between Cambodia and Thailand failed to trigger effective safe-haven buying. The market’s sensitivity to geopolitical risks has significantly declined, and coupled with progress in Gaza ceasefire negotiations, the geopolitical risk premium has continued to unwind.
The supply-demand dynamic shows short-term imbalance:
Short-term jewelry demand has dropped 19% year-on-year, leaving investment demand as the dominant driver. However, the withdrawal of speculative capital is weighing on overall demand.
While Russia announced restrictions on gold bar exports starting in 2026, long-term supply tightening expectations are unable to offset near-term selling pressure.
(II) Technical Side: Triple Top Divergence + Resistance Pressure, Bearish Structure Formed
A "triple top divergence" has emerged on the daily chart: Gold prices fluctuate at highs, but the MACD green momentum bars are expanding, the KDJ indicator lines are diverging downward, and the 5-day moving average (MA5) and 10-day moving average (MA10) show signs of a death cross after converging — signaling clear short-term correction pressure.
On the 4-hour chart:
Gold prices pulled back after hitting resistance at $4,207, failing to break the short-term resistance of $4,210. The Bollinger Bands have contracted and tilted downward, matching the "breakdown pattern after weak rebound" technical setup.
Key Levels: Multi-Layered Resistance vs. Fragile Support
Resistance Zones (Reinforced Layer by Layer)
Immediate resistance: $4,210 (intraday rebound high + MA5 suppression);
Strong resistance: $4,218–$4,220 (previous high-volume trading zone), a level tested multiple times without a breakthrough. Yesterday’s rally to $4,218 was followed by a sharp pullback, validating its effectiveness;
Critical resistance: $4,230 (upper edge of recent consolidation range).
Support Zones (Breakdown Risks Loom)
Immediate support: $4,190. A break below this level will trigger accelerated declines toward $4,170 and $4,150.
Gold trading strategy
sell:4220-4210
tp:4200-4190-4170
sl:4230

FCPO - A high probably setupSince the last posting on November 25 2025, the market posed another interesting set up which infer a probable wave 3 developing to the upside if the reading is right.
The price movement displayed retracements and wave relationships are just to befitting to ignore. If this plays out to the guidelines in the principle of the wave theory, then we should expect some form of impulsive upside movement with a caveat below 3968.

XAIUSDT 1D#XAI is moving inside a falling wedge pattern on the daily chart. It has bounced off the support zone with strong volume and has reached the wedge resistance and the daily SMA50. It has been rejected on the first touch, which is normal. We believe it will break above them soon. If that happens, the potential targets are:
🎯 $0.0261
🎯 $0.0323
🎯 $0.0374
🎯 $0.0424
🎯 $0.0496
🎯 $0.0587
❌ Invalidation: a daily candle closing below the wedge.
⚠️ Always remember to use a tight stop-loss and maintain proper risk management.
