X-indicator

SPEL Bullish MomentumSPEL on PULL back, Strong bullish Momentum, Fib 0.6% level on reversal. Weekly support. Expected hit all time high.

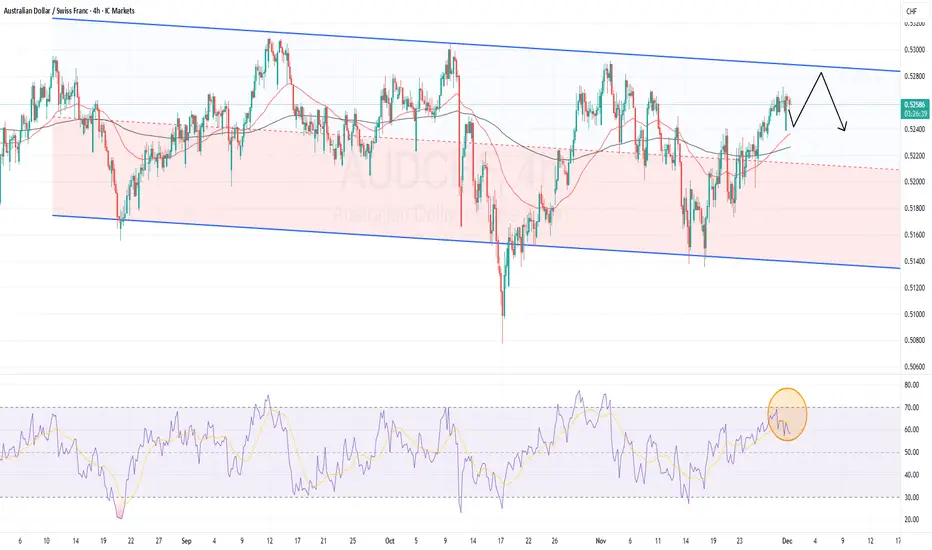
AUDCHF Sell Setup in the making
AUDCHF is forming a potential sell setup. The pair has been respecting the regression channel on the 4-hour chart for some time.
Price is currently trading near the upper boundary of this channel, showing consistent rejection in previous attempts to break higher.
This suggests that the market structure still favours selling pressure at the top of the channel.
However, the RSI is not yet in the overbought zone. This means that the momentum has not reached an exhaustion point. I would expect a final upward push before sellers gain stronger control. Waiting for this last move allows for a better entry and reduces the risk of entering too early.
A sell trigger becomes more reliable once price taps the resistance zone of the regression channel and RSI moves closer to overbought levels.
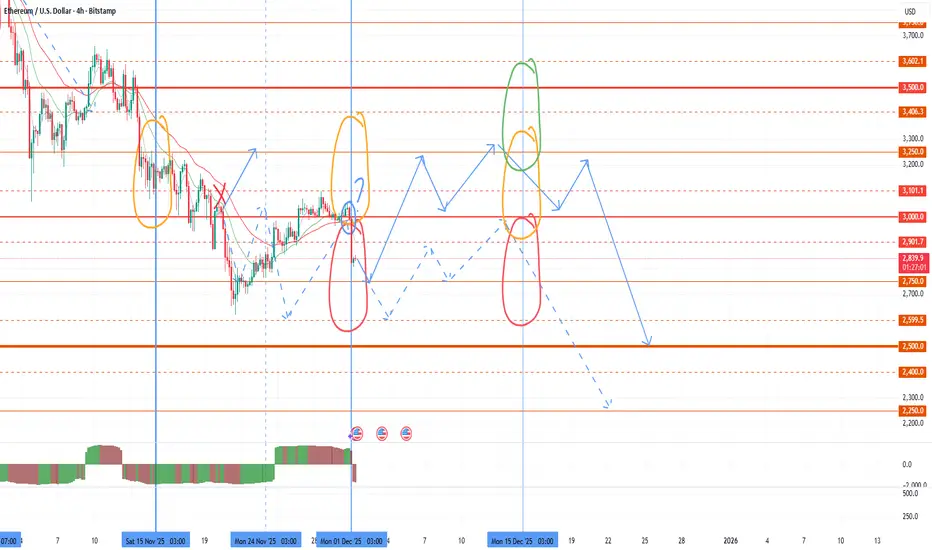
An Attempt at Seasonal Market Growth and BTC RollbackTo date, we have reached another bifurcation point in the market and it's time for another review. So far, there is a share of positivity in the market situation. As I wrote earlier, there is strong medium-term support for BTC in the 85-90k zone, from which a rollback is likely. Unfortunately, last month we broke through the 85k level, which is a signal for a possible test of 75k in the spring. However, the probability of a rollback from 85k to 90-100 still prevails. The broadcast opened the month ambiguously. According to Asian time, the opening is in the negative zone below 3000, higher in the neutral zone at GMT. I think the market will move this month based on the bullish BTC signal, and the coins will continue to move in different directions.
The seasonal growth period in the first half of December is also a positive signal. Once again, I would like to draw attention to the background trigger used by the United States to manipulate the market - brent oil. At the last bifurcation point, prices still collapsed, despite the positive data on US stocks, to which ETH immediately reacted with a consolidation below 3k, as I warned in the review. The current monthly candle opened above the interim support of $ 62.5, against which there is a signal for growth in the first half of the month at least.
As a result, we have signals for new growth waves for individual altcoins that have reached supports and have high growth goals, as part of seasonal growth, attempts to rollback BTC with oil and rollback according to the annual schedule. However, most of the alcoins, especially those with high capitalization or upcoming aggressive issuance, will not have time to show significant growth in this short period and will continue the medium-term bearish trend. Be careful with new purchases in the next couple of weeks. Today - tomorrow is the time when coins draw a shadow down the new monthly candle, but starting tomorrow evening or Wednesday, the probability of a reversal for individual coins will increase. If positive oil data is released in the middle of the week, then the growth of the crypt is likely to accelerate steadily by the end of the week, with a continuation in the next weekly candle. Next, the opening zone of the second half of the month will be of great importance.
For altcoins, in the event of a reversal attempt, the minimum target will be to overshoot the last monthly candle. For work today, I am considering the TURTLE NTRN ENSO VIC MITO BMT HOOK first of all. These tools were recently listed on binance, which reduces the threat of delisting hanging over projects from 20-22. The issue of these instruments is also smooth, which reduces the likelihood of further large drawdowns. Given today's circulating supply, these instruments are already in an oversold position and the likelihood of a reversal to growth at the slightest provocation from the market prevails. They also previously provided strong technical signals for growth up to 300%+, which will be worked out in the medium term.
Secondly, I am considering CHESS UTK COS DATA QUICK FIO for scalping, which can give new growth waves of up to 40-50% at least, but I recommend using a smaller position size for them. CHESS has been assigned the monitoring tag, but there are strong technical signals for a 0.1 retest, which is why a large exit pump is likely. After that, I will no longer consider using the token.
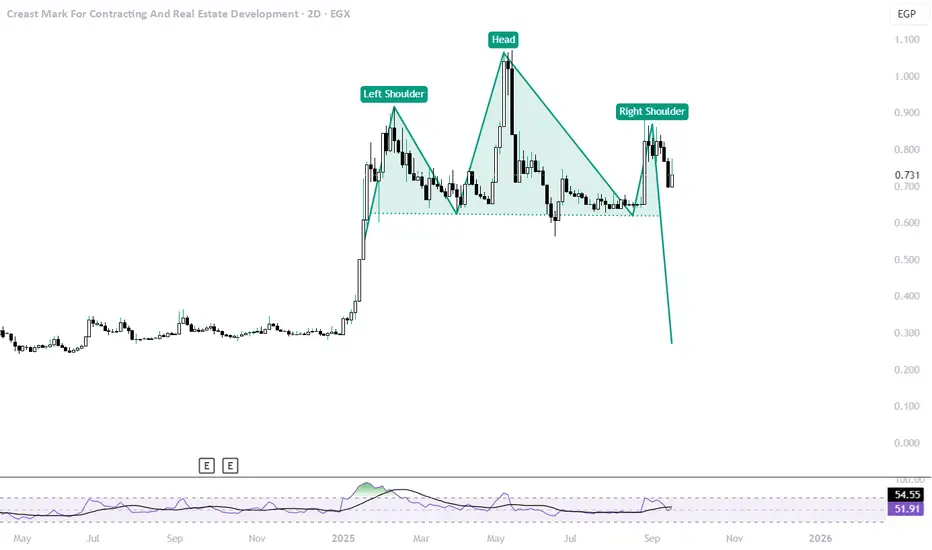
Bearish Pattern detected be carful !! Hello Traders,
first congrats for all the investors who bought this card early this year i believe they did 4x from the initial investment however right now its very clear with the news coming there is new investment coming as with selling pressure increasing plus the technical school with the head and shoulders patterns its very strong flag to GET out so they can secure the gains and buy again fresh after the storm end its my opinion and I'm not positive any more its time to RUN with the gains and wait after the end of this month good luck, unless we broke over the 0.9 level its a green flag again to go over the 1.1 and test it again from here i leave you with you own strategy good day
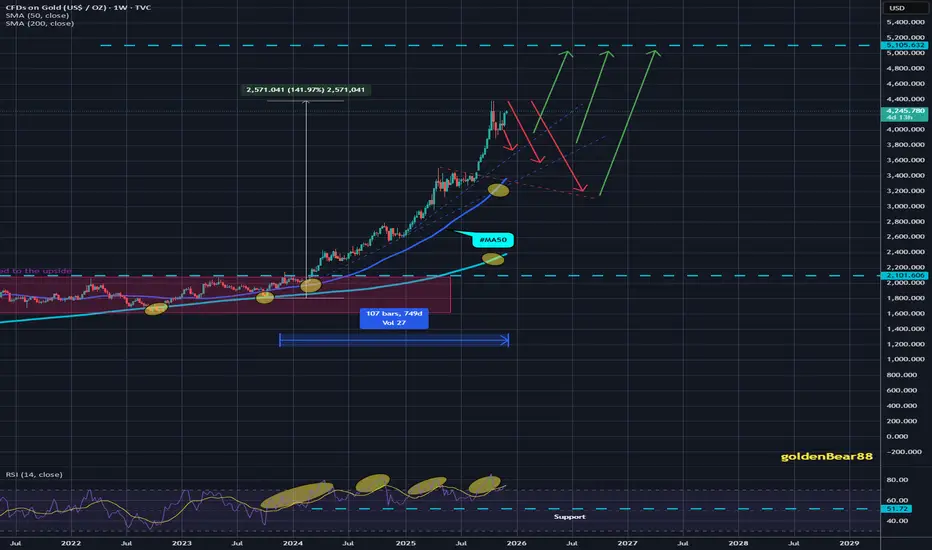
Gold Holds Near Channel High as Fed Cut Bets Weaken DollarGold trades around a six-week high near 4,250 as expectations of a December Fed rate cut and a softer dollar keep real yields under pressure.
Structural support comes from persistent central-bank buying, resilient investment demand, and constrained mine supply, according to recent World Gold Council data.
Technically, XAUUSD remains in a well-defined rising channel on the 1-hour chart, with the main scenario pointing toward 4,268–4,282 and potentially 4,298 if momentum persists.
Key support lies at 4,241 and 4,215; a break below this zone would open a corrective move back toward the channel midline near 4,200 in an alternative, lower-probability scenario.
Upcoming US data on manufacturing, spending, housing and the Fed’s Beige Book will shape the path of real yields and risk appetite, keeping gold sensitive to any surprise that challenges or reinforces the December cut narrative.
Read full article here:
erranteacademy.com

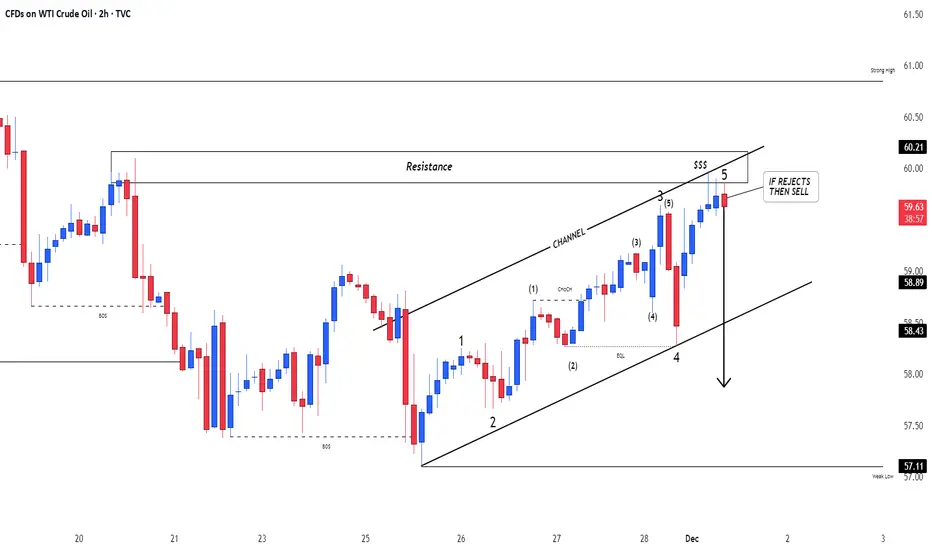
Crude OilU.S Oil
- Bullish Channel as an corrective pattern in Short Time Frame
- Resistance Level
- Change of Characteristics
- Completed " 12345 " Impulsive Waves
- Order Block
MARICO IS READY TO IGNITE A BULL FIRE!This is the daily timeframe chart of Marico.
The stock is approaching a strong support zone near the 700–710 level and resistance 780-790 and lop resistance near the 740-750.
If Marico sustains above this zone, it may potentially move towards higher price levels.
Thank you.


EURNZDPrice Action Trading is a method of financial market analysis where traders make buying and selling decisions solely based on the asset's price movements over time, without relying on technical indicators.
It's essentially the art of reading a "naked" or clean chart to understand the psychology and behavior of market participants.

TSLA daily bullish divergenceNASDAQ:TSLA is consolidating below all-time high resistance, suggesting a breakout is coming.
Wave (2) appears complete at the High Volume Node support and 0.5 Fibonacci retracement with a bullish structre flip.
📈 Daily RSI hit oversold with bullish divergence
👉 Continued downside has a target of the daily 200EMA $362
Safe trading

Crude Oil Breakout Alert - Bulls Taking Control!WTI Crude Oil (4H) – Technical Outlook
Price action is breaking out of a well-defined descending channel, indicating early signs of a potential trend reversal. The breakout is occurring near the 50-EMA, which is now acting as dynamic support. A successful retest of the channel’s upper boundary marked as the breakout setup would strengthen bullish confirmation.
If buyers hold above this level, upside momentum could extend toward the first target zone at $62.64, with further continuation possible toward $64.08. Failure to hold the breakout level may invalidate the bullish setup and pull price back into the channel.
Overall bias: Bullish upon confirmed retest.

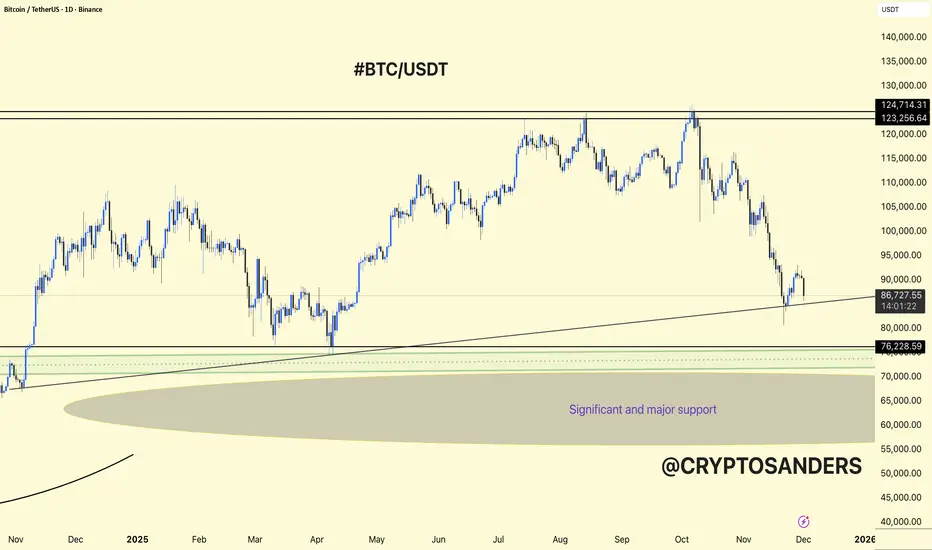
BTC/USDT 1DAY CHART UPDATE. BTCUSDT is in a corrective phase on the 1D chart, but it is still sitting above a major higher-timeframe support zone.
The chart shows a long-term ascending trendline from late 2024 to early 2025 that currently intersects just below the price, acting as dynamic support together with the horizontal 80k–82k area.
Below that, the wider “significant and major support” region lies roughly between 70k and 65k, which is the last strong demand block if 80k breaks.
Bullish case: Holding above the trendline and 80k–82k could form a higher low; from there BTCUSDT can attempt a recovery toward 95k–100k and eventually back to the 120k+ resistance, but it needs clear higher highs and higher lows on the daily to confirm.
Bearish case: A clean daily close below the trendline and 80k support opens room for a deeper flush into the 70k–65k major support zone, where a larger accumulation base may form before any new up‑leg.
DYOR | NFA
Polkadot Crashes to 2.00 – Breakdown Fully ConfirmedDOT just dropped -7.5% and is now sitting at 2.04, confirming a full structural breakdown. No bullish MSB in sight, and price continues setting lower lows.
RSI is deeply oversold at 24, but MACD still shows no reversal signal. Until bulls flip 2.60–2.80, this trend remains heavily bearish.
Momentum is dying fast. Breakdown is clean and active.
Bias: Bearish
Pair: DOT/USDT
Timeframe: 12H
This is not financial advice, only data analysis. Please consult a qualified financial professional for personalized guidance.

Hyperliquid Rejected at 36 – Bearish MSB Playing OutHLP rejected sharply from the 36–38 supply zone after a textbook MSB. Price is now approaching prior lows around 30 and still trending down.
RSI is below 40, and MACD momentum is accelerating downward. No signs of a bullish reversal — lower prices likely if 30 breaks.
This is a bearish continuation setup unless buyers step in soon.
Bias: Bearish
Pair: HLP/USDT
Timeframe: 12H
This is not financial advice, only data analysis. Please consult a qualified financial professional for personalized guidance.

SOL Bleeds Below 130 – Sellers Take Full ControlSolana broke down again, slicing through 130 support after repeated rejections from the 180–220 OB cluster. Structure is fully bearish with no bullish MSB to confirm a reversal.
RSI dropped to 36 and MACD just crossed back bearish. This chart screams continuation unless bulls pull off a fast reclaim of 140.
Momentum is fading hard. Expect lower prices if trend stays intact.
Bias: Bearish
Pair: SOL/USDT
Timeframe: 12H
This is not financial advice, only data analysis. Please consult a qualified financial professional for personalized guidance.

BTC: Continue Going LongAfter testing the resistance level of 92K, BTC declined again to build up momentum, waiting for the next upward movement. As I have mentioned multiple times, levels below 90K are suitable buying opportunities, and today we continue to go long on BTC.
BTC Trading Strategy for Today:
BTCUSDT buy@86000-87000
TP:90000-92000
All signals for consecutive long positions have been profitable. I will continue to send accurate signals at the opening of the market every day—don’t miss out.

Gold delivers my first Target of #4,252.80 markAs discussed throughout my Friday's session remark: 'My position: I have waited for Gold to deliver decent pullback and I found such on #4,185.80 Support test. I have engaged big Lot set of Buying orders (#4,177.80 Stop) and closed my orders on #4,202.80 extension. I will use this chance to congratulate Traders who followed my calls and had patience to hold the orders, well done / enjoy the Profits and have a great weekend!'
My position: I have made excellent Profits throughout Friday's session and spectacular Profits last night as Gold delivered #4,130.80 Gap, which I used and engaged #100 Lot Selling order there and closed on #4,118.80 delivering around #120k EUR Profits (remember every Gap has to be closed) and will not Trade for today's session anymore, very satisfied with Profits. On the contrary, I mentioned that #4,000.80 is and will represent Ultimate Bottom and 'floor' as I referred so if you Bought on #4,033.80 local Low's (then), you would be in excellent Profits by now as I expect #5,100.80 benchmark Price Target on Medium to Long-term on Gold. I have used #4,033.80 - #4,192.80 and utilized with engaging multi-Month Buying orders as I announced it many times on my recent ideas.
XAUUSD: Start Short-SellingAfter the opening today, gold continued to rise and broke through the key resistance level of 4250 again. Currently, the risk of continuing to go long outweighs the profit. It is expected that there will be an inertial decline, and it is recommended to attempt short-selling today.
Gold Trading Strategy for Today:
xauusd sell@4260-4270
tp:4220-4200
All signals for consecutive long positions have been profitable. I will continue to send accurate signals at the opening of the market every day—don’t miss out.

How International Finance Has Transformed1. From Gold Standard to Fiat and Floating Exchange Rates
One of the most significant transformations occurred in the 20th century when countries moved away from the gold standard, where currencies were directly linked to gold reserves. This system promoted stability but limited monetary flexibility. The shift began after the Great Depression and was finalized when the Bretton Woods system collapsed in 1971, allowing currencies to float freely.
This change reshaped international finance in several ways:
Exchange rate volatility increased, creating new risks and opportunities for global trade.
Central banks gained more power, using interest rates and monetary tools to manage inflation, growth, and currency values.
Currency markets expanded, eventually becoming the world’s largest financial market.
The transition to floating exchange rates allowed greater economic independence but also made global finance more complex and sensitive to geopolitical events, speculation, and macroeconomic trends.
2. Globalization and the Surge of Cross-Border Capital Flows
After World War II and especially since the 1980s, globalization accelerated dramatically. Countries reduced trade barriers, opened financial markets, and encouraged foreign investment. As a result:
Foreign direct investment (FDI) surged as multinational corporations expanded production worldwide.
Portfolio investments grew rapidly, with investors buying stocks, bonds, and derivatives across borders.
Developing economies gained access to global capital, enabling faster growth but also exposing them to external shocks.
Globalization made capital mobile and interconnected but also increased financial contagion risk, as seen in the Asian Financial Crisis (1997), Global Financial Crisis (2008), and the market turmoil during the COVID-19 pandemic.
3. The Rise of International Financial Institutions
International finance today is heavily shaped by global institutions such as:
International Monetary Fund (IMF) – monitors global stability, provides financial assistance, and stabilizes exchange rates.
World Bank – funds development and infrastructure projects.
Bank for International Settlements (BIS) – coordinates central bank policies.
World Trade Organization (WTO) – facilitates trade rules and dispute resolutions.
These institutions did not exist or had limited roles in earlier eras. Their expansion reflects the growing interdependence of nations and the need for coordinated financial governance.
4. Technological Revolution: Digital Payments, Trading, and Banking
Perhaps the most revolutionary transformation has come from technology.
a. Digital Banking and Payments
The rise of online banking, mobile wallets, payment gateways, and instant settlement systems (like UPI, SWIFT gpi, SEPA, and FedNow) has changed how money moves globally. Cross-border transactions that took days now occur within minutes.
Key changes include:
E-payments replacing cash
Fintech companies disrupting traditional banking
Blockchain and cryptocurrency innovations introducing decentralized finance (DeFi)
b. Algorithmic and High-Frequency Trading (HFT)
Financial markets today rely heavily on:
Algorithmic trading
Machine learning-based decision systems
Microsecond-level execution speeds
This has transformed global foreign exchange, commodity futures, and stock markets, increasing liquidity but also raising concerns about flash crashes and systemic risk.
c. Cryptocurrencies and Digital Assets
Bitcoin, Ethereum, stablecoins, and central bank digital currencies (CBDCs) have altered the landscape by introducing:
Decentralized value transfer
Smart contracts
New investment vehicles
Alternatives to traditional banking systems
Countries like China have advanced digital currency initiatives (e-CNY), while many central banks are exploring or piloting CBDCs.
5. The Emergence of Global Financial Hubs
Cities such as New York, London, Singapore, Hong Kong, Dubai, and Tokyo have evolved into major financial centers. Their growth is driven by:
Attractive regulatory environments
Large capital pools
Expertise in asset management, banking, and trading
Connectivity to international markets
These hubs influence currency flows, investment trends, and global economic policies.
6. Transformation of Trade Finance and Global Supply Chains
Modern international finance supports complex global supply chains that operate through:
Letters of credit
Trade credit insurance
Supply chain finance
Blockchain-based trade settlement
Supply chains now stretch across continents, linking producers, distributors, and consumers worldwide. As a result, disruptions like the pandemic, geopolitical tensions, or shipping bottlenecks significantly impact international finance.
7. Regulatory Evolution and Risk Management
After major global crises, regulations have become stricter and more sophisticated.
Major reforms include:
Basel I, II, and III – strengthening banking capital requirements.
Dodd-Frank Act (2010) – increasing transparency and oversight of derivatives.
IFRS standards – aligning international accounting practices.
Anti-money laundering (AML) and KYC rules – reducing illegal finance.
These regulations aim to prevent systemic failures while promoting stable and transparent financial markets.
8. Geopolitics and International Finance
International finance today is heavily shaped by geopolitical dynamics:
Key developments:
US-China trade war reshaped supply chains and investment flows.
Sanctions on countries (Russia, Iran, etc.) influence global energy and commodity markets.
Rise of bilateral currency trade (like yuan settlements) reduces reliance on the dollar.
Regional trade blocs (EU, ASEAN, USMCA) shape economic cooperation.
Finance has become an instrument of geopolitical influence, with currencies, sanctions, and capital controls used strategically.
9. The Dominance of the US Dollar and Challenges Ahead
The US dollar remains the world's primary reserve and trade currency, giving the U.S. significant financial influence. However:
China’s yuan
Euro
Cryptocurrencies
CBDCs
are emerging as competitors. The future may see a more multipolar currency system.
10. The Future of International Finance
International finance continues to evolve. Key trends include:
Wider adoption of CBDCs and blockchain-based settlements
Green finance and ESG investments
AI-driven financial analysis and risk management
More regional and local currency trade
Reorganization of supply chains for resilience
The next decade will likely bring a more digital, decentralized, and multipolar global financial architecture.

TSTUSDT 12H#TST is moving inside a falling wedge pattern on the 12H timeframe. Volume has increased, which is a good sign. In case of a breakout above the resistance cluster — consisting of the wedge resistance, the 12H SMA50, and the Ichimoku cloud — the potential targets are:
🎯 $0.01914
🎯 $0.02298
🎯 $0.02608
🎯 $0.02918
🎯 $0.03360
🎯 $0.03923
⚠️ Always remember to use a tight stop-loss and maintain proper risk management.

Inverted H&S Pattern: PAYTMA delight to buyers. The inverted H&S pattern has opened the target levels of 1810. This pattern indicates a strong reversal momentum, and it's crucial to pay close attention to the specific levels outlined throughout the analysis. Be sure to watch until the end, where I will provide a comprehensive breakdown of these levels, along with a well-defined exit strategy to maximize your potential gains.
