#PEOPLE/USDT Good moment for try to Buy PEOPLE
#PEOPLE
The price is moving in a descending channel on the 1-hour timeframe. It has reached the lower boundary and is heading towards a breakout, with a retest of the upper boundary expected.
We are seeing a bearish bias in the Relative Strength Index (RSI), which has reached near the lower boundary, and an upward bounce is expected.
There is a key support zone in green at 0.00965. The price has bounced from this level several times and is expected to bounce again.
We are seeing a trend towards stabilizing above the 100-period moving average, which we are approaching, supporting the upward trend.
Entry Price: 0.00985
First Target: 0.0999
Second Target: 0.01015
Third Target: 0.01035
Remember a simple principle: Money Management.
Place your stop-loss order below the green support zone.
For any questions, please leave a comment.
Thank you.
X-indicator

GBPCAD 9 Dec 2025Reasons for entering the trade:
1- The daily red Kumo was broken with a shadow (wick) and price reversed
2- 4H Bermuda Kumo and an untested/unsatisfied level
3- Break of the last 1H high/low structure
4- 1H price action (momentum/speed)
Entry: 1.84595
TP: 1.85283
SL: 1.84320

CAKE USDT SHORT TRADE SETUPNew Trade Setup: CAKE-USDT
SHORT
Entry: 2.2865 or CMP
Target: TP1: 2.2305, TP2: 2.1760, TP3: 2.1215, TP4: 2.067
Stoploss: 2.4113
Leverage: 1X
Technical Analysis: CAKE/USDT is finding the trendline resistance while in downtrend and with a high probability of moving up to test the next resistance level.

Invest Globally for Great Growth1. Why Invest Globally?
1. Diversification Beyond Local Risks
Every country faces its own economic cycles, policy changes, political uncertainties, and currency fluctuations. By investing globally, you spread your capital across different markets, reducing the risk that any one economy’s downturn will harm your overall portfolio. For example, if India or the US slows down, growth in Europe, Southeast Asia, or Latin America may balance the impact.
2. Access to Innovation Worldwide
No single country leads in every industry.
The US dominates technology and biotech.
Europe is strong in automation, renewable energy, and luxury goods.
China excels in manufacturing, EVs, and AI hardware.
Emerging markets lead in digital payments, mobile users, and consumption-led growth.
Global investing allows you to “own the best of the world.”
3. Capture Growth in Emerging Markets
Fast-growing countries like India, Vietnam, Indonesia, Brazil, and the Philippines grow faster than many developed nations. Rising incomes, urbanization, young populations, and new industries create high-growth opportunities that are unavailable in slow-growing economies.
4. Protection Against Currency Risk
A global portfolio naturally hedges currency exposure. When one currency depreciates, another may strengthen, which stabilizes your investment value in your home currency.
2. Key Global Asset Classes for Great Growth
1. Global Equities
Stocks provide the highest long-term returns among major asset classes. Global equity investing includes:
Developed Markets (US, UK, Japan, Germany)
Emerging Markets (India, China, Brazil, South Africa)
Frontier Markets (Vietnam, Nigeria, Bangladesh)
You may invest through:
Global index funds
Country-specific ETFs
International mutual funds
ADRs (American Depository Receipts)
The biggest advantage: exposure to global giants like Apple, NVIDIA, Samsung, Toyota, Nestlé, LVMH, and more.
2. Global ETFs
Exchange-Traded Funds provide diversified exposure at low cost. Popular categories include:
MSCI World ETF
MSCI Emerging Markets ETF
S&P 500 ETF
Global Tech ETF
Global Healthcare & Pharma ETF
Clean Energy ETF
ETFs allow you to invest in hundreds of companies across nations in one trade.
3. International Bonds
Bonds provide stability and income. Investing globally gives access to:
US Treasuries (most stable globally)
Eurozone bonds
Asian government bonds
Global corporate bonds
These act as ballast in a volatile portfolio.
4. Real Assets and REITs
You can invest in:
Global REITs
Infrastructure funds
Global commodity ETFs (gold, oil, metals)
These assets protect against inflation and provide diversification.
5. Alternative Global Investments
Venture capital funds
Private equity
Global hedge funds
International startups (via crowdfunding platforms in some regions)
These offer high potential returns but also higher risk.
3. Global Investing Strategies for Great Growth
1. Core–Satellite Strategy
Your portfolio is built in two layers:
Core (70–80%): diversified global index funds or ETFs (MSCI World, S&P 500, Global Emerging Markets).
Satellite (20–30%): high-growth sectors like AI, EVs, biotech, clean energy, robotics, or country-specific themes.
This balances stability with aggressive growth.
2. Thematic Global Investing
The world is driven by megatrends. High-growth themes include:
Artificial Intelligence
Electric Vehicles & Battery Technology
Green Energy & Climate Tech
Robotics & Automation
Digital Health & Genomics
Cybersecurity
Space Technology
Semiconductors
Investing in global thematic funds lets you catch long-term exponential trends.
3. Country Rotation Strategy
Different countries outperform at different times.
Examples:
US leads in technology
India leads in consumption & digital payments
China leads in EVs
Japan leads in robotics
Europe leads in luxury & renewable energy
Rotating positions across countries can capture high phases of growth.
4. Dollar-Cost Averaging (DCA) Globally
Investing fixed amounts regularly (monthly/quarterly) reduces timing risk and steadily builds global exposure.
5. Risk-Parity Global Allocation
Allocate based on risk, not just geography:
Stocks (global): 60%
Bonds (global): 20%
REITs: 10%
Commodities: 10%
This provides long-term balance across cycles.
4. Risks in Global Investing and How to Manage Them
1. Currency Risk
Foreign currencies fluctuate compared to your home currency.
Solution: Use hedged funds or diversify across many currencies.
2. Political & Regulatory Risk
Geopolitical tensions, sanctions, trade wars, and domestic policy changes impact returns.
Solution: Invest through diversified ETFs instead of concentrating in one high-risk nation.
3. Market Liquidity Risk
Some emerging markets have lower liquidity.
Solution: Prefer large, reputable ETFs and funds.
4. Overexposure to One Country
Many investors buy too many US tech stocks, ignoring Europe or Asia.
Solution: Maintain a balanced global mix.
5. Example of a Balanced Global Growth Portfolio
Aggressive Growth Portfolio Example:
40% US Equities (S&P 500 / Nasdaq)
20% India & Emerging Markets
20% Global Tech / AI / Semiconductor ETFs
10% Europe & Japan Equities
5% Global REITs
5% Gold or global commodities ETF
This mix taps into worldwide growth engines.
6. Benefits of Long-Term Global Investing
1. Higher Compounding Potential
When you own the fastest-growing companies globally, your wealth compounds at a higher pace.
2. Reduced Volatility
A global portfolio is more stable because downturns in one region are offset by growth in another.
3. Access to Worldwide Innovation
You can own stocks driving future revolutions—AI, space, clean tech, biotech.
4. Inflation Protection
Global assets usually hedge long-term inflation.
7. How to Start Investing Globally
Open an international brokerage account (e.g., Interactive Brokers, Webull, Vested, or your region’s global access broker).
Start with broad global ETFs.
Add specific regions (US, Europe, Japan, emerging markets).
Gradually include thematic funds.
Rebalance yearly.
Invest consistently.
Conclusion
Investing globally is one of the smartest ways to achieve great long-term growth. It lets you diversify across continents, participate in worldwide innovation, and capture opportunities unavailable in your home market. A well-structured global portfolio combines stability, growth, and resilience, ensuring your wealth compounds over decades.
Whether you are a beginner or an experienced investor, the world is now open to you. Start small, remain consistent, stay diversified, and allow global compounding to work in your favor.

US Federal Reserve Policy and Global Interest Rates1. What Is the Federal Reserve’s Monetary Policy?
The Fed’s primary goals, set by Congress, are:
Price stability (keeping inflation in control)
Maximum employment
Moderate long-term interest rates
To achieve these goals, the Fed uses policy tools such as:
Federal Funds Rate (short-term interest rate at which banks lend to each other)
Open Market Operations (buying or selling government securities)
Quantitative Easing (QE) (large-scale bond purchases)
Quantitative Tightening (QT) (reducing bond holdings)
Forward Guidance (communicating expected future actions)
When inflation is high, the Fed raises interest rates. When growth slows or unemployment rises, it cuts interest rates.
Because the US dollar dominates global reserves, trade, and debt markets, these decisions extend far beyond American borders.
2. Why the Fed Influences Global Interest Rates
Several unique factors make Fed policy globally powerful:
a) The US Dollar as the World’s Reserve Currency
Around 60% of global foreign-exchange reserves are held in USD. Many commodities—including oil—are priced in dollars. Thus, changes in US interest rates influence global liquidity and trade.
b) Dollar-Denominated Debt
Many emerging economies, corporations, and banks borrow in dollars. When the Fed raises rates, it becomes costlier to repay these loans.
c) Global Capital Flows
US Treasury bonds are seen as the safest assets in the world. Higher US interest rates attract global investors toward US assets, draining capital from other countries.
d) Synchronization of Financial Cycles
When the Fed changes policy, other central banks often adjust their own rates to prevent currency volatility or capital flight.
These mechanisms explain why the Fed is sometimes referred to as the world’s central bank.
3. How Fed Rate Hikes Affect Global Interest Rates
When the Fed raises the Federal Funds Rate, the effects spread across the world in multiple ways.
a) Strengthening of the US Dollar
Higher US rates mean higher returns for investors holding US securities. As capital flows in, the dollar strengthens.
A stronger dollar puts pressure on other currencies, particularly in emerging markets such as India, Brazil, or Indonesia. Their central banks may raise local interest rates to defend their currency, control inflation, or stabilize capital flows.
b) Rising Global Borrowing Costs
Because global finance heavily relies on USD:
Dollar loans become costlier.
International trade financing becomes expensive.
Countries with large external debt face repayment challenges.
This can trigger slowdowns in emerging markets.
c) Decline in Global Liquidity
When the Fed raises rates or conducts QT, it reduces the amount of money circulating globally. As a result:
Risky assets decline
Global stock markets fall
Investments shift from emerging markets to US Treasuries
Financial tightening spreads internationally even if local central banks do not change policy.
d) Pressure on Other Central Banks
To avoid currency depreciation or capital flight, central banks worldwide often follow the Fed by raising their own interest rates. This phenomenon is known as interest rate contagion.
Even strong economies like the EU, UK, and Japan face pressure to respond—although Japan often operates independently due to its unique monetary policies.
4. How Fed Rate Cuts Impact the World
When the Fed cuts interest rates, the international effects reverse.
a) Weaker Dollar and Stronger Global Currencies
Lower US yields reduce the attractiveness of dollar assets. Investors move money to faster-growing markets, causing the dollar to weaken.
Emerging market currencies strengthen, reducing inflationary pressures.
b) Increase in Global Liquidity
Lower US rates inject more capital into the global system. This increases:
Stock market growth
Investment in emerging markets
Commodity demand
This environment often benefits economies seeking foreign investment.
c) Cheaper Dollar-Denominated Debt
Countries holding USD debt find repayments easier. Capital becomes accessible for expansion, infrastructure, and corporate investment.
d) Monetary Easing Worldwide
Lower Fed rates give other central banks room to cut their own rates without risking capital outflows or currency depreciation.
Thus, Fed easing stimulates global growth.
5. Case Studies Illustrating Fed Impact
a) 2008 Global Financial Crisis – QE Era
After the 2008 crisis, the Fed launched massive Quantitative Easing, buying trillions of dollars in bonds.
Effects included:
Record-low global interest rates
Huge capital flows to emerging markets
Commodity boom
Global stock market recovery
Central banks worldwide followed with their own easing programs.
b) 2013 Taper Tantrum
When the Fed hinted at reducing QE:
Bond yields spiked
Global markets fell
Currencies like INR, BRL, TRY depreciated sharply
EM central banks raised rates to defend currencies
This demonstrated how sensitive global markets are to Fed communication alone.
c) 2022–2023 Inflation Cycle – Rapid Rate Hikes
To control post-pandemic inflation, the Fed raised rates at the fastest pace in decades.
Consequences:
Dollar surged to multi-decade highs
Global interest rates rose
Many countries experienced currency depreciation
Debt burdens increased
Capital fled to US markets
This period highlights the Fed’s power over global monetary tightening.
6. Why Some Countries Are More Affected Than Others
Highly Affected Countries:
Emerging markets with high dollar-denominated debt
Nations heavily reliant on foreign investment
Economies with weaker currencies
Countries running current account deficits
Examples: Turkey, Argentina, India (moderate), Indonesia, Brazil.
Less Affected Countries:
Economies with strong reserves
Countries with low dollar exposure
Export-driven economies benefiting from a weak local currency
Examples: China (to some extent), Japan, Switzerland.
7. Fed Forward Guidance and Global Markets
Even before changing actual interest rates, the Fed influences global markets through forward guidance—signals about future policy.
Markets price in:
Rate hike expectations
Economic outlook
Inflation forecasts
This anticipation affects bond yields, stock markets, and currency valuations globally.
A single line from the Fed Chair can shift billions of dollars across borders within minutes.
8. The Bottom Line – Why Fed Policy Shapes the Global Economy
The Federal Reserve influences global interest rates because:
The US dollar anchors global finance.
Global trade and debt depend on USD.
Investors react instantly to US yields.
Other central banks adjust policy to protect stability.
Financial markets are highly interconnected.
In essence, Fed policy changes set off a chain reaction across global markets—impacting foreign exchange rates, capital flows, inflation, borrowing costs, and overall economic growth.
Conclusion
The Federal Reserve’s monetary policy is not just an American concern—it is a global variable. Whether raising, cutting, or maintaining interest rates, the Fed influences global economic conditions more than any other central bank on earth. Countries adapt their policies based on Fed decisions to protect currencies, control inflation, and maintain financial stability. As long as the US dollar remains the world’s dominant reserve currency, the Fed will continue to shape global interest rates and the broader financial landscape.
Institutions Impact Stability1. Understanding Institutions and Stability
Institutions are not just buildings or government departments. They include formal systems like courts, central banks, legislatures, regulators, and law-enforcement bodies, as well as informal norms such as cultural values, social trust, and community expectations. Stability, on the other hand, means a condition where economic, political, and social systems operate smoothly without frequent shocks, conflicts, or disruptions.
Strong institutions create stability by:
Providing predictability
Reducing risk and uncertainty
Encouraging investment and innovation
Maintaining law and order
Ensuring fairness and accountability
Preventing fraud, corruption, and exploitation
Weak institutions produce the opposite: uncertainty, volatility, corruption, inequality, and conflict.
2. Political Institutions: The Foundation of Governance Stability
Political institutions include governments, parliaments, electoral systems, and administrative bodies. They shape how power is gained, exercised, and transferred.
Key Impacts on Stability:
a) Predictable Governance and Rule of Law
A stable political system enforces rules consistently. When laws apply equally to all—citizens, businesses, and politicians—confidence increases. Investors step forward, businesses expand, and citizens feel secure.
But when laws are arbitrary or frequently changed, societies experience unrest and economic stagnation.
b) Peaceful Power Transitions
Countries with strong electoral systems manage leadership changes smoothly. This reduces political shocks, coups, and civil unrest. Conversely, weak democratic mechanisms fuel instability, protests, and violence.
c) Reduced Corruption
Institutions like anti-corruption bureaus, independent media, and transparency laws help suppress misuse of power. Corruption erodes trust and creates social anger, which disrupts stability.
d) Effective Public Administration
Efficient bureaucracies ensure services like healthcare, education, infrastructure, and welfare programs reach people. When governments fail to deliver basic services, societies become vulnerable to crises and radicalization.
3. Economic Institutions: Ensuring Market Stability
Economic stability depends heavily on institutions like property rights frameworks, competition authorities, labour laws, taxation systems, and regulatory bodies.
a) Protection of Property Rights
When individuals and businesses are confident that their property, capital, and intellectual work will not be illegally taken or misused, they invest more. Secure property rights reduce uncertainty and support entrepreneurship.
b) Stable Regulatory Framework
Clear and consistent economic regulations prevent market manipulation and monopolistic practices. This protects consumers and ensures healthy competition, reducing economic volatility.
c) Sound Fiscal Policies
Institutions responsible for government budgeting and taxation maintain stability by controlling deficits, managing public debt, and preventing financial shocks. Mismanaged fiscal systems often lead to inflation, defaults, and economic collapse.
d) Labour and Employment Systems
Labour institutions—trade unions, employment laws, social security systems—balance the relationship between employers and workers. They protect workers from exploitation and ensure businesses retain flexibility.
4. Financial Institutions: Anchors of Economic and Market Stability
Financial institutions are the nerve centers of modern economies. They include central banks, commercial banks, securities markets, insurance regulators, and investment funds.
a) Central Banks: Guardians of Monetary Stability
A credible central bank ensures currency stability, controls inflation, and responds to financial crises. Predictable monetary policy boosts investor confidence and reduces economic shocks.
Weak central banks, on the other hand, create hyperinflation, currency collapse, and market panic.
b) Banking System Stability
Robust banking institutions maintain trust in the financial system. Strict regulations, risk-management standards, and deposit insurance prevent bank runs and protect savings.
c) Strong Capital Markets
Stock exchanges, bond markets, and mutual fund systems create liquidity and investment opportunities. Market regulators like SEBI, SEC, or FCA ensure transparency and prevent fraud, insider trading, and market manipulation—all essential for market stability.
d) Crisis-Management Institutions
Institutions such as financial-stability boards and resolution authorities help prevent systemic failures. They step in to support failing banks, restructure debt, and maintain market confidence during crises.
5. Legal Institutions: Protecting Rights and Ensuring Justice
The judiciary, law-enforcement agencies, arbitration systems, and dispute-resolution bodies form the core of legal institutions.
a) Contract Enforcement
A fair and efficient legal system enforces contracts reliably. Businesses operate smoothly when disputes are resolved quickly and justly, reducing uncertainty and transaction costs.
b) Human Rights Protection
Courts and constitutional bodies protect basic freedoms and prevent discrimination. A society with strong legal safeguards enjoys social stability because citizens feel protected from injustice.
c) Crime Control
Effective policing and law enforcement reduce crime, violence, and disorder. When legal institutions fail, societies experience insecurity, vigilantism, and social collapse.
6. Social Institutions: Strengthening Community and Cultural Stability
Social institutions include families, schools, religious organizations, community groups, media, and cultural norms.
a) Social Trust and Cohesion
Communities with high trust levels experience less crime, fewer conflicts, and stronger cooperation. Trust creates resilience during economic or political crises.
b) Education Systems
Educational institutions develop skilled individuals, reduce inequality, and support social mobility. A well-educated population is more productive and less vulnerable to manipulation or extremist ideologies.
c) Media and Information Institutions
Independent media promotes transparency, accountability, and informed citizenship. It exposes corruption and supports democratic stability. On the other hand, biased or captured media can spread misinformation, increasing polarization and instability.
7. Global Institutions and International Stability
Institutions like the IMF, World Bank, WTO, UN, and regional alliances promote global stability.
a) Financial Aid and Crisis Support
The IMF stabilizes currencies and helps countries overcome debt crises. The World Bank funds development, reducing poverty-related instability.
b) Trade Peace
WTO resolves trade disputes and ensures smooth global trade. Without such frameworks, global markets would face frequent conflicts and disruptions.
c) Peacekeeping Efforts
The UN and regional bodies prevent wars, mediate negotiations, and send peacekeeping forces to stabilize conflict zones.
These international institutions reduce systemic risk, promote cooperation, and maintain global economic and political stability.
8. How Institutional Weakness Leads to Instability
Weak or corrupt institutions cause:
High levels of corruption
Political turmoil
Currency devaluation
Investor flight
Poor economic growth
Civil unrest and riots
Social divisions and crime
Market collapses
Inefficient public services
Countries with weak institutions often experience recurring crises, regardless of their natural wealth or population size.
9. Conclusion: Institutions Are the Engines of Stability
Stability is not simply a product of strong leadership or economic growth; it is the result of robust, transparent, and accountable institutions that create order, protect rights, enforce laws, and support economic activity. From central banks to courts, from parliaments to schools, institutions shape the stability of nations.
Strong institutions create a cycle of:
Trust → Investment → Growth → Stability → Prosperity
Weak institutions generate the opposite:
Uncertainty → Corruption → Conflict → Instability → Decline
Therefore, the strength, credibility, and effectiveness of institutions are the single most important determinants of long-term stability in any society or economy.
Digital Dominates the Market & Old Methods Fall Behind1. Digital Transformation: Speed, Scalability, and Efficiency
Digital systems offer lightning-fast operations that traditional methods cannot match.
Where old systems depend on manual processes, paperwork, or physical presence, digital models operate instantly across the globe.
Speed
Transactions take seconds, from online banking to e-commerce checkout.
Supply chain decisions update in real time through sensors and AI dashboards.
Digital communication—emails, messaging, cloud collaboration—moves faster than traditional mail, memos, or in-person coordination.
Old methods, built on slower bureaucratic workflows, lose relevance when consumers and businesses expect instant outcomes.
Scalability
Digital platforms scale globally with minimal marginal cost.
A software company can serve millions without building new factories, whereas traditional businesses must invest heavily in infrastructure to grow.
This is why:
Digital streaming beats physical CDs and DVDs.
Online education reaches millions vs. classroom limits.
E-commerce expands without opening new stores.
Traditional models built around physical capacity struggle to expand at the same pace.
2. Data: The New Competitive Advantage
In the digital marketplace, data is the new oil—but more importantly, it becomes actionable instantly through analytics and AI.
How Digital Uses Data
Customer behavior tracking enhances precision marketing.
AI models predict demand, optimize pricing, and improve logistics.
Businesses personalize product recommendations—a feature impossible with old marketing tools.
Traditional methods like:
manual customer surveys,
limited market studies,
guess-based advertising,
cannot provide the accuracy or real-time insights needed for modern competition.
Because digital systems learn and adapt continuously, they grow more efficient over time, while old methods remain static.
3. Digital Consumer Behavior: Convenience Wins
Digital dominates markets because consumers have shifted online. Convenience is king.
What consumers now prefer:
Online shopping with home delivery
Digital payments over cash
OTT streaming over cable TV
Mobile banking over in-branch visits
Ride-hailing apps over traditional taxis
Food delivery apps over calling restaurants
Old methods fail because they require more effort, more time, and often more cost.
The demand for personalization
Algorithms tailor:
ads,
shopping experiences,
search results,
content recommendations.
Traditional one-size-fits-all approaches—newspapers, radio, physical catalogs—cannot match personalized digital experiences.
4. Automation and AI: Replacing Manual Workflows
Automation is a central reason digital dominates.
AI, machine learning, and robotic process automation reduce errors and costs while increasing throughput.
Digital automation examples:
Chatbots replacing customer service centers
AI underwriting replacing manual loan officers
Algorithmic trading outperforming human traders in speed
Robotic assembly lines increasing manufacturing efficiency
Smart warehouses with automated inventory systems
Old methods relying on manual labor or human-only operations lag because they are costly, slow, and prone to inconsistency.
5. Platform Economies Beat Traditional Business Models
Digital platforms like Amazon, Uber, Airbnb, and Google transformed markets by connecting millions of users through online ecosystems.
Advantages of digital platforms:
Zero inventory models (e.g., Uber owns no cars)
Low cost per additional user
Global user networks
Winner-take-all dynamics powered by data
Traditional industries with fixed assets, limited reach, and physical infrastructure cannot compete with the platform model’s efficiency.
6. Marketing: Digital Ads Crush Traditional Advertising
Advertising is one area where the shift is most obvious.
Digital marketing benefits:
performance tracking,
precise targeting,
retargeting,
demographic insights,
cost efficiency.
Platforms like Google Ads, Facebook Ads, and Instagram Reels allow businesses to reach exact audiences.
By contrast:
print ads,
billboards,
radio,
TV commercials
provide no precise data on who viewed or acted on the message.
Thus, traditional marketing budgets shrink every year as businesses migrate to digital channels.
7. Digital Finance & Payments Overtake Cash-Based Systems
FinTech has become one of the biggest disruptors.
Digital finance innovations such as:
UPI
e-wallets
algorithmic credit scoring
digital lending
automated KYC
blockchain transactions
are outcompeting traditional banking models.
Old cash-heavy methods or manual paperwork-based banking slow down transactions, increase risk, and limit accessibility.
Digital finance, being efficient, borderless, and transparent, dominates modern monetary flows.
8. E-Commerce and the Fall of Traditional Retail
E-commerce has redefined how people shop.
Digital advantages:
24/7 availability
more product variety
faster price comparison
personalized recommendations
doorstep delivery
easy returns and refunds
Traditional retail, despite offering physical experience, struggles with:
limited store hours,
higher operational costs,
smaller inventory,
regional restrictions.
Digital-first retailers with online-only models take the lead.
9. Remote Work & Cloud Systems Replace Traditional Office Models
The digital workplace has become dominant.
Digital tools:
Zoom, Google Meet
Slack, Teams
Cloud storage
Virtual project management tools
enable businesses to collaborate without needing physical offices.
Old workplaces requiring physical presence are falling behind due to:
higher real estate costs,
long commutes,
reduced flexibility.
Digital work increases productivity and widens talent pools globally.
10. Innovation Cycles: Digital Evolves Faster
Digital technology evolves at breakneck speed.
Every year brings:
faster processors,
smarter algorithms,
new apps,
improved networks,
enhanced automation.
Traditional industries, requiring physical upgrades, machinery, or labor restructuring, cannot update at the same pace.
Thus, over time, digital companies innovate exponentially while old industries evolve linearly—creating an ever-widening gap.
Conclusion: The Digital Wins Because It Is Faster, Smarter, Cheaper, Global
Digital methods dominate because they:
scale rapidly,
rely on data,
adapt through AI,
offer personalization,
reduce cost,
improve convenience,
operate globally with minimal friction.
Old methods fall behind because they:
depend on slower manual workflows,
require physical presence,
lack real-time data,
cannot personalize experiences,
involve higher costs and limited reach.
In today’s hyperconnected world, digital is not just an alternative—it is the primary driver of global markets. Old methods still exist, often for tradition or regulatory reasons, but their influence continues to shrink. The future belongs to systems that can evolve quickly, use data intelligently, and meet consumers’ expectations for instant, frictionless service. Digital does all this—and more—ensuring it remains the dominant force shaping the global economy.
Global Debt Crisis 1. Understanding Global Debt
Debt is money borrowed by governments, corporations, and individuals with a commitment to repay in the future. At the global level, debt is classified broadly into:
• Public (Sovereign) Debt
Borrowing by national or local governments through bonds, multilateral loans, or short-term instruments.
High public debt limits the government’s ability to spend on health, education, and infrastructure.
• Corporate Debt
Borrowing by private and public companies.
When interest rates rise sharply, companies may struggle to repay, leading to bankruptcies and job losses.
• Household Debt
Loans taken by individuals including home loans, personal loans, and credit card debt.
Household debt crises often precede banking crises, as seen in the 2008 mortgage meltdown.
The global debt crisis happens when multiple countries and sectors simultaneously struggle to service their debts because of rising borrowing costs, slow growth, or currency depreciation.
2. How Global Debt Reached Crisis Levels
a) Ultra-low interest rates after 2008
To revive growth after the global financial crisis, major central banks — such as the US Federal Reserve, ECB, and BoJ — cut interest rates to near zero.
This made borrowing inexpensive, encouraging countries and companies to take on huge amounts of debt.
b) Massive pandemic-era borrowing
During COVID-19, governments borrowed heavily to fund healthcare, social protection, and economic stimulus.
Low-income nations relied on emergency lending from the IMF and World Bank.
c) Rising inflation and interest rates (2022–2024)
A global inflation surge, caused by supply-chain breakdowns and energy shortages, forced central banks to aggressively raise interest rates.
Debt servicing suddenly became expensive, pushing weaker economies into distress.
d) Strong US dollar effect
Most global debt is denominated in US dollars.
When the dollar strengthens, countries with weaker currencies need more local currency to repay the same debt amount.
This creates pressure on foreign exchange reserves.
e) High commodity prices
Countries that rely heavily on importing oil, food, and raw materials saw their import bills rise.
They were forced to borrow more, worsening their external debt positions.
3. Key Examples of Debt Distress
• Sri Lanka (2022)
Sri Lanka defaulted on its foreign debt due to a combination of political instability, tourism collapse, and excessive borrowing.
It ran out of foreign exchange reserves to pay for fuel, medicine, and food.
• Argentina
Argentina has defaulted several times. High inflation, currency depreciation, and IMF loans have kept the country in continuous debt crisis cycles.
• African nations
Countries like Ghana, Zambia, Kenya, and Ethiopia face high external debt levels, much of it owed to China and private creditors.
Rising global interest rates made refinancing extremely difficult.
• Developed economies
Even advanced economies are not immune.
The US, Japan, Italy, and the UK have public debt levels exceeding 100% of GDP.
While they may not default due to strong currencies and central banks, high debt limits their fiscal flexibility.
4. Why Global Debt Crises Are Dangerous
a) Debt servicing crowds out essential spending
Countries must allocate more budget to repay interest rather than invest in development.
This leads to:
Cuts in welfare programmes
Delayed infrastructure projects
Reduced spending on education & healthcare
b) Currency depreciation & inflation
When investors lose confidence, they pull out capital.
This weakens local currency and triggers inflation, worsening living standards.
c) Banking sector instability
If governments or corporations default, banks holding their bonds may collapse.
This can spread across borders through financial markets.
d) Social and political turmoil
Debt crises often lead to:
Protests
Political instability
Fall of governments (e.g., Sri Lanka)
e) Global spillover effects
A crisis in one region can quickly affect global markets due to interconnected finance and trade.
For example, the 1997 Asian crisis rapidly spread across economies.
5. Major Drivers of the Current Global Debt Crisis
1. High Interest Rates
For the first time in decades, global interest rates have risen sharply.
This makes servicing existing debt extremely costly.
2. Weak Economic Growth
Slowing global growth reduces government tax revenues and corporate profits, affecting the ability to repay loans.
3. Geopolitical tensions
Conflicts in Eastern Europe, Middle East, and trade fragmentation between the US and China have created uncertainty, reducing investment and raising commodity prices.
4. Dependency on External Borrowing
Many emerging markets rely heavily on foreign borrowing.
If foreign lenders pull back, financing gaps emerge instantly.
5. Climate-related shocks
Extreme weather events have increased fiscal burden on vulnerable economies, pushing them further into debt.
6. How the IMF and Global Institutions Respond
The IMF, World Bank, and G20 play a key role in stabilizing global debt crises.
IMF tools include:
Bailout packages for countries in distress
Debt restructuring programs
Special Drawing Rights (SDRs) to boost reserves
Fiscal discipline guidelines
The G20’s Common Framework
Introduced to restructure debts of low-income countries jointly involving:
China
Paris Club Nations
Private creditors
World Bank support
The World Bank provides long-term loans at low interest rates for development and infrastructure, easing pressures on nations.
However, many experts argue that reforms are too slow, and creditor coordination remains difficult, especially with China’s large role in lending.
7. Potential Global Outcomes if Debt Crisis Worsens
a) Worldwide recession
If multiple countries default, global trade and investment could shrink significantly.
b) Bank failures
Financial institutions with large exposure to sovereign or corporate debt may face insolvency.
c) Capital flight from emerging markets
Investors may pull out funds, causing currency crashes and inflation spikes.
d) Social unrest
Economic hardship may lead to political instability in vulnerable nations.
e) Reduced global development
Poverty levels may rise, and progress on health and education could reverse.
8. Solutions to Mitigate Global Debt Crisis
1. Debt Restructuring
Rescheduling payments or reducing principal for distressed economies.
2. Fiscal discipline
Governments must reduce unnecessary spending and improve tax collection.
3. Diversifying economies
Reducing reliance on commodities or single industries makes economies more resilient.
4. Strengthening domestic capital markets
Countries should develop deeper bond markets to reduce dependence on foreign borrowing.
5. Improved global cooperation
Faster and coordinated action from IMF, G20, China, and private lenders is necessary.
Conclusion
The global debt crisis is not a single event but a structural challenge that has built up over decades. Rising borrowing, economic shocks, high interest rates, and weak global coordination have pushed many economies into dangerous territory. Without timely debt restructuring and coordinated global policy responses, the world could face prolonged financial instability, slower growth, and increased poverty.
Managing global debt is now one of the most critical challenges for policymakers, international institutions, and governments worldwide.

USD/CHF Bullish Momentum Ahead!The USD/CHF pair is showing fresh bullish momentum as price holds firmly above the highlighted support zone. Recent candles indicate steady buyer interest, especially as the market remains supported around the Ichimoku cloud area. This stable structure suggests the pair is preparing for a continued upward movement. The chart also shows a clear shift from consolidation to strength, with higher lows forming and momentum gradually building. As long as price stays above the blue support region, buyers are expected to maintain control and push the market higher. With this setup, the next key upside targets are 0.80690 and 0.80970, where the pair may face reactions or temporary resistance before deciding the next direction.
If you found this XAUUSD analysis helpful, don’t forget to LIKE 👍 and COMMENT 💬!

Buy GBP/USD before support of 50 Daily MA.I was hoping for GBP/USD to rise again towards last weeks highs, so I can move stop to breakeven but it never happened. I feel now there's a chance of a bigger correction and will buy again at 50 Daily Moving Average which usually is strong support.
Buy Limit : 1.3270 before 50 Daily MA
Stop : 1.3199 distance under 50 Daily MA
Profit : 1.3590 before descending trendline
Risk 1 : 4.5 / stop is 71 pips

USDCHF: bullish breakout🛠 Technical Analysis: On the 4-hour timeframe, USDCHF triggered a "Global bullish signal" with the completion of a SMA lines (100 and 200), confirming a shift in momentum. The price has successfully broken out of a local descending correction channel and is currently stabilizing above the significant SMA cluster support. The technical setup projects a continuation of the rally towards the immediate resistance at 0.81115, with a potential growth to the 0.8200 handle.
———————————————
❗️ Trade Parameters (BUY)
———————————————
➡️ Entry Point: Approx. 0.8050
🎯 Take Profit: 0.81115 (Resistance), medium-term target at 0.8200
🔴 Stop Loss: Below the recent consolidation structure and SMA cluster (approx. 0.80200)
⚠️ Disclaimer: This is a potential trade idea based on current analysis; market conditions and price direction are subject to change based on news factors and volatility.

TRUMP more correction awaits 12% at least toward 5$ Hi the support and resistances on the chart are based on the previous data and weekly candlesticks if BINANCE:TRUMPUSDT lost this last support and the green trendline the potential of 12% correction to the downside is logical toward 5$

Solana (SOL/USDT) – 4H Technical AnalysisSolana is currently consolidating within a tight range after failing to sustain momentum above the short-term moving averages. Price continues to trade below the 200-EMA, which keeps the broader 4H trend tilted to the bearish side.
Key Levels
Immediate Resistance:
$135–136 zone where price recently faced multiple rejections.
Short-term EMAs are also flattening near this region, creating additional overhead pressure.
Major Supply Zone:
$168–175 (highlighted red area).
This remains a strong higher-timeframe resistance where sellers previously dominated.
Immediate Support:
$128–130 (blue demand zone).
Price rebounded from here several times, showing active buyers.
Market Structure
Price attempted a short-lived recovery but failed to break above the 200-EMA. The market is forming lower highs, indicating weakening bullish attempts. Unless SOL makes a decisive close above the $135–136 region, upside continuation remains limited.
A sweep of liquidity into the $128–130 support zone is still possible, especially if momentum weakens further.
RSI Momentum
The RSI is hovering around the mid-zone (~45–47), reflecting indecision and lack of strong directional momentum.
No major bullish or bearish divergence is present on the current 4H structure.
As long as RSI remains below 50, bulls are not in clear control.
Possible Scenarios
Bullish Case
A clean breakout and 4H close above $136 could open room for a move toward $142–145, followed by a potential retest of the $155–160 region.
However, the 200-EMA overhead means buyers need strong volume to shift structure.
Bearish Case
If price breaks below the $128–130 demand zone, SOL may revisit $122–124, where the next support cluster is visible.
Failure to hold these levels could extend the corrective structure.
Neutral Summary
SOL is currently range-bound between $130–136, with neither side showing strong conviction. Traders may prefer waiting for a breakout from this range or a clearer reaction at the major support zone before taking directional positions.
This analysis is for educational purposes only and reflects general market observations, not financial advice.

Gold Continues to Range; Awaiting Breakout📊 Market Overview:
Gold continues to trade within a tight range 4180 – 4215, reflecting strong market indecision as traders await upcoming U.S. economic data. The USD remains relatively stable, keeping gold movement suppressed.
________________________________________
📉 Technical Analysis:
Key Resistance Levels:
• 4220
• 4230 – 4240
Nearest Support Levels:
• 4185 – 4180
• 4160 – 4150
EMA & Trend:
• Price is ranging around EMA 09, indicating lack of directional momentum.
• A confirmed H1/H4 close above 4215 signals bullish continuation.
• A breakdown below 4180 opens room toward 4160 – 4150.
Candlestick / Momentum Notes:
• Weak momentum, low volume → classic range-bound behavior.
• Rejection candles at 4220 show sellers defending the highs.
• Wick rejections near 4180 indicate buyers awaiting dips.
________________________________________
📌 Outlook:
Gold is likely to remain range-bound between 4180–4215 until a breakout occurs.
• Above 4215 → bullish bias toward 4230–4240
• Below 4180 → bearish bias toward 4160–4150
💡 Suggested Trading Plan:
🔻 SELL XAU/USD: 4227 – 4230
🎯 TP: 40 / 80 / 200 pips
❌ SL: 4234
🔺 BUY XAU/USD: 4160 – 4157
🎯 TP: 40 / 80 / 200 pips
❌ SL: 4154

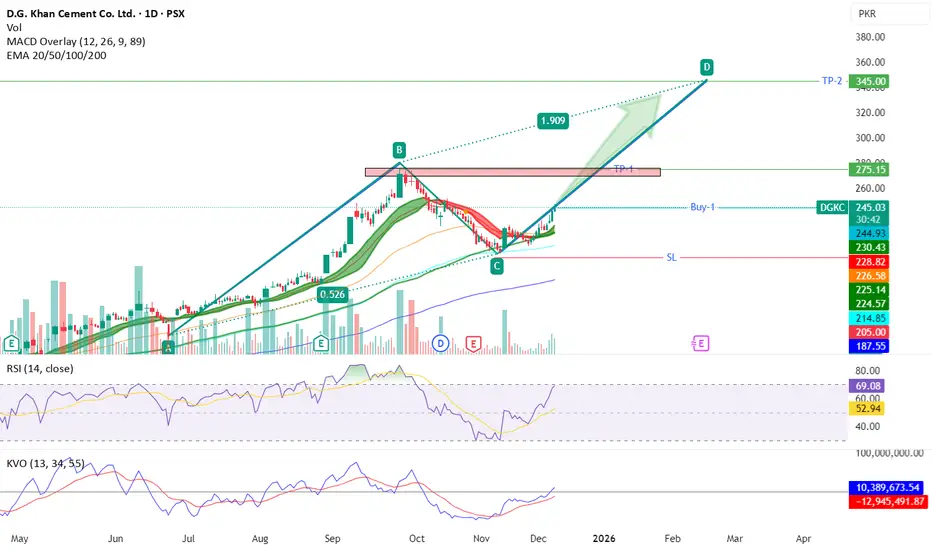
DGKC- PSX - Buy CallOn daily TF, price has just crossed EMA 20 level indicating a bull run. MACD overlay also suggesting start of buying momentum. RSI indicates that buyers are in control means prices are likely to continue the trend. KVO also suggesting that volumes are coming in this SCRIPT as KVO trigger is above Zero now.
AB=CD harmonic pattern has been drawn to arrive to potential TP2.
Trade values:
Buy = 245.50 (CMP)
TP-1: 270~275
TP-2: 345
SL: 205
XAUUSD | Bullish Reversal From Demand Zone🔥 XAUUSD | Intraday Reversal Setup – Buying From Demand Zone 🔥
Gold (XAUUSD) just tapped a fresh intraday demand zone, showing a sharp rejection wicks and a strong bullish push back above structure. Price is forming a potential short-term reversal, giving a clean BUY setup with multiple Take-Profit levels.
🟢 Why This Buy Setup?
Price respected a key support zone with aggressive buyer reaction.
Strong bullish engulfing candle after liquidity sweep.
Market structure turning bullish on lower timeframe.
Clear RR with defined TP1, TP2, TP3.
🎯 Targets (TP Levels)
TP1: Safe scalper target
TP2: Trend continuation target
TP3: Final extension target
🛡️ Stop Loss
SL placed below the rejection wick — protecting the setup while keeping RR favorable
