mrmoney limited XAG/USD swing trading ideaprice formed a range demand zone which will aid price for its bullish trends
XAG USD (Silver / US Dollar)

Gold mania ends in a $4000 reality check? Thousands queuing for hours in central Sydney to buy gold last week was a potential warning sign that gold was vulnerable to correction.
Today, gold prices saw their largest one-day fall in over ten years. After several failed attempts to break above 4,400, resistance held and momentum reversed sharply.
The first key support now potentially sits near 4,000 (200% retracement).
Despite the correction, long-term outlooks might remain positive. Ongoing inflation risk, lower interest rates, geopolitical tensions, and U.S. government dysfunction are still ever present. This might be why Goldman Sachs raised its December 2026 price target to 4,900 per ounce, up from 4,300, citing
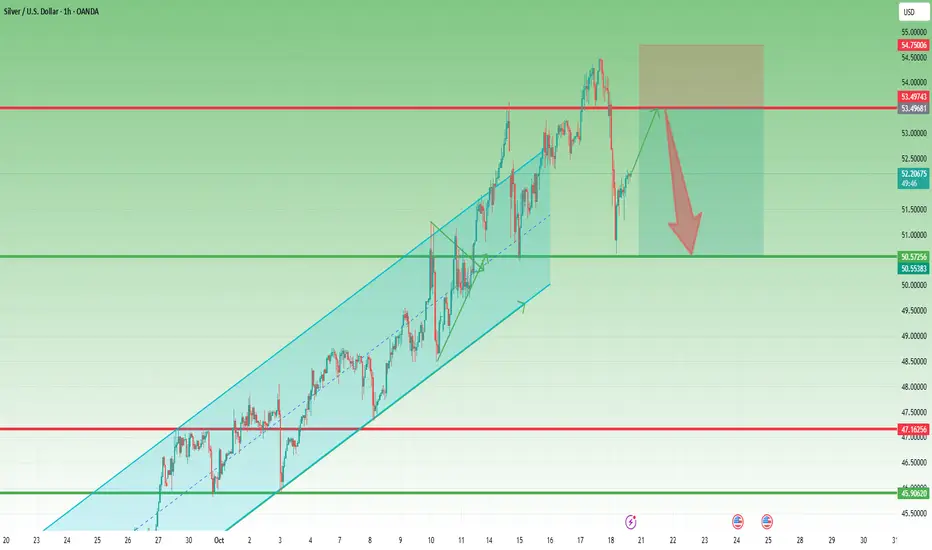
Silver also slumped more than 7%, marking their biggest daily loss since 2021, as overbought signals flashed extremes.

S&P Stalls, Gold & Silver Reality Check, US vs China WatchGold and Silver finally correcting - and I'm dollar cost averaging into dips
US Indexes (S&P, Nasdaq, Dow, Russell) stalling just off of all-time highs
Sideways is a behavior and it might seem boring, but it's certainly better than
the market rolling over and falling hard for 5-10% corrections (TBD)
AI Narrative remains optimistic
-I like the utilities, energy, and physical goods side of AI over software and hype
Financials and CAPEX spending remains firm
-money continues to flow into this AI buildout
Trump vs China is likely noise and eventual concessions and agreements
are likely the outcome - but the market is waiting for proof for now
US CPI data hitting Friday (first real US news in weeks) - does the market react?
Watch for broadening pattern and fakeouts, but the big tell with this market
pushing for more upside is the massive drop in VIX last week and once again
flirting with all-time highs
Thanks for watching!!!
-Chris

Silver rally: Are you in?Silver (XAGUSD) just hit a new all-time high, soaring above $53/oz! The surge is driven by a real physical shortage in London (record-low LBMA stocks, spike in lease rates, and COMEX premium), flight to safety amid dovish Fed expectations and gold’s rally, and booming industrial demand from solar energy and electronics. A short squeeze is also underway due to the rising cost of borrowing silver.
5 key drivers behind the XAGUSD bull run:
1. The market is short on metal – demand consistently outpaces supply.
2. Physical squeeze in London – inventories are depleted, spot trades above COMEX, borrowing costs surge.
3 . Industrial super-demand – energy transition fuels silver use in solar, electronics, and EVs.
4. Dovish macro backdrop – Fed rate cuts expected, weaker USD, inflows into safe havens.
5. Capital inflows – silver ETFs and bullion/coin demand picking up momentum.
FreshForex analysts see further upside: the breakout to new highs confirms strong demand for physical silver and sustained investor interest. The rally in gold and robust industrial trends give the silver market breadth and staying power. Q4 2025 offers great potential for active traders, but the strongest move is expected in Q1 2026 , as Fed policy loosens and supply remains tight

Gold vs SilverGold approaching Oct 14 mitigation zone while Silver approaches Oct 10 mitigation zone.
Gold price action more bearish over london session but in higher timeframe, gold dropping less aggressively considering it's barely approaching Oct 14 price while Silver already well below its respective Oct 14 levels.
Will be a market execution idea based on which gets to its zone last.

XAG/USD – SELL Entry (H1- Wedge Breakout Pattern)The XAG/USD Pair, Price has been trading within a Wedge Pattern on the H1 chart, forming consistent higher highs and higher lows. Price action is now testing the upper boundary of the Pattern, signalling a possible breakout. OANDA:XAGUSD
✅Market Context:
1️⃣Strong Upward Structure Inside the Pattern.
2️⃣Buyers are showing strength near Resistance.
3️⃣Breakout above the Trendline indicates Momentum continuation toward higher zones.
✅Trade Plan:
Entry: Buy after Confirmed Breakout above the Resistance (H1 candle close above trendline or retest of the breakout).
💰Take Profit (TP): At the Key Zone – a Major Resistance area identified ahead.
🛑Stop Loss (SL): Below the Pattern Structure.
✅Psychological Discipline :
1️⃣Stick to plan – No Revenge Trades.
2️⃣Accept losing trades as Part of the Strategy.
3️⃣Risk only 1–2% of your account balance per trade.
💬 Support the community: If you found this useful, drop a 👍 like and share your thoughts in the comments!
⚠️ Disclaimer: This analysis is for educational purposes only and does not constitute financial advice. Forex trading involves high risk. Trade only with capital you can afford to lose and always do your own research.

Silver (XAGUSD) Setup — VWAP & Volume Profile Trade PlanXAGUSD Silver is in a strong bullish trend on the higher timeframes, but we’ve seen an aggressive short-term reversal 🔁. I’m using VWAP and Volume Profile to help plan my trade and identify value/support areas 📊.
If price remains above VWAP and shows support from the volume profile, I’ll look for a long opportunity — otherwise I’ll stay flat and wait for confirmation 🚦. Everything’s explained clearly in the video.
⚠️ Disclaimer: This is for educational purposes only and not financial advice.

Stop!Loss|Market View: EURUSD🙌 Stop!Loss team welcomes you❗️
In this post, we're going to talk about the near-term outlook for the EURUSD currency pair☝️
Potential trade setup:
🔔Entry level: 1.15425
💰TP: 1.14149
⛔️SL: 1.16114
"Market View" - a brief analysis of trading instruments, covering the most important aspects of the FOREX market.
👇 In the comments 👇 you can type the trading instrument you'd like to analyze, and we'll talk about it in our next posts.
💬 Description: Bearish mood for the euro persists. A strengthening of the USD is expected in the mid- and short term. The most aggressive sell scenario is to look for an entry point at the current price level below 1.16600 (alternative scenario). A more conservative scenario (main scenario) suggests an approach to support at 1.15500 and then a breakout towards 1.14000.
Thanks for your support 🚀
Profits for all ✅
❗️ Updates on this idea can be found below 👇

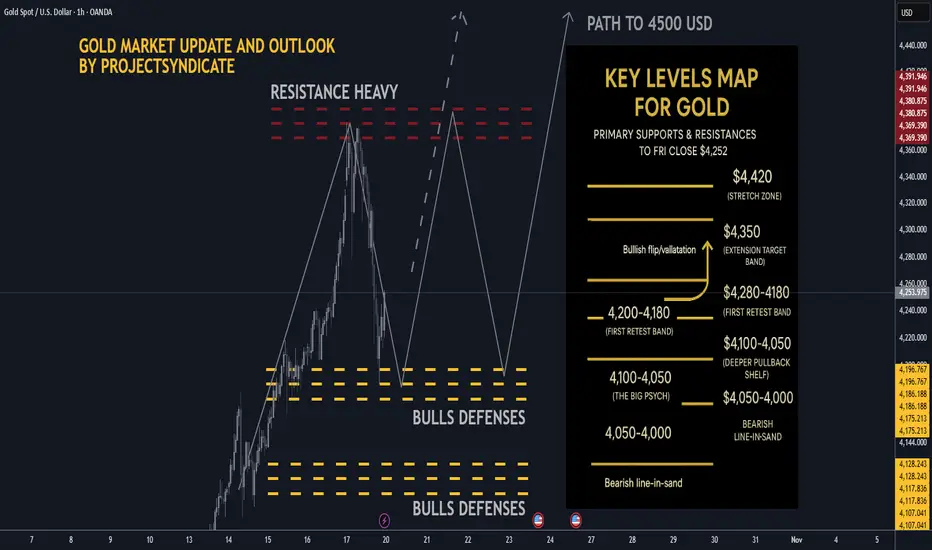
Gold next week: Key S/R Levels and Outlook for Traders🔥 GOLD WEEKLY SNAPSHOT — BY PROJECTSYNDICATE
🏆 High/Close: $4,379 → ~$4,252 — higher close vs. last week’s pullback finish.
📈 Trend: Uptrend intact > $4,000; dip buyers continue to control rhythm.
🛡 Supports: $4,180–$4,140 → $4,100–$4,050 → $4,000 must hold.
🚧 Resistances: $4,260 / $4,300 / $4,350 → stretch $4,380–$4,420.
🧭 Bias next week: Buy-the-dip > $4,140–$4,200; momentum regain targets $4,300–$4,380+. Invalidation < $4,050 → risk $4,000/3,980.
🌍 Macro tailwinds:
• Fed: Markets lean to another cut into Oct 28–29; softer real yields buoy gold.
• FX: DXY under pressure = constructive backdrop.
• Flows: ETF interest & CB buying remain supportive on dips.
• Geopolitics: Tariff/trade and regional risks keep safe-haven bids live.
🎯 Street view: Several houses float $5,000/oz by 2026 scenarios on easing policy & reserve diversification narratives
________________________________________
🔝 Key Resistance Zones
• $4,260–$4,280 near-ATH supply / immediate ceiling from close
• $4,300–$4,350 extension target band
• $4,380–$4,420 stretch zone toward prior spike high and measured extensions
🛡 Support Zones
• $4,220–$4,200 first retest band just below close
• $4,180–$4,140
• $4,100–$4,050 deeper pullback shelf; $4,000 remains the big psych
________________________________________
⚖️ Base Case Scenario
Expect shallow pullbacks into $4,220–$4,140 to be bought, followed by rotation back into the $4,260–$4,300 resistance stack for an ATH retest.
🚀 Breakout Trigger
A sustained push/acceptance > ~$4,280 unlocks $4,300 → $4,350, with room toward $4,380–$4,420 if momentum persists.
💡 Market Drivers
• Fed cut expectations into late Oct(lower real yields = gold tailwind
• USD softness / DXY sub-100 tone supports metals
• Ongoing central-bank bullion demand; ETF inflows stabilizing
• Geopolitics & trade/tariff headlines keeping safety bids active
🔓 Bull / Bear Trigger Lines
• Bullish above: $4,140–$4,200
• Bearish below: $4,100–$4,050 risk expands under $4,000
🧭 Strategy
Accumulate dips above $4,140–$4,200.
On breakout > $4,280, target $4,300–$4,350+. Maintain tight risk under stepped supports; invalidate momentum below $4,050–$4,000.
________________________________________
Silver corrective pullback supported at 5130The Silver remains in a bullish trend, with recent price action showing signs of a corrective pullback within the broader uptrend.
Support Zone: 5130 – a key level from previous consolidation. Price is currently testing or approaching this level.
A bullish rebound from 5130 would confirm ongoing upside momentum, with potential targets at:
5360 – initial resistance
5445 – psychological and structural level
5500 – extended resistance on the longer-term chart
Bearish Scenario:
A confirmed break and daily close below 5130 would weaken the bullish outlook and suggest deeper downside risk toward:
5065 – minor support
4980 – stronger support and potential demand zone
Outlook:
Bullish bias remains intact while the silver holds above 5130. A sustained break below this level could shift momentum to the downside in the short term.
This communication is for informational purposes only and should not be viewed as any form of recommendation as to a particular course of action or as investment advice. It is not intended as an offer or solicitation for the purchase or sale of any financial instrument or as an official confirmation of any transaction. Opinions, estimates and assumptions expressed herein are made as of the date of this communication and are subject to change without notice. This communication has been prepared based upon information, including market prices, data and other information, believed to be reliable; however, Trade Nation does not warrant its completeness or accuracy. All market prices and market data contained in or attached to this communication are indicative and subject to change without notice.

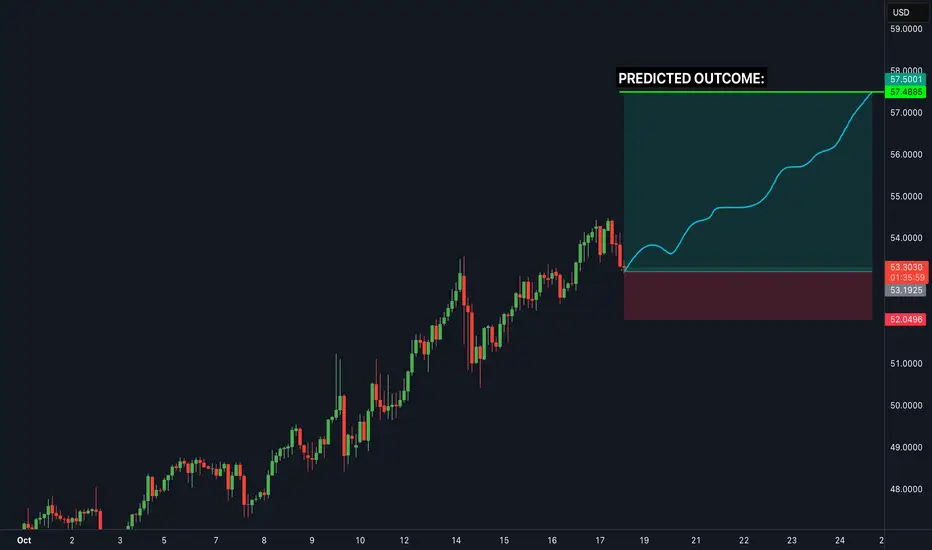
Silver: After New All-Time Highs, a Sharp CorrectionLast week, Silver reached a new all-time high, almost touching my $55 target.
However, on Friday, the market delivered a powerful sell-off, with the price dropping by around 4,000 pips — from the $54.50 ATH down to the $50.50 support zone.
At this stage, I expect the price to stabilize and form a temporary base of consolidation.
My focus now shifts to the $53.50 resistance zone, which could act as a short-term decision point.
If I observe signs of weakness or rejection in that area, I’ll consider short positions, targeting a potential retest of the $50 support zone.
Gold | Oil | Dollar | Natural Gas | Silver Price ForecastGold | Oil | Dollar | Natural Gas | Silver Price Forecast
NYMEX:NG1! NYMEX:CL1! COMEX:SI1! COMEX:GC1!

SILVER Strong Rejection! Buy!
Hello,Traders!
SILVER Price just reacted from a horizontal demand area after a deep liquidity sweep below the previous low. Buyers stepped in strongly, hinting at a possible continuation higher toward the target zone near $52.80 where unfilled orders remain. Expect bullish momentum to extend if the demand zone holds.
Time Frame 5H.
Buy!
Comment and subscribe to help us grow!
Check out other forecasts below too!
Disclosure: I am part of Trade Nation's Influencer program and receive a monthly fee for using their TradingView charts in my analysis.

SILVER Expected Growth! BUY!
My dear friends,
SILVER looks like it will make a good move, and here are the details:
The market is trading on 51.814 pivot level.
Bias - Bullish
Technical Indicators: Supper Trend generates a clear long signal while Pivot Point HL is currently determining the overall Bullish trend of the market.
Goal - 52.913
Recommended Stop Loss - 51.290
About Used Indicators:
Pivot points are a great way to identify areas of support and resistance, but they work best when combined with other kinds of technical analysis
Disclosure: I am part of Trade Nation's Influencer program and receive a monthly fee for using their TradingView charts in my analysis.
———————————
WISH YOU ALL LUCK

#SILVER: Will Price Momentum Take The Silver To $60?Metals is on the verge of reaching another record high after touching the $54 price point. It is highly probable that it will reach $60 or beyond. Currently, a smaller timeframe is suitable for minor corrections. Once a confirmation is obtained, a trade with strict risk management can be executed.
Best wishes and safe trading.
Team Setupsfx

SILVER: Trading Signal From Our Team
SILVER
- Classic bullish formation
- Our team expects growth
SUGGESTED TRADE:
Swing Trade
Buy SILVER
Entry Level - 51.814
Sl - 51.223
Tp - 52.966
Our Risk - 1%
Start protection of your profits from lower levels
Disclosure: I am part of Trade Nation's Influencer program and receive a monthly fee for using their TradingView charts in my analysis.
❤️ Please, support our work with like & comment! ❤️

SILVER GROWTH AHEAD|LONG|
✅SILVER After tapping into the demand level, price is expected to retrace higher as liquidity beneath the previous low has been cleared. A potential bullish reaction from this zone could drive the market toward the 52.50$ target area. Time Frame 2H.
LONG🚀
✅Like and subscribe to never miss a new idea!✅

SILVER Strong Uptrend! Buy!
Hello,Traders!
SILVER SMC based analysis shows price retracing toward the rising trend-line to rebalance short-term liquidity before another bullish leg. Buyers are expected to defend the structure and push price back toward the upper target zone near $5,296. Time Frame 5H.
Buy!
Comment and subscribe to help us grow!
Check out other forecasts below too!
Disclosure: I am part of Trade Nation's Influencer program and receive a monthly fee for using their TradingView charts in my analysis.

Silver corrective pullback supported at 5187The Silver remains in a bullish trend, with recent price action showing signs of a corrective pullback within the broader uptrend.
Support Zone: 5187 – a key level from previous consolidation. Price is currently testing or approaching this level.
A bullish rebound from 5187 would confirm ongoing upside momentum, with potential targets at:
5450 – initial resistance
5513 – psychological and structural level
5580 – extended resistance on the longer-term chart
Bearish Scenario:
A confirmed break and daily close below 5187 would weaken the bullish outlook and suggest deeper downside risk toward:
5055 – minor support
4960 – stronger support and potential demand zone
Outlook:
Bullish bias remains intact while the silver holds above 5187. A sustained break below this level could shift momentum to the downside in the short term.
This communication is for informational purposes only and should not be viewed as any form of recommendation as to a particular course of action or as investment advice. It is not intended as an offer or solicitation for the purchase or sale of any financial instrument or as an official confirmation of any transaction. Opinions, estimates and assumptions expressed herein are made as of the date of this communication and are subject to change without notice. This communication has been prepared based upon information, including market prices, data and other information, believed to be reliable; however, Trade Nation does not warrant its completeness or accuracy. All market prices and market data contained in or attached to this communication are indicative and subject to change without notice.

BUY SILVER! Perfect trade setupBased on deep analysis we can see silver is heading to the upside... this is a perfect risk to reward trade setup. Low risk high reward
Silver (XAGUSD) – Signal#Silver (XAGUSD) – Signal
H4 - Double top formation + trendline breakout. Stop loss beyond the local maximum. Reduce risks.
Entry: 53.47036
TP: 51.63879 - 49.44218 - 47.79873 - 44.32590
Stop: 54.60086

'Cinderella Gold' Episode 2 — Silver is Not Waiting Anymore 'Cinderella Gold' Episode 2 — Silver is Not Waiting Anymore 👑
Once upon a breakout… 📈
Back in March 2023, I dropped “Cinderella Gold Ready to Shine” — a bold claim that silver would rise from the shadows while the world watched only gold.
Fast forward to today — Silver (XAGUSD) is above $53 , and this chart doesn’t lie.
The forgotten sister of gold is no longer waiting for a dance…
She’s leading the entire ballroom now.
💥 Key Technical Levels
• $50.03 — now confirmed as new support
• $60.58 — next resistance / golden ratio (.618 fib)
• $73.24 — the “New Target” zone
• Ultimate fib expansion? $80+ is not fiction if momentum continues 🔭
This isn’t some one-day wonder. This is the result of 10+ years of structural consolidation breaking wide open.
And if you still think silver is a sidekick, you’re not reading the right story.
🧪 Why Now? The Tech-Silver Symbiosis
Most forget this:
Silver outperforms gold when technology is booming.
Why? Because unlike gold, silver isn’t just money — it’s semiconductors, solar panels, EV batteries, AI chips and the future of industry itself.
• 💻 Tech bull cycle → industrial demand skyrockets
• 🔋 Green energy transition → silver becomes critical infrastructure
• 🛠️ The macro tailwind + physical scarcity = explosive upside
🧠 Food for Thought 🍃
When tech runs hot, silver runs hotter.
It’s the metal that reflects not just fear — but progress.
Gold is the vault.
Silver is the spark.
One Love,
The FXPROFESSOR 💙
⚠️ Disclaimer
Disclaimer: These are my personal thoughts on the market. They are not financial advice. Every trade is your responsibility. Manage your risk and protect your capital.

SILVER - Cinderella Gold Ready To ShineSilver, aka as Cinderella Gold.
Can it outperform Gold?
as Dollar takes loses?
Can it come clkose to it's close to 50$ All time highs?
To be found out soon and all this depends on the Feds.
One Love,
THE FXPROFESSOR
