Platinum 10 years accumulation 2 000 USD Overview of Catalysts
Here’s a detailed look at the top 10 key catalysts influencing platinum prices—and how they stack up on a 0–10 impact scale 🎯.
1. Supply Deficits (Mining Shortfalls) ⛏️
Trend: Persistent structural deficits—the largest since 2013—with a projected deficit of \~598 koz in 2024.
Drivers: Declining output in South Africa and Russia, underinvestment, and aging mines.
Impact Score: 10/10 – Direct upward pressure on price.
2. Industrial Demand & Green-Energy Growth 🏭
Trend: Industrial consumption is booming, with strong growth in sectors like wind turbines, glass, and electronics.
Support: This broad demand fuels a large part of the supply deficit, and goes well beyond automotive use.
Impact Score: 9/10 – Strong structural support.
3. Auto Catalyst Substitution (Pd → Pt) 🔄
Trend: Cost-effective substitution as platinum approaches price parity with palladium; significant volume was substituted in 2023, with more projected for 2024.
Significance: Boosts automotive demand in an area previously dominated by palladium.
Impact Score: 8/10.
4. Electric Vehicle Adoption (EVs) ⚡
Trend: EVs don’t use platinum in catalytic converters, which is a structural hit to demand as EV growth continues.
Significance: Long-term downside pressure.
Impact Score: 7/10.
5. Hydrogen Fuel Cell Demand 💧
Trend: Hydrogen vehicles use platinum, with projected demand growth toward 2030.
Limitations: Growth remains slower than battery EVs.
Impact Score: 6/10.
6. Recycling Constraints 🔄
Trend: Recycling, which provides about a quarter of supply, is falling due to fewer end-of-life vehicles and glass, reducing the supply buffer.
Market Effect: This amplifies supply tightness.
Impact Score: 6/10.
7. Chinese Emission Policies 🏭
Trend: China’s tightening emissions regulations are supporting demand, with end uses well protected against a slowdown.
Importance: China is the largest platinum user; policy gives stability.
Impact Score: 7/10.
8. Jewellery & Investment Trends 💍
Trend: Jewellery demand remains steady, and investment demand is rising.
Note: This is a smaller demand segment, but it is supportive.
Impact Score: 5/10.
9. Macroeconomic & Auto Production Outlook 📉
Trend: Weak global auto production is lowering platinum use, but recovery in auto could lift demand.
Aftermath: Economic rebound could support prices.
Impact Score:** 5/10.
10. Speculative Sentiment & Positioning 📈
Trend: Inventories are depleted; investors are waiting for a breakout.
Tipping Point: A price surge could spark momentum-driven demand.
Impact Score:** 4/10.
| Rank | Catalyst | Score (/10) |
| ---- | ---------------------------------- | ----------- |
| 1 | Supply Deficit | 10 |
| 2 | Industrial / Green-Energy Demand | 9 |
| 3 | Auto Catalyst Pd → Pt Substitution | 8 |
| 4 | EV Adoption (Negative Impact) | 7 |
| 5 | Chinese Emission Policies | 7 |
| 6 | Hydrogen Fuel Cell Growth | 6 |
| 7 | Recycling Constraints | 6 |
| 8 | Jewellery & Investment Demand | 5 |
| 9 | Macro Slowdowns / Auto Production | 5 |
| 10 | Speculative Positioning | 4 |
📌 Key Insights & Outlook
* Tight supply and diversified demand—especially from green energy and industrial sectors—are the strongest bullish forces for platinum.
* Auto-driven substitution offers further upside, while EV growth and recycling limitations act as constraints.
* Chinese regulations add resilience; hydrogen offers potential if growth accelerates.
* Jewellery and investment flows remain minor but supportive.
* Much depends on auto sector recovery and investor psychology—momentum effects could amplify gains if technical levels break.
🔮 Final Take
Platinum remains positioned for medium-term strength, thanks to severe supply tightness and robust non-auto demand drivers. For investors, key areas to watch are further deficits, industrial trends, and catalytic substitution. Be mindful of potential headwinds from EV adoption and macroeconomic softness, but the structural case remains compelling.
XAG USD (Silver / US Dollar)

Silver - Can it go to 50$? We like to hedge by Buying Silver and selling Gold:
Gold is already at all time highs , but Silver is not even half of it's previous highs (2011)
Silver, the 'Cinderella Gold' is a semiconductor - thus rises with technology
Silver rises and drops togethjer with Gold, thus allowing us to have a beautiful hedging opportunity for the next few months

Stop!Loss|Market View: AUDUSD🙌 Stop!Loss team welcomes you❗️
In this post, we're going to talk about the near-term outlook for the AUDUSD currency pair☝️
Potential trade setup:
🔔Entry level: 0.64749
💰TP: 0.63731
⛔️SL: 0.65492
"Market View" - a brief analysis of trading instruments, covering the most important aspects of the FOREX market.
👇 In the comments 👇 you can type the trading instrument you'd like to analyze, and we'll talk about it in our next posts.
💬 Description: OANDA:AUDUSD and OANDA:NZDUSD are currently the most likely currency pairs to fall amid the likely continued strengthening of the USD. By the end of the year or early next year, an updating of the 2025 lows is expected. The short-term picture also suggests a likely context for selling. Accumulation below the POC level and support from the uptrend channel will likely lead to a decline toward the 0.63000 - 0.64000 area.
Thanks for your support 🚀
Profits for all ✅
❗️ Updates on this idea can be found below 👇

Stop!Loss|Market View: USDJPY🙌 Stop!Loss team welcomes you❗️
In this post, we're going to talk about the near-term outlook for the USDJPY currency pair☝️
Potential trade setup:
🔔Entry level: 151.332
💰TP: 153.800
⛔️SL: 149.766
"Market View" - a brief analysis of trading instruments, covering the most important aspects of the FOREX market.
👇 In the comments 👇 you can type the trading instrument you'd like to analyze, and we'll talk about it in our next posts.
💬 Description: The gap continues to attract sellers to the USDJPY market, but for now, the USD is still bullish. Without any unexpected news from Japan, we'll likely see growth, and the 150 area is likely to form the basis for continued growth. Closing the gap is less likely in the current situation.
Thanks for your support 🚀
Profits for all ✅
❗️ Updates on this idea can be found below 👇

Setupsfx_ | SILVER: Preparing For Another Bullish Move! There are two buying areas we believe could reverse the price trend, which would be a significant move in silver price history. We may even see it go above $40 for the first time. Silver is becoming a secondary best option to invest in the global market, but it will never surpass gold at least for now.
Good luck and trade safely!
Team Setupsfx_

GAMMA SQUEEZE: Why Gold Prices will hit 5 000 + USDBottom line
If 1% of Treasuries ($278B) rotates into gold, $5,000/oz is not only plausible—it sits inside the low end of what flow math + today’s market microstructure can deliver. The path (and whether we print $8k+ spikes) hinges on how much of that flow shows up as short-dated calls—because that is what turns steady demand into a self-feeding gamma loop.
________________________________________
Executive summary
• A 1% rotation out of U.S. Treasuries is roughly $278B of new gold demand (using SIFMA’s latest estimate that Treasuries outstanding ≈ $27.8T).
• At today’s context (gold ~$3.53k/oz on Sep 2–5, 2025), $278B buys ~79.4M oz ≈ 2,471 tonnes; at $5k/oz it buys ~55.6M oz ≈ 1,729 tonnes. For scale, annual mine supply ≈ 3,661 t and total above-ground stocks ≈ 216,265 t (bars/coins+ETFs ≈ 48,634 t).
• That flow is huge relative to both quarterly demand value (Q2’25 ≈ $132B) and typical daily trading turnover (~$290B/day across OTC, futures & ETFs). Even spread out, it materially tilts the tape; if concentrated and routed via options, it can produce dealer hedging feedback—i.e., a gamma squeeze.
• Price targets (framework, not prophecy):
o Conservative flow-only: +40–60% → $4,900–$5,600/oz
o Base case (flow + some options reflexivity): +70–110% → $6,000–$7,500/oz
o Squeeze/overshoot window (short-dated calls heavy): episodic spikes >$8,000/oz possible, but hard to sustain without continued flow.
These bands come from scaling prior ETF-driven episodes (notably ~877 t ETF inflow in 2020 alongside a ~+36% price run) and sizing against current market depth, while layering a realistic options-hedging multiplier (details below).
________________________________________
1) What a “gamma squeeze” in gold means (and why it can happen)
Definition (in one line): When call buying concentrates near-dated, near-the-money strikes, dealers short gamma must buy futures as price rises (and sell if it falls) to keep neutral—this feedback accelerates upside (“gamma squeeze”).
Why it’s plausible in gold right now:
• The listed derivatives stack is large. As of Fri, Sep 5, 2025, CME’s daily bulletin shows COMEX gold options open interest ~0.80M contracts (calls ~0.49–0.69M; puts ~0.30–0.38M depending on line item), each on 100 oz—i.e., option OI notionally ties to ~2,400–2,800 t of gold. That is the powder keg a call-wave can act on.
• Implied vol is moderate (GVZ ~18 for 30-day GLD options), so vega is “affordable,” gamma is punchy in the front end.
• CME’s CVOL framework and open-interest tools confirm where strikes/expiries cluster; when OI stacks close to spot and near expiry, market-wide gamma becomes most sensitive.
Back-of-envelope hedging math (illustrative):
For a 30-day, at-the-money option with σ≈18%, the Black-Scholes gamma is about
Γ≈ϕ(0)SσT≈0.399S⋅0.18⋅30/365\Gamma \approx \frac{\phi(0)}{S\sigma\sqrt{T}} \approx \frac{0.399}{S\cdot 0.18 \cdot \sqrt{30/365}}.
At S=$3,500/oz, that’s ~0.0022 per $. A +1% move (+$35) bumps delta by ~0.077 per option. If just 150k near-ATM front-tenor calls are held by customers (dealers short gamma), hedge buying ≈ 150,000 × 100 oz × 0.077 ≈ 1.16M oz ≈ 36 t—per 1% price pop. That’s only a slice of total OI; a broader crowding raises this number. Compare with ~2,500 t/day of global turnover and you can see how concentrated dealer hedging can move price intraday.
________________________________________
2) Sizing a 1% Treasury → gold rotation
Treasury base: latest SIFMA comment put U.S. Treasuries outstanding ≈ $27.8T (Q1’25). 1% → $278B.
Gold the rotation would buy:
• At $3,500/oz: $278B → ~79.4M oz → ~2,471 t
• At $5,000/oz: $278B → ~55.6M oz → ~1,729 t
For scale:
• Annual mine supply (2024): ~3,661 t; total supply (incl. recycling): ~4,974 t. A $278B buy ticket equals 47–67% of a year’s mine output (depending on price), or ~35–50% of total annual supply.
• ETF precedent: In 2020, ~877 t net ETF inflow (~$48B) coincided with a ~+36% move from Jan→Aug 2020. Today’s $278B is ~5–6× that dollar size (and ~2–3× the tonnes, depending on price), hinting at large flow-driven upside even before any options reflexivity.
• Turnover lens: WGC puts average daily trading across OTC/futures/ETFs at roughly $290B/day recently. A $278B program is ~one day’s global turnover. Pushed quickly (or skewed to options), that’s impactful; stretched over months, the price impact softens but still accumulates.
Futures-only lens (capacity check):
At $3,500/oz, one COMEX GC contract notionally = $350k (100 oz). $278B equals ~794k GC contracts. Current futures OI is ~0.49M contracts, so this exceeds all COMEX OI—you cannot push that much via futures quickly without major repricing. Even at $5,000/oz (~$500k/contract), it’s ~556k contracts, still comparable to the entire OI.
________________________________________
3) Price-target framework (with the math that gets you there)
Think of the price in layers: (A) base flow impact + (B) options-gamma reflexivity + (C) second-round effects (short-covering, momentum, FX, central banks).
A) Flow-only impact (calibrated to 2020)
• 2020 anchor: 877 t ETF inflow ↔ ~+36% price. Using a simple proportionality, 1,729–2,471 t (your $278B) maps to ~+71% to +101%.
• Apply to spot ≈ $3,532/oz (early Sep 2025):
o +71% → ~$6,050/oz
o +101% → ~$7,100/oz
Caveat: 2020 had unique macro tailwinds, so I treat this as upper-middle of base range.
B) Options reflexivity / gamma squeeze overlay
If 20–30% of the $278B rotation expresses via short-dated calls (common for levered macro expressions), dealer hedging can amplify flow impact:
• From the OI math earlier, a mere 1% up-move can demand ~20–40 t of dealer hedge buying if near-ATM OI is thick. A 3–5% multi-day grind can easily cascade into 100–200 t of incremental buying from hedgers alone. That’s non-trivial vs. mine supply pace, and it pulls forward upside.
• Result: add another +10–20% to the flow-only levels during a squeeze while it lasts.
C) Second-round effects
• Central banks: still persistent net buyers (>1,000 t/yr pace in recent years), tending to fade dips rather than rallies—a structural bid.
• FX & rates: the GVZ ~18 regime means bursts of vol aren’t “expensive”; a weakening USD or policy shocks can tilt the target higher.
Putting it together—scenario bands
Scenario Assumptions Implied move Target
Conservative $278B spread over 6–9 months, mostly physical/ETFs; limited options +40–60% $4,900–$5,600
Base case 50–70% to physical/ETFs, 30–50% to futures/options; moderate dealer short-gamma +70–110% $6,000–$7,500
Squeeze / overshoot Short-dated call concentration, dealers persistently short gamma; flow bunches in weeks +120–>150% (episodic) >$8,000 (brief spikes)
$5,000 target is well within the conservative band if any meaningful fraction of the $278B pushes through quickly, even without a full-blown gamma loop.
________________________________________
4) Why the market could mechanically gap higher
• Market size vs. flow: Q2’25 total demand value = $132B. Dropping $278B into this ecosystem is a 2× quarterly shock.
• Trading capacity: $278B ≈ one full day of global turnover; price impact is convex when the risk-absorption (dealers, miners, recyclers) cannot scale linearly day-by-day.
• Derivatives gearing: With ~0.8M options contracts OI outstanding and futures OI ~0.49M, even a partial shift into calls forces hedge-buys on the way up, the hallmark of a squeeze.
________________________________________
5) Key risks / reality checks
• Time profile of the rotation matters. A slow, programmatic shift spreads impact; a front-loaded move can overshoot then mean-revert as gamma decays.
• Elasticity is asymmetric. Jewelry/fabrication falls at high prices (demand destruction), recycling rises, both cushioning extremes. That moderates how long >$7k can persist without continued flow.
• Volatility regimes change. If GVZ spikes to high-20s/30s, option premia jump, slowing new call demand; conversely, put demand can flip net gamma long for dealers, dampening squeezes.
________________________________________
References (most load-bearing)
• Treasury base: SIFMA—Treasuries outstanding $27.8T (Feb 2025).
• Gold supply & stocks: WGC—Above-ground stock 216,265 t (end-2024); bars/coins+ETFs 48,634 t; mine supply 2024 ≈ 3,661 t.
• Trading turnover: WGC—gold trading ≈ $290B/day.
• ETF precedent: WGC—2020 ETF inflows 877 t (~$47.9B) alongside major price rise.
• Current price context: Reuters—record highs $3,532/oz set in early Sep 2025. (
• Options/hedging plumbing: CME daily bulletin (Sep 5, 2025) showing gold options OI ~0.8M contracts; CME CVOL/tools; Cboe GVZ ~18 as 30-day IV.
________________________________________

Silver - Expecting Bullish Continuation In The Short TermH4 - Strong bullish momentum.
No opposite signs.
Until the two Fibonacci support zones hold I expect the price to move higher further.
If you enjoy this idea, don’t forget to LIKE 👍, FOLLOW ✅, SHARE 🙌, and COMMENT ✍! Drop your thoughts and charts below to keep the discussion going. Your support helps keep this content free and reach more people! 🚀
--------------------------------------------------------------------------------------------------------------------

Stop!Loss|Market View: SILVER🙌 Stop!Loss team welcomes you❗️
In this post, we're going to talk about the near-term outlook for SILVER ☝️
Potential trade setup:
🔔Entry level: 50.05638
💰TP: 47.31895
⛔️SL: 52.62271
"Market View" - a brief analysis of trading instruments, covering the most important aspects of the FOREX market.
👇 In the comments 👇 you can type the trading instrument you'd like to analyze, and we'll talk about it in our next posts.
💬 Description: The most likely scenario for silver is currently moving toward the nearest support level at 50.78000, where a downward breakout is expected. In this case, it would be safe to say the local uptrend has been broken. An alternative (less likely) scenario suggests a new high near 52, where a reversal could be anticipated. In both cases, it's best to look for a potential entry once the price reaches indicated levels.
Thanks for your support 🚀
Profits for all ✅
❗️ Updates on this idea can be found below 👇

Stop!Loss|Market View: GBPUSD🙌 Stop!Loss team welcomes you❗️
In this post, we're going to talk about the near-term outlook for the GBPUSD currency pair☝️
Potential trade setup:
🔔Entry level: 1.32869
💰TP: 1.31574
⛔️SL: 1.33603
"Market View" - a brief analysis of trading instruments, covering the most important aspects of the FOREX market.
👇 In the comments 👇 you can type the trading instrument you'd like to analyze, and we'll talk about it in our next posts.
💬 Description: The situation for the pound is very similar to that for the euro. Here, too, the most likely scenario is further price accumulation near the key support level (1.32870), followed by an expected downward breakout toward 1.31000. An alternative scenario involves monitoring a sell entry point near the resistance level at 1.34500. Also, the 1.27000 - 1.28000 range can be looked for as an additional target.
Thanks for your support 🚀
Profits for all ✅
❗️ Updates on this idea can be found below 👇

SILVER Will Keep Growing! Buy!
Hello,Traders!
SILVER shows Smart Money accumulation from the horizontal demand area, with bullish displacement suggesting price will tap into the 5,280$ liquidity pool next. Time Frame 1H.
Buy!
Comment and subscribe to help us grow!
Check out other forecasts below too!
Disclosure: I am part of Trade Nation's Influencer program and receive a monthly fee for using their TradingView charts in my analysis.


Silver Price Reaches Record HighSilver Price Reaches Record High
The previous peak was set in 1980, but this week the price of silver rose above $53 for the first time ever, as shown on the XAG/USD chart.
Bullish sentiment has been driven by political factors, sustained demand from central banks, and the metal’s growing use in modern industries such as renewable energy.
Meanwhile, media reports are adding to the sense of market frenzy, noting:
→ shortages in physical supply;
→ forced liquidation of short positions (the “short squeeze” effect);
→ bold analyst forecasts — with a CNBC survey suggesting silver could double from current levels to reach $100.
Technical Analysis of the XAG/USD Chart
In earlier analysis of the XAG/USD chart, we:
→ identified an upward channel;
→ noted that silver’s rise was slowing around the $48.75 level, though new record highs in gold could spur the “silver bulls”.
That slowdown has proved to be merely a pause before a breakout to fresh 45-year highs. The ascending channel has maintained its slope but widened upward — notably, the current all-time high sits along the upper boundary of this expanded channel.
Key observations:
→ A sharp drop of more than 5% over the past two candles signals strong selling pressure, likely linked to profit-taking after a roughly 17% rise over the past 30 days.
→ Long lower wicks on the recent wide candles (as indicated by the arrow) show active buying interest.
→ The rise in the ATR indicator became evident as the market broke through the key psychological level of $50 per ounce.
The increase in volatility means traders may need to adjust their strategies — it can also signal that a market reversal could be nearing, as extreme price swings often mark the end of prolonged trends.
For now, however, demand remains strong enough to keep the market within its upward channel:
→ bulls are likely to view the $50–50.50 area as key support;
→ bears may look to reassert control if XAG/USD attempts to climb further above $53.
This article represents the opinion of the Companies operating under the FXOpen brand only. It is not to be construed as an offer, solicitation, or recommendation with respect to products and services provided by the Companies operating under the FXOpen brand, nor is it to be considered financial advice.

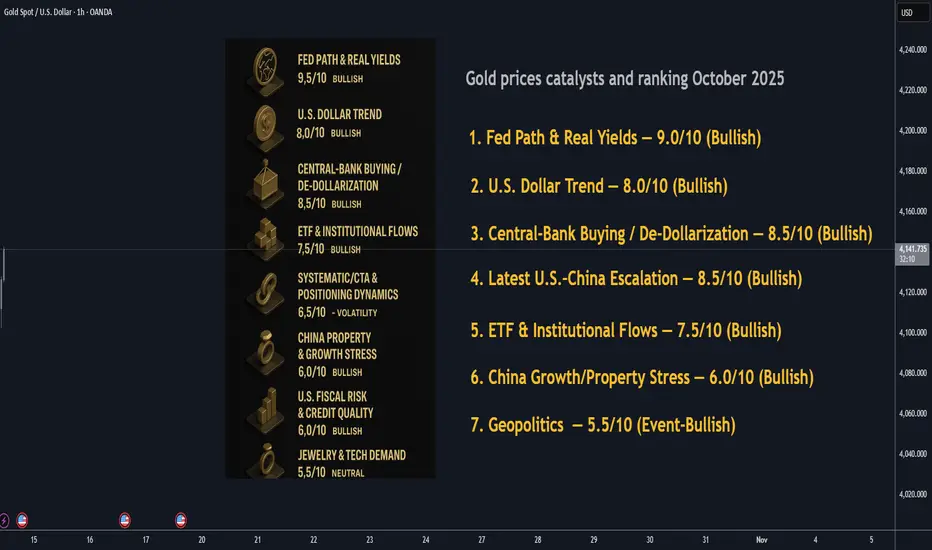
Gold Prices Overview of Primary Catalyst : October 2025📊 Catalyst Scorecard — Updated (10 = max bullish impulse)
1. Fed Path & Real Yields — 9.0/10 (Bullish)
Markets lean toward additional Fed cuts into year-end as labor-market risks build; dovish signaling around/after Jackson Hole has coincided with record gold prints. Lower real yields remain the single strongest tailwind.
2. U.S. Dollar Trend — 8.0/10 (Bullish)
DXY ~99 keeps FX headwind light for non-USD buyers; any further dollar slippage greases upside.
3. Central-Bank Buying / De-Dollarization — 8.5/10 (Bullish)
Official-sector demand re-accelerated in August after a softer July; 2025 remains a strong year led by EM banks. This sticky, price-insensitive bid keeps floors firm.
4. Trade/Tariff Shock (Latest U.S.–China Escalation) — 8.5/10 (Bullish)
Tariff brinkmanship has re-ignited, with scenarios floating sweeping new/raised U.S. tariffs on China up to triple-digits on some categories. Inflationary impulse + growth uncertainty = safe-haven and hedge demand for gold.
5. ETF & Institutional Flows — 7.5/10 (Bullish)
Record-style inflows in Sept. (largest monthly on WGC data this year) and five straight months in Europe underline broadening participation. Flows amplify macro moves.
6. Systematic/CTA & Options Positioning — 6.5/10 (Mixed → Volatility)
Trend-following and options gamma around big figures ($4,100 / $4,200) are magnifying intraday whipsaws. Inference from price behavior vs. round-number pivots and fresh highs.
7. China Growth/Property Stress — 6.0/10 (Bullish)
Macro fragility + trade tensions keep risk appetite cautious and investment demand for hedges elevated. Macro inference aligned with tariff news and sustained safe-haven bids.
8. U.S. Fiscal & Credit Risk — 6.0/10 (Bullish)
Deficits and periodic funding drama incl. shutdown headlines sustain a background bid for duration-agnostic hedges like gold.
9. Jewelry & Tech Demand — 4.5/10 (Slightly Bearish near records)
At all-time highs, price-sensitive jewelry demand lags (India still seasonally active, but at higher rupee prices); investment demand dominates.
10. Geopolitics (Ukraine/Mideast/Taiwan) — 5.5/10 (Event-Bullish)
Event spikes persist but remain secondary to the rate/FX driver set.
🗂️ Quick Table
Rank Catalyst Score/10 Impact Direction Notes
1 Fed path & real yields 9.0 Very High Bullish Cuts priced; new highs on rate-cut bets.
2 Central-bank buying 8.5 High Bullish Aug net adds; robust 2025.
3 U.S.–China tariff risk 8.5 High Bullish Escalation chatter/looming hikes.
4 U.S. dollar trend 8.0 High Bullish DXY ~99 keeps winds favorable.
5 ETF/institutional flows 7.5 High Bullish Sept set records; 5-mo EU streak.
6 Systematic/CTA flows 6.5 Mod Mixed Round-number gamma, whipsaws.
7 China growth stress 6.0 Mod Bullish Macro fragility + tariffs.
8 U.S. fiscal risk 6.0 Mod Bullish Funding theatrics support hedges.
9 Jewelry/tech demand 4.5 Low Slightly Bearish Price-sensitive demand lags at highs.
10 Geopolitics (broad) 5.5 Low-Mod Event-Bullish Episodic spikes; not primary.
________________________________________
🚀 Street Outlook — Bullish 2026 Calls ≥ $5,000
• Bank of America: lifts 2026 target to $5,000/oz (avg $4,400), citing sustained investment demand and macro hedging.
• Société Générale: referenced alongside BofA in calling potential $5,000 by 2026 amid rate-cut cycle & trade tensions.
Bottom line: High-conviction houses are explicitly flagging $5k scenarios into 2026 on the combo of easier policy, FX tailwinds, and structural buying.
________________________________________
🧨 Spotlight: Latest U.S.–China Tariff Escalation
Tariff rhetoric and policy paths have re-intensified into mid-October, with reports of much higher U.S. tariffs on Chinese imports incl. 100% in some proposals “looming”. The renewed brinkmanship is elevating inflation and growth uncertainty, a classic support for gold.
________________________________________
🧩 Key Supports & Resistances
Reference: Spot ~$4,123/oz; day’s high ~ $4,179, low ~ $4,091 (Oct 14, 2025).
🔼 Resistances
• $4,180–$4,200: Record high / round-number supply (fresh sellers + optionality).
• $4,250: Next psychological magnet; common options strike/target zone (technical inference).
• $4,300: Major psychological figure; likely heavier gamma/stop clusters (inference).
🔽 Supports
• $4,100: First intraday pivot (today’s congestion).
• $4,000: Major psych level / prior breakout; expect dip-buying and CTA reloads. (Inference supported by recent breakout behavior.)
• $3,900–$3,850: Pullback buffer from prior impulse leg (tech inference).
• $3,750 / $3,700: Deeper mean-reversion shelf if macro data surprises hawkish.
• $3,500: Cycle baseline—would imply a regime shift (low probability barring macro shock).
🧠 Trading implications: Expect chop around $4,100–$4,200 as options/CTA flows battle; decisive acceptance above $4,200 opens a momentum run toward $4,250 → $4,300. Failure to hold $4,100 puts $4,000 in play where physical + ETF dip-buyers likely re-engage.
________________________________________
🌐 Flow & Positioning Notes
• ETFs: September marked the largest monthly inflow of 2025, led by Europe (UK/CH/DE), extending a five-month streak—a textbook confirmation of bull-trend participation.
• Official sector: Net buyers in August; EM central banks remain the anchor bid.
• FX: DXY drift lower = mechanical tailwind; watch for USD squeezes around U.S. data prints.
________________________________________
🧭 Risk Map What Can Derail $5k?
• Hawkish upside surprises in U.S. inflation/growth pushing real yields higher (cuts repriced later/weaker).
• Swift tariff de-escalation dampening inflation hedging bid.
• Positioning washouts near round numbers if CTA trend signals flip (volatility risk).
________________________________________
✅ Bottom Line
Momentum, macro, and flows argue buy-the-dip into $4,000–$4,100 while the $5k-by-2026 narrative strengthens on the Street. Break and hold above $4,200 likely extends the up-leg toward $4,250–$4,300 near term; BofA’s $5,000 2026 call underscores the cycle’s runway.
Silvers reached a fresh record high due to the short squeezeSilver prices reached an all-time high of over 53 USD/ounce, driven by a significant short squeeze in London. This rally was further fueled by safe-haven demand following the resumption of US-China trade tensions.
US President Trump expressed openness to negotiations after announcing an additional 100% tariff on Chinese goods, but China has not responded. Meanwhile, China's Sep exports surprisingly increased by 8.3% YoY, the fastest pace in six months, driven by demand from countries other than the US. Exports to the US fell 27% YoY due to tariff pressures. This indicates that the additional threat from Trump may not significantly impact China, especially given its crucial role in the AI value chain and its dominance in rare earth production. These elevated tensions could continue to drive markets toward safe-haven assets amid global instability.
On the supply side, the London Bullion Market Association, as reported by Bloomberg, confirmed that it is “aware of tightness in the silver market and is actively monitoring the situation.” Mine production has remained below demand since 2021, primarily due to electrical and electricity demand, especially from photovoltaics, where China is a dominant force. The ongoing supply shortage could continue to support silver prices.
Technically, XAGUSD is showing strong bullish momentum after breaking its previous record high, with both EMAs diverging and extending.
XAGUSD could continue to rise and test the 227.2% Fibonacci extension at 60.
Conversely, price could face take profit pressure after a long rally with the RSI indicates the overbought level (over 88). If the bullish momentum weakens, XAGUSD could test the resistance level at 47.88.
By Van Ha Trinh - Financial Market Strategist at Exness

Stop!Loss|Market View: GOLD🙌 Stop!Loss team welcomes you❗️
In this post, we're going to talk about the near-term outlook for GOLD ☝️
Potential trade setup:
🔔Entry level: -
💰TP: -
⛔️SL: -
"Market View" - a brief analysis of trading instruments, covering the most important aspects of the FOREX market.
👇 In the comments 👇 you can type the trading instrument you'd like to analyze, and we'll talk about it in our next posts.
💬 Description: Metals continue to demonstrate impressive results. As a result, we are seeing new all-time highs. It's difficult to find any potential buy or sell levels for gold, but we can highlight an area around 4200-4250, where sell trades, especially mid-term, are highly likely to be liquidated. This assumption is based on a 25% price move from the start of the current rally since August, as well as the point of control (POC) of the same rally around 3650. We should likely expect the end of the US shutdown, after which we could see a correction in metals.
Thanks for your support 🚀
Profits for all ✅
❗️ Updates on this idea can be found below 👇

Stop!Loss|Market View: EURUSD🙌 Stop!Loss team welcomes you❗️
In this post, we're going to talk about the near-term outlook for the EURUSD currency pair☝️
Potential trade setup:
🔔Entry level: 1.15326
💰TP: 1.14123
⛔️SL: 1.16348
"Market View" - a brief analysis of trading instruments, covering the most important aspects of the FOREX market.
👇 In the comments 👇 you can type the trading instrument you'd like to analyze, and we'll talk about it in our next posts.
💬 Description: The price continues to accumulate near short-term support 1.16600, indicating a likely breakout toward 1.15500. The most conservative entry points for selling are, surely, located directly at 1.16600, more aggressive - would be to look for selling from approximately current prices.
Thanks for your support 🚀
Profits for all ✅
❗️ [ b]Updates on this idea can be found below 👇

Silver has reached the launchpad.Not only did Silver finally hit a new all time high but even more impressive is that it finally closed a candle above the rimline of the 40 year old cup and handle pattern it has been forming since before I was even born. Considering how long it took to accomplish this I can not in good faith let one daily candle close trick me into thinking that it has validated the breakout but this is definitely a giant leap closer to validating an eventual breakout. I get the feeling people are going to be absolutely mindblown by what silver does when the breakout is validated. We are currently on our way to the dotted red trendline’s target but on the way they we should definitely validate the cup and handle breakout hitch will then has us heading to the exponentially higher dotted green lines target at around $722. Buckle up people and prepare for blastoff in the not so distant future. Also be aware that they could have multiple dips back below then back above and below and above the rimline of the cup (horizontal green line) before the actual breakout. Or it could just send a random moonshot candle up to the target as well n the very first try. Best to be prepared for both possibilities. *not financial advice*

#XAGUSD Silver – Monthly Chart (Higher Time Frame Analysis Updat📈 #XAGUSD Silver – Monthly Chart (Higher Time Frame Analysis Update)
On the monthly COMEX chart, Silver has reached a historically critical zone — a level it has touched only three times since its inception on the forex market ⚡️
### 🕰 Historical Context
1️⃣ 1980:
Silver made its first-ever major peak around $48, followed by a massive correction all the way down to $5.
2️⃣ April 2011:
The metal created another lifetime high at $49.80, but history repeated itself — price crashed sharply, touching lows near $11.50 in subsequent years.
3️⃣ October 2025 (Current Scenario):
Silver has now printed a new high at $51.20, marking its third attempt in history to sustain above the psychological barrier of $50.
---
### 🔍 Key Technical Outlook
Both previous times, Silver failed to sustain above $50, leading to deep corrections.
Hence, this time, we need to see at least 1–2 consecutive weekly candle closings above the $50–$51 zone to confirm a strong breakout and trend continuation.
Once that confirmation comes in, we could confidently plan fresh long entries, as this would signal a potential super-cycle rally in Silver 🔥
---
### 🎯 Upside Projections
If Silver manages to hold above $50 convincingly, the next major targets on a higher timeframe would be:
* First Target: $60
* Extended Target: $68
This move could potentially open the doors for a massive long-term bullish phase, supported by both technical breakout and global precious metal demand fundamentals 💎

Silver bullish breakout supported at 4964The Silver remains in a bullish trend, with recent price action showing signs of a continuation breakout within the broader uptrend.
Support Zone: 4964 – a key level from previous consolidation. Price is currently testing or approaching this level.
A bullish rebound from 4964 would confirm ongoing upside momentum, with potential targets at:
5190 – initial resistance
5275 – psychological and structural level
5355 – extended resistance on the longer-term chart
Bearish Scenario:
A confirmed break and daily close below 4964 would weaken the bullish outlook and suggest deeper downside risk toward:
4920 – minor support
4870 – stronger support and potential demand zone
Outlook:
Bullish bias remains intact while the silver holds above 4964. A sustained break below this level could shift momentum to the downside in the short term.
This communication is for informational purposes only and should not be viewed as any form of recommendation as to a particular course of action or as investment advice. It is not intended as an offer or solicitation for the purchase or sale of any financial instrument or as an official confirmation of any transaction. Opinions, estimates and assumptions expressed herein are made as of the date of this communication and are subject to change without notice. This communication has been prepared based upon information, including market prices, data and other information, believed to be reliable; however, Trade Nation does not warrant its completeness or accuracy. All market prices and market data contained in or attached to this communication are indicative and subject to change without notice.
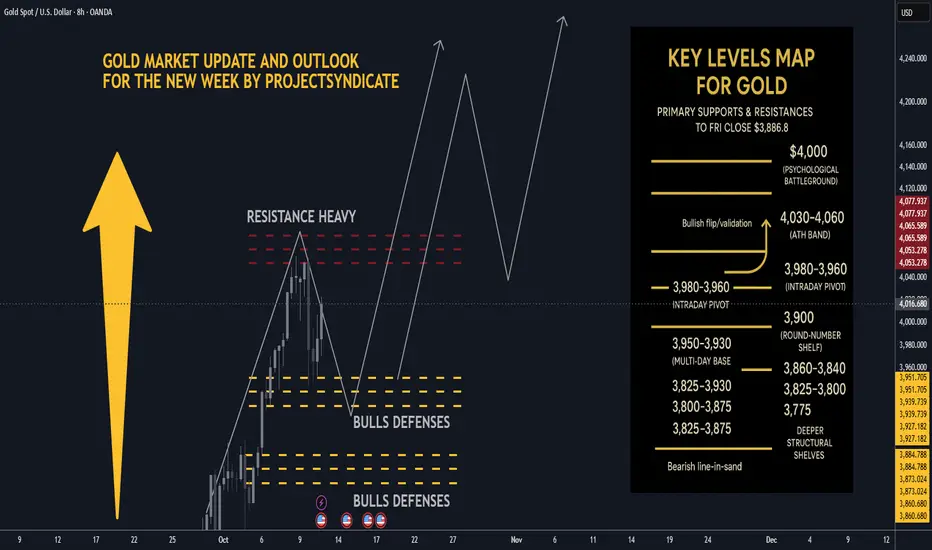
Gold next week: Key S/R Levels and Outlook for Traders🏆 Friday’s Close & Recent ATH:
Gold XAUUSD closed Friday around ~$3,990–$4,020/oz depending on venue most consolidated feeds show prints near $3.99–$4.02k at Friday close. The nearest recent intraday highs printed in the $4,030–$4,060 area across data providers this week, putting $4,000 as the immediate psychological battleground and $4,050–$4,060 as the latest short-term ATH band. YTD performance remains extraordinary 2025 YTD still showing a very large gain.
📈 Trend Structure:
Price continues to track a well-defined ascending channel on 1H/4H with clear impulsive legs out of recent consolidations. Market character = higher highs / higher lows, persistent dip-buying, and strong trend adherence into quarter-turn 25/50 handles near round thousands. Momentum has been resilient into week-end despite tariff headlines, suggesting structural demand and participation from official buyers.
🔑 Key Resistance Levels:
The most critical resistances to watch updated from Friday close ≈ $4,000:
• 4000 — immediate psychological round-number battleground.
• 4,030–4,060 — recent intraday ATH band / short-term supply recent highs printed here across venues.
• 4,075 → 4,100 — measured move / extension band if acceptance above the ATH zone occurs.
• 4,150–4,200 — stretch momentum targets on sustained risk-off and break/acceptance above 4,100 structural extension.
Quick note: different data vendors quote small differences in ticks — I used consolidated high prints to identify the ATH band.
🛡️ Support Zones:
Immediate supports step down as follows
• 3,980–3,960 intraday pivot just under Friday close.
• 3,950–3,930 multi-day base / near-week lows.
• 3,900–3,888 round-number shelf and the prior week’s consolidation band.
• Deeper structural shelves: 3,860–3,840, 3,825, 3,800 → 3,775.
A sustained break below ~3,900–3,888 would signal increasing corrective risk; daily close under ~3,825 would more clearly shift the regime.
⚖️ Likely Scenarios:
• Scenario 1 Base Case – Controlled dip toward 3,950–3,930 or the 3,900 area to reload bids, then rotation higher toward 4,030–4,060 as buyers re-engage.
• Scenario 2 Momentum Break – Quick clearance of the 4,030–4,060 ATH band → sustained acceptance above 4,075–4,100, unleashing momentum into 4,150–4,200. Overbought readings exist intraday, but structural demand has kept pullbacks shallow.
📊 Short-Term Targets:
On continuation: 4,020 → 4,030–4,060 → 4,075 → 4,100, with 4,150–4,200 as higher extensions if acceptance holds.
On retrace: 3,980 → 3,950 → 3,930 → 3,900 as the key retrace ladder.
💡 Market Sentiment Drivers updated:
• Tariff shock / geopolitical risk: President Trump announced proposals for large new tariffs reports of a 100% tariff threat and expanded export controls on Chinese imports this week, escalating trade-war risk and knocking risk sentiment — that increases safe-haven demand for gold. News outlets Reuters, AP, WaPo and market reactions were visible Friday.
• Rate & policy expectations: Markets continue to price material odds of rate easing/softer Fed path relative to earlier in the year; that reduces real yields and supports gold. Feeds and FedWatch implied pricing show elevated cut odds that underpin lower opportunity cost for gold.
• Official demand: Central bank buying has remained constructive — WGC/official stats show continued net purchases in recent months monthly buying rebounded in August. This adds structural support to dips.
• Macro/flow: Risk-off from tariff headlines, rare-earth export controls, and supply-chain concerns are the immediate drivers that could catalyze pushes toward the ATH band.
🔄 Retracement Outlook:
A tag of 3,950–3,930 or a short stop-run into 3,900–3,888 would be a typical healthy pullback inside the trend. Fast reclaim of the first support band after a liquidity flush often precedes fresh ATH tests. Breaks under 3,900 that fail to reclaim quickly increase the probability of a deeper slide into the 3,860–3,825 shelf.
🧭 Risk Levels to Watch:
• Bullish structure intact: holding above ~3,950–3,930 or more conservatively, above 3,900 keeps the bull case intact.
• Bearish line-in-sand: daily close < 3,825 weakens trend; daily close < 3,775–3,750 signals a bigger corrective phase and opens lower targets.
🚀 Overall Weekly Outlook:
Gold remains in a strong uptrend with $4,020–$4,030/ATH band $4,030–$4,060 → $4,000 as the immediate battleground after Friday’s close. Expect buyable dips while supports hold; the topside roadmap favors 4,075–4,100 and 4,150–4,200 as measured extensions if the market digests tariff news into a longer-running risk-off regime.
Silver: New ATH, Sharp Pullback, and What Comes NextLast week, something traders had been waiting for finally happened — Silver reached a new all-time high, touching 51.30 before a strong 3,000-pip selloff followed.
However, looking closely at the chart, we can see that this decline stopped precisely at the confluence of horizontal support and the ascending channel’s lower boundary — a technical level that often attracts renewed buying interest.
In my Friday’s analysis, I mentioned that although Silver looked very strong, traders should watch the ATH zone and the channel’s upper resistance for potential pullbacks. Indeed, XAGUSD reacted exactly from that area and corrected lower.
Now, things get very interesting:
1. Strong demand near $50 – Despite the initial drop on Friday, Silver built a solid floor just under the 50 level, suggesting that buyers remain in control and the recent ATH might just be a prelude to new highs.
2. Holding above the median line – The price is hovering around the channel’s midline without testing the lower boundary, a clear sign of underlying strength.
3. Potential pennant formation – Although not perfectly shaped, the price action since Thursday resembles a small pennant, which is typically a continuation pattern in bullish trends.
Putting these clues together, the technical picture still favors the upside, with confirmation coming if price sustains above the 50.50–50.70 zone.
If that happens, considering Silver’s recent momentum, we could easily see $55 as the next target in the coming week.
As long as $49 remains intact, my plan stays simple — buy the dips. 🚀
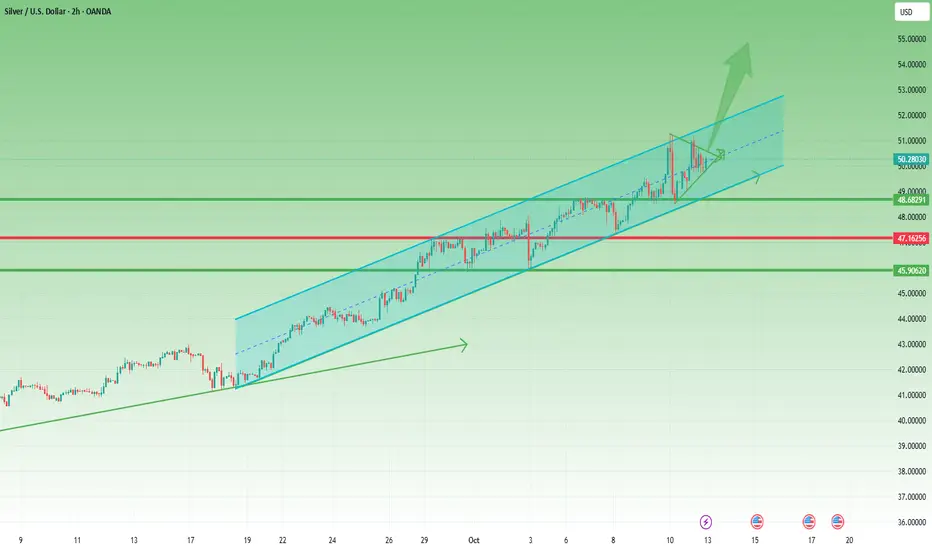
Silver XAG/USD Eyes 49+ – Uptrend Intact, Pullback Could Fuel MoHello everyone,
Silver OANDA:XAGUSD is showing a strong uptrend and appears “well-fueled” to reach the 49+ region in the short term. This rally is supported not only by technical factors but also by a volatile macro backdrop. In the US, CPI and PCE metrics, especially Core, remain key drivers: softer-than-expected readings reduce real yields, weaken the USD, and boost silver; hotter prints apply pressure.
Growth and input-cost data such as ISM/PMI (Manufacturing & Services), notably Prices Paid, influence industrial demand – electronics, solar – but extreme readings could push yields and USD higher, offsetting the impact. Fed statements and FOMC minutes are also critical: dovish tones favor silver, hawkish stances weigh on price. ETF inflows and speculative positions further support the rally, with SLV, SIVR showing strong inflows and CFTC net longs rising.
On the 4H chart, the technical structure remains robust: price stays above the ascending Ichimoku cloud, FVG steps form and partially fill, producing healthy “push-rest-push” behavior. Key levels include support at 48.05–48.20, deeper at 47.60–47.80; resistance near 48.85–49.00, then 49.40, with higher targets at 49.80–50.00.
The preferred scenario is a shallow pullback to 48.05–48.20 to gather momentum, followed by a breakout through 48.85–49.00 toward 49.40; if buying pressure persists, 49.80–50.00 is reachable. This is supported by technical alignment, Ichimoku support, FVG steps, and a favorable macro backdrop: soft CPI/PCE/ISM data or dovish Fed moves lower real yields and USD, triggering strong breakout. Even neutral news favors buy-the-dip as long as 48.05–48.20 holds . The invalidation level is a 4H close below 47.60.
What do you think – will silver push past 49+, or will it need a corrective leg first?

SILVER (XAGUSD) 15M – Bearish Rejection Setup Ahead TVC:SILVER
Structure | Trend | Key Reaction Zones
Price reached the accumulation + resistance zone, facing repeated rejections.
Structure is forming a lower-high pattern beneath the descending trendline.
If the rejection confirms, a sharp drop toward the next liquidity pool (49.00 area) can follow.
Market Overview
Silver has been ranging within a broad accumulation zone after rejecting the upper resistance region around 50.8–51.2. The market shows weakness near the top of the channel, hinting at a bearish continuation phase. If momentum fails to break above the diagonal resistance, a downside move toward 49.5–49.0 becomes highly probable before a possible reaction from the strong demand box.
Key Scenarios
✅ Bearish Case 📉 → 🎯 Target 1: 49.52 | 🎯 Target 2: 49.03 | 🎯 Target 3: 48.70
❌ Bullish Case 🚀 → 🎯 Target 1: 50.80 | 🎯 Target 2: 51.20 (if resistance breaks cleanly)
Current Levels to Watch
Resistance 🔴 : 50.80 – 51.20
Support 🟢 : 49.50 – 49.00 – 48.70
⚠️ Disclaimer: For educational purposes only. Not financial advice.
