Stop!Loss|Market View: EURUSD🙌 STOP!Loss team welcomes you❗️
In this post, we're going to talk about the near-term outlook for the EURUSD currency pair☝️
Potential trade setup:
🔔Entry level: 1.17085
💰TP: 1.15818
⛔️SL: 1.17720
"Market View" - a brief analysis of trading instruments, covering the most important aspects of the FOREX market.
👇 In the comments 👇 you can type the trading instrument you'd like to analyze, and we'll talk about it in our next posts.
💬 Description: A decline in the euro is seen as the main scenario for today, as part of a reversal from the area near 1.19000. Currently, the price is testing short-term resistance at 1.17445, where the POC (point of control) of the current downward movement is located. For a more conservative entry, it is better to use a pending order with an entry level below this resistance.
Thanks for your support 🚀
Profits for all ✅
❗️ Updates on this idea can be found below 👇
XAG USD (Silver / US Dollar)

Silver just hit a record high but a double‑top signals pullback!After a strong rally to new records spurred by safe-haven demand and new entrants, silver is now testing critical support levels near $47‑$48 amid the recent Gaza ceasefire news, forming a classic double‑top pattern that may turn into a long-term Cup & Handle that could place price action in a handle pattern for the years to come.
🔑 Key Drivers (Silver‑focused)
Technical breakout : Price breached $51, approaching the 161.8 % Fibonacci level at $47.50.
Double‑top formation : A clean double‑top suggests a near‑term correction could be on the way.
Support zone : The $47‑$48 area acts as the next major support; a break below could open the door to $45‑$46 levels.
Fibonacci retracement : The 61.8% retracement sits around $49.30, providing a potential bounce point before any deeper pullback.
Want the latest silver analyses, alerts on breakouts, and detailed chart breakdowns?
Subscribe, like, and hit the notification bell – then share in the comments your silver trade setup or questions!
This content is not directed to residents of the EU or UK. Any opinions, news, research, analyses, prices or other information contained on this website is provided as general market commentary and does not constitute investment advice. ThinkMarkets will not accept liability for any loss or damage including, without limitation, to any loss of profit which may arise directly or indirectly from use of or reliance on such information.

Silver MonthlyTarget for the next several months is ~20 usd
The sooner we hit it, the sooner we can start another bullish leg.
Short Term Targets are bullish ~23 usd
Anything can happen in this market, as JPM, Deutsche, USB, HSBC have all been fined for spoofing or manipulating the silver market in the past 3-4 years.

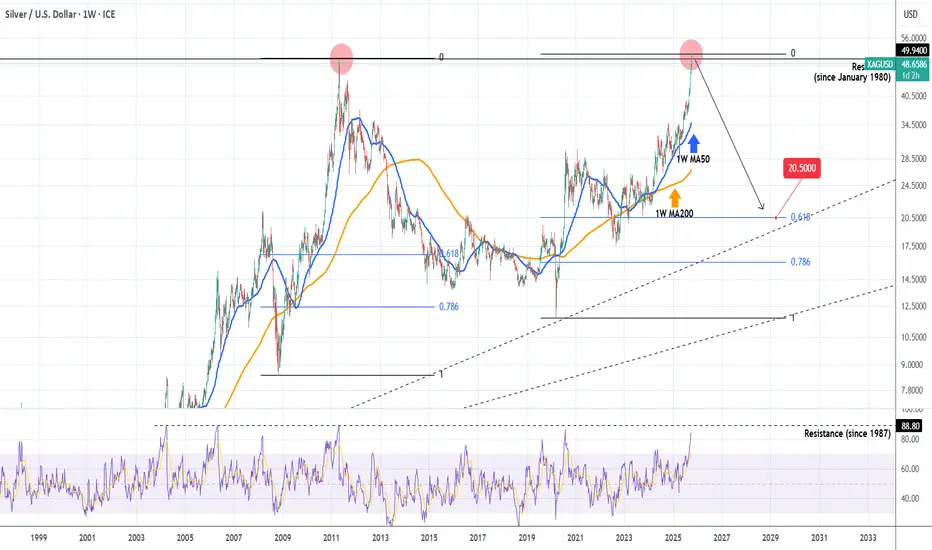
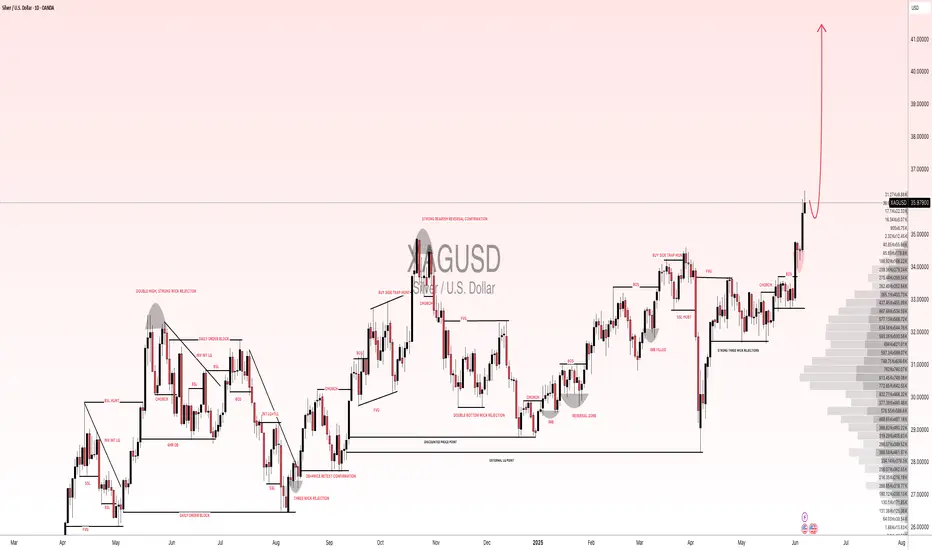
SILVER made new ATH. Multi-year Bear Cycle starting.Last time we took a look at Silver (XAGUSD) (August 22, see chart below), we had a clear buy signal on its 1D MA50 at the bottom of the Channel Up, that quickly hit our 4050 Target:
The pattern even broke aggressively upwards and this week crossed the 49.9400 Resistance, which is the All Time High (ATH) from April 18 2011. Essentially that was also the High of the long forgotten January 1980 Top!
Needless to say, cyclical behavior indicates that this is where the market sells and starts new multi-year (2-3) Bear Cycles. The 1W RSI comes to confirm that, as it is only a few points off he 88.80 Resistance, which has been the ultimate sell signal since 1987.
We expect the market to decline to at least the 0.618 Fibonacci retracement level at 20.500, which is also where the first key Higher Lows trend-line (dashed) is.
-------------------------------------------------------------------------------
** Please LIKE 👍, FOLLOW ✅, SHARE 🙌 and COMMENT ✍ if you enjoy this idea! Also share your ideas and charts in the comments section below! This is best way to keep it relevant, support us, keep the content here free and allow the idea to reach as many people as possible. **
-------------------------------------------------------------------------------
💸💸💸💸💸💸
👇 👇 👇 👇 👇 👇
XAGUSD 15M – Retracement Before Continuation TVC:SILVER
Structure | Trend | Key Reaction Zones
Silver remains in a clear bullish structure, recently facing a pullback from the 49.50 resistance zone after a strong rally from the 47.80 demand base.
Market Overview
The market printed a strong impulse leg upward followed by a healthy correction toward the 48.74–48.67 support zone, which also aligns with previous accumulation structure. As long as this zone holds, bullish continuation remains valid with buyers expected to regain control.
Key Scenarios
✅ Bullish Case 🚀 → 🎯 Target 1: 49.10 | 🎯 Target 2: 49.50 | 🎯 Target 3: 49.80
❌ Bearish Case 📉 → Break below 48.67 could extend correction toward 48.23 or 47.80.
Current Levels to Watch
Resistance 🔴: 49.10 – 49.50 – 49.80
Support 🟢: 48.74 – 48.23 – 47.80
⚠️ Disclaimer: This analysis is for educational purposes only. Not financial advice.

XAGUSD Long Setup – Target 55, Manage Risk Below 48Description:
Silver (XAGUSD) has shown strong bullish momentum, breaking multiple structure levels (BOS) and confirming a clear uptrend. The current price action suggests potential continuation toward the next resistance levels around $53.8 – $57.1, with a final target at $55.
However, if price retraces and closes below $48, it may signal exhaustion or a potential reversal, making that an appropriate exit or stop-loss level.
Trade Plan:
Entry: Current market price (~$50.6)
Take Profit: $55
Stop Loss / Exit if hit: $48
Risk–Reward Ratio: ~1.7:1
Trend Bias: Strong Bullish
Timeframe: 1D
Technical Notes:
Price has broken multiple structures and maintained higher highs and higher lows.
Momentum remains strong after BOS near $47.36.
Watch for consolidation near $51–$52 as short-term resistance.
Conclusion:
As long as silver holds above $48, the bullish structure remains intact. A push toward $55 aligns with current market momentum and Fibonacci extension targets.
OANDA:XAGUSD

Silver Market Once in a Lifetime Breakout: 120/140 USD PT📌 Base case unchanged: I’m still targeting $125–$150 within 12–24 months. The next leg of the bull run should accelerate after the all-time-high (~$49–$50) breaks and sticks. Spot is circling the mid-$40s (recent highs ~$46–$47), so the setup is in place. 💎✨
🎯 Bottom line
Silver’s structural deficit + gold leadership + policy-driven cost inflation meet a fresh technical regime. The ATH break is the ignition; $65–$75 is the first destination, and the $125–$150 12–24M target stays live if real yields drift down and PV/electronics demand stays elevated despite thrifting. Manage the whipsaws; respect $38 as the cycle guardrail. BUY/HOLD bias remains warranted. 🚀💎🔥
________________________________________
📊 Technical Outlook (2-week candles)
• Structure: Multi-year Cup & Handle from 2011 → 2020 base → 2024/25 handle. The $40 neckline break is done; a weekly/monthly close > $49.50 flips the market into price discovery.
• Levels that matter:
— Resistance: $49–$50 (ATH), then $65–$75 (measured move / vacuum), interim supply near $57–$60.
— Support: $44.5–$45 (breakout retest), $41–$42 (former cap), deeper $38 and $34 (trend break if lost).
• Momentum breadth: Higher highs on price with constructive consolidation while gold prints records → classic GSR mean-reversion tailwind. 📈⚡
________________________________________
🧭 12–24 Month Path Outlook
Base (55%) – Break & run: Close above $50 triggers trend systems and discretionary chase → extension to $65–$75 by mid-’26, stair-step into $100–$125 by late ’26/early ’27; overshoot to $150 on macro squeeze. 🚀
Alt up (15%) – Blow-off: Parabolic sprint to $85–$100 immediately post-break, sharp retrace to high-$60s, then grind to $125–$150.
Pullback (25%) – Fakeout & reload: Failure at $49–$50, mean reversion to $41–$42 or even $38, rebuild positioning; timeline slips ~1–2 quarters.
Bear tail (5%) – Macro shock: USD spike + real-yield jump + PV air-pocket; lose $34 → cycle delay (target deferred, not canceled). ⚠️
________________________________________
🚦 Catalyst Scorecard — Visible & Hidden Drivers (0–10)
1. Fed path & real yields — 9.0/10 (Bullish)
The Fed cut 25 bps on Sept 17 (now 4.00–4.25%) and signaled scope for more easing this year; several officials reinforced that bias. Lower real yields are the single strongest tailwind for non-yielding metals. 🏦
2. U.S. Dollar trend — 6.0/10 (Net-Bullish for silver)
DXY has been firm the last two weeks, a minor headwind; but with the Fed easing bias, dollar upswings look tactical, not structural. Any USD rollover clears the runway. 💵
3. Gold leadership & GSR mean-reversion — 8.5/10 (Bullish)
Gold at/near record highs ~$3.75–$3.80k keeps silver in tow. GSR ~80–84 is elevated vs. bull-market medians → skew favors silver outperformance on a gold grind. 🪙⚖️
4. Structural deficit — 8.5/10 (Bullish)
Fourth straight sizable deficit; ~678 Moz cumulative drawdown since 2021. 2025 still projected to run a ~115–120 Moz deficit despite softer bar/coin demand. 📉📦
5. Industrial demand (PV/Electronics) — 7.5/10 (Bullish with nuance)
PV/electrical demand at record highs; PV up again in 2024 (+3% y/y) and installations broadened across 38 “>1GW” countries. Offsetting force: silver thrifting (0BB, copper plating) → another 10–12% loading cut likely in 2025. Net: total ounces still robust as capacity growth outpaces thrifting… for now. ☀️🔋
6. ETP/ETF flows — 7.5/10 (Bullish)
Global silver ETPs flipped to net inflows in 2024 (+62 Moz) and kept adding into 2025. SLV shows ~15,362 tonnes in trust as of Sept 26—a sizable base of “sticky” investment metal. 📊📈
7. LBMA & COMEX stocks / liquidity premia — 7.0/10 (Bullish)
LBMA silver in London: 24,646 t (Aug) — up m/m but well below pre-2020 peaks; COMEX registered ~196 Moz. Tight-ish float + delivery frictions can widen location premia during spikes. 🏭📦
8. Tariff & logistics regime — 7.0/10 (Bullish via inflation/frictions)
U.S. 50% copper tariff (Aug 1) lifts domestic copper premia and can indirectly affect by-product silver flows and refining economics. Recent gold bar tariff confusion also showed how policy can snarl bullion logistics; LBMA welcomed clarifications, and noted silver discussions continue—headline risk persists. 🚢⚙️
9. Base-metal supply shocks (by-product linkage) — 6.5/10 (Bullish)
Grasberg disruptions and Peru protest-related shutdowns point to emerging fragility in copper output; since much silver comes as a by-product, copper hiccups can tighten silver supply at the margin. ⛏️🌍
10. Mexico policy/permitting — 6.0/10 (Bullish later, volatile now)
World’s top silver producer remains mired in regulatory overhang; exploration still depressed post-2023 reforms. Any genuine permitting thaw would be years from ounces—near-term effect is restraint. 🇲🇽📜
11. India retail/investment demand — 6.5/10 (Bullish)
Silver hitting record rupee highs; local ETFs up ~50%+ YTD; retail investment +7% y/y in H1’25. Seasonal tailwinds into festivals. 🎉🇮🇳
12. China macro & manufacturing — 5.5/10 (Mixed)
Electronics appetite is steady, PV leadership intact; property stress caps jewelry, but investment demand remains opportunistic. Net: supportive on dips, headline-sensitive. 🏗️🇨🇳
13. Systematic/CTA & options positioning — 6.0/10 (Volatility amplifier)
Trend models chased the $40 break; dealer gamma turns negative above $45–$47 at times, inviting intraday whipsaws. 🎯📉📈
14. Geopolitics (Ukraine/Mideast/Taiwan) — 5.5/10 (Event-Bullish)
Safe-haven jolts remain episodic; they matter more after the ATH triggers chase behavior. 🌍🔥
________________________________________
🧨 Hidden (under-traded) catalysts
• GSR compression trade: Once $50 breaks, programmatic rebalancing from gold to silver can accelerate relative gains. (GSR in the 60s pulls silver deeper into triple digits fast.) ⚖️💥
• By-product elasticity: Copper policy & outages (tariffs, mine incidents) can reduce silver by-product feed even as PV demand hums—this is not fully priced. 🔧⛏️
• Vault/warehouse microstructure: LBMA/COMEX stock changes vs. delivery notices can suddenly widen time/location spreads → sparks short-term basis fireworks that lift spot. 📦⏳
________________________________________
🛠️ Positioning & Execution
• Core: BUY/HOLD core metal exposure; add on $44–$45 retests; reload heavier on $41–$42.
• Breakout tactics: On a weekly close > $50, ride call spreads (e.g., $60/$90 9–15M out on SI or SLV) or risk-reversals (sell $35 puts to fund $80–$100 calls).
• Risk controls: Invalidate momentum if weekly close < $38; cut leverage.
________________________________________
🧩 Fundamental NOTES
• Spot context: XAG/USD ~$46, 52-week range ~$28–$46.7. ATH ~$49–$50 (1980/2011).
• Deficit math: Metals Focus/Silver Institute show fourth straight deficit; 2025 deficit ~117 Moz amid record industrial demand and only modest supply growth.
• Supply: 2024 mined = 819.7 Moz; 2025e ≈ 835.0 Moz (+1.9% y/y). Primary mine share keeps slipping; AISC fell in 2024 (by-product credits).
• PV nuance: Silver loadings ↓ ~10–12% in 2025e, but global PV installations broadened; total silver ounces into PV remain lofty even as intensity falls.
• Vaults/ETFs: LBMA London holdings 24,646 t (Aug). SLV metal in trust 15,361.84 t (Sep 26). COMEX registered ~196 Moz.
• Macro winds: Fed cut and may cut more in 2025 → lower real yields + easier USD path.
• Policy kicker: U.S. copper tariffs live; gold bar tariffs clarified after August confusion; silver remains under policy watch—any mis-classification can jolt premia.
________________________________________

SILVER (XAGUSD): New ATH & What is Next
Silver successfully broke through a historic resistance
based on a previous ATH.
Bullish keep pushing strong and the market may continue rising easily.
The closest strong psychological resistance is 55.0 level.
It can be reached soon.
❤️Please, support my work with like, thank you!❤️

Silver Cup &Handle Formation:Potential Breakout Towards $50–$100📊 Silver Technical Outlook (Long-Term View)
Looking at the chart, Silver is forming a **massive cup-and-handle pattern** that has been developing for over a decade. This is one of the strongest bullish continuation patterns in technical analysis.
🔑 Key Takeaways:
1. Support Zone ($40–$42):
* This area is acting as strong support on both weekly and daily timeframes.
* A swing trade from here can easily deliver 18–20% returns.
2. Resistance Breakout ($49–$50):
* If Silver gives a solid weekly/monthly close above its all-time high ($49.7) , it opens the door for a massive rally.
* The upside potential could extend towards $100 (almost 100% gains).
3. Trend Structure:
* Price action shows a steady uptrend since the 2020 lows.
* The blue curve highlights the accumulation-to-breakout phase, signaling strong bullish momentum.
4. Strategy for Traders:
* Short-Term Swing: Look for longs near $40–$42 with targets around $48–$50.
* Long-Term Position: A confirmed breakout above $50 could be held for a much larger move towards $75–$100.
⚠️ Risk Note: Always manage position sizing—false breakouts are possible before the big move.

$50 Silver and $4000 GoldCongratulations, everyone! 🎉
Silver has finally reached our long-term target $50, marking a new historical high. It’s been quite a ride!
From here, in the $50–$56 range, I’d start gradually locking in some profits, carefully and patiently.
In case we get a correction, I’m looking at the $39–$42 zone as a potential retracement area.
The best mid-term scenario would be a healthy consolidation between $45 and $50, followed by another leg higher.
The worst case scenario would be a drop toward $34, which could coincide with a broader stock market correction, considering that 55–60% of silver demand comes from industrial use.
Cheers! 🍻

Silver hits new record!Silver hits $50, breaking 2011's record high. The precious metal is now up 73% so far in 2025, outpacing both gold (53%) and S&P (14.5%). How high can it go? or will we se a dip first? In any case, trend is strong and we wouldn't advise fighting it.
By Fawad Razaqzada, market analyst with FOREX.com

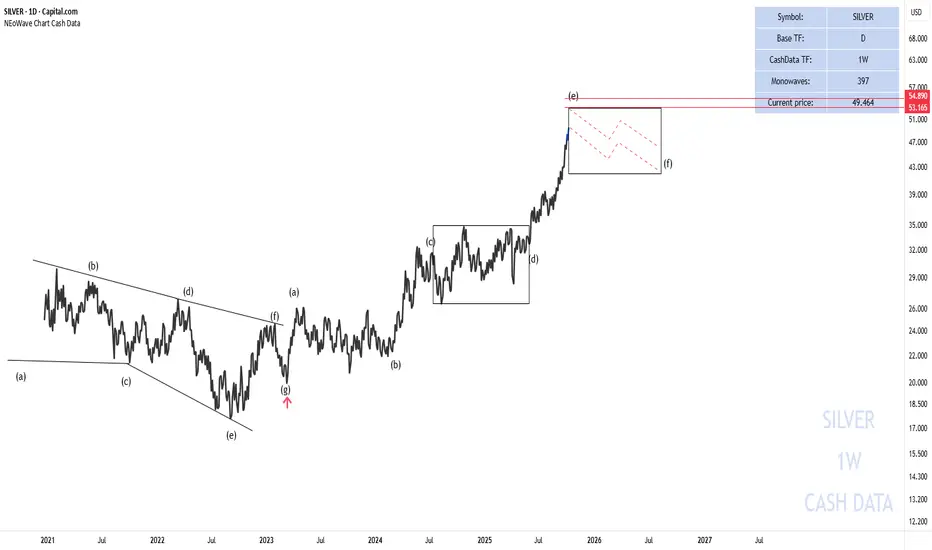
SILVER target based on NEoWave
Based on the weekly cash data, it appears that the trend that began on March 9, 2023, is developing into a diametric pattern, and we are currently in its Wave (e). I expect Wave (f) of the diametric to start from the current prices or the $53–$56 range.
Good luck
NEoWave Chart
Gold/Silver ratio. Chose either gold or silver or both? 9/Oct/25Gold ( XAUUSD ) and Silver ( XAGUSD ) chart ratio.. What do you think silver price will be when Gold/Silver ratio drop to 30? When Gold at ≈ 4500 by early 2026? 4500/62 ≈ 72?! or 10,000 / 50 ≈ 333?! by 2033?

Stop!Loss|Market View: GBPUSD🙌 Stop!Loss team welcomes you❗️
In this post, we're going to talk about the near-term outlook for the GBPUSD currency pair☝️
Potential trade setup:
🔔Entry level: 1.33901
💰TP: 1.32752
⛔️SL: 1.35128
"Market View" - a brief analysis of trading instruments, covering the most important aspects of the FOREX market.
👇 In the comments 👇 you can type the trading instrument you'd like to analyze, and we'll talk about it in our next posts.
💬 Description: The price again fell below the 1.34000 area after forming an accumulation. This situation suggests that sellers are once again attempting a decline to 1.33500 and maybe to 1.31600. The local downtrend is also indicated by the moving averages' crossover.
Thanks for your support 🚀
Profits for all ✅
❗️ Updates on this idea can be found below 👇

SILVER Free Signal From ATH! Sell!
Hello,Traders!
SILVER hovers just below its all-time high at 50$, showing clear signs of exhaustion as Smart Money distributes near premium pricing. A short-term correction is likely as liquidity above is swept and price seeks rebalancing. Time Frame 3H.
-------------------
Stop Loss: 50.06$
Take Profit: 47.74$
Entry: 48.87$
Time Frame: 3H
-------------------
Sell!
Comment and subscribe to help us grow!
Check out other forecasts below too!
Disclosure: I am part of Trade Nation's Influencer program and receive a monthly fee for using their TradingView charts in my analysis.

SILVER (XAGUSD) – 15M | Strong Support Holding, Bullish ContinuTVC:SILVER
Market Overview
Silver took a quick rejection from the 48.70 resistance zone and corrected downward into the major support.
Price is now consolidating around 47.50, a key level that previously sparked bullish impulses.
If this level holds, momentum may shift again toward the upper range — signaling a potential bullish continuation phase.
Key Scenarios
✅ Bullish Case 🚀 →
🎯 Target 1: 47.80
🎯 Target 2: 48.23
🎯 Target 3: 48.70 (resistance retest)
❌ Bearish Case 📉 →
Invalidation if price closes below 47.30 (support breakdown).
Current Levels to Watch
Resistance 🔴: 48.23 / 48.70
Support 🟢: 47.40 / 47.50
⚠️ Disclaimer: This analysis is for educational purposes only. Not financial advice.

Gold ATH – Uncle Jimmy, Silver Momentum & The Market Signal🏆📈 Gold ATH – Uncle Jimmy, Silver Momentum & The Market Signal 🧠🪙
Welcome to Episode 2 of “When Gold Believers Flip.”
Gold has officially broken to all-time highs , and Uncle Jimmy’s quiet rotation into silver suddenly looks like genius…
🟡 GOLD (XAUUSD)
Gold just printed a fresh all-time high at $4,068 🔥
Technically, I still hold a long-term target at $4,489, but the market is overextended.
📉 Game plan:
I’ll only consider shorting below $3,983.
🎯 Short setup:
• Entry: Below $3,983
• Stop-loss: $4,015
Until that trigger hits, bulls remain in control — but risk is rising.
⚪ SILVER (XAGUSD)
Now here’s where it gets juicy.
Remember Uncle Jimmy — the 30-year gold maxi?
This summer, he shocked everyone:
“I’m selling gold to buy silver.” 💬🪙
Guess what? He might’ve nailed it.
Silver is now trading at $48.97, just shy of historical resistance:
🏆 $49.83 (Jan 18, 1980)
✴️ $49.51 (Apr 25, 2011)
🎯 Target: $50.03
But this move is more than a breakout — it’s a sentiment shift.
🧠 The Macro Signal
Yesterday:
🟡 Gold ↑, Silver ↓ = Defensive positioning → not great for markets.
Today:
⚪ Silver ↑, Gold ↓ = Risk appetite returning → bullish tone across assets.
That’s a tailwind for:
• Nasdaq
• Bitcoin
• Broad markets
Silver is part money, part industrial metal — when it leads, optimism rises.
🔁 The Rotation Is Real
📉 Gold looks tired (recent action says not; but my analysis says it is)
🪙 Silver is shining
₿ Bitcoin is waiting
📊 Nasdaq is leading
When hard-money believers like Uncle Jimmy flip...
Pay attention.
Watch the metals.
Watch the sentiment.
This is how macro mood shifts begin.
Mindset Check 🧘
When veterans change conviction, it’s rarely random. Markets evolve — the smartest adapt. Don’t cling to narratives; flow with signals.
One Love,
The FXPROFESSOR 💙
Disclaimer: These charts and analyses reflect my personal opinion only. I am not a financial advisor. Nothing here is financial advice. Trading involves risk, and you are fully responsible for your own decisions. Trade wisely.

Stop!Loss|Market View: SILVER🙌 Stop!Loss team welcomes you❗️
In this post, we're going to talk about the near-term outlook for SILVER ☝️
Potential trade setup:
🔔Entry level: 52.13310
💰TP: 47.21585
⛔️SL: 54.64486
"Market View" - a brief analysis of trading instruments, covering the most important aspects of the FOREX market.
👇 In the comments 👇 you can type the trading instrument you'd like to analyze, and we'll talk about it in our next posts.
💬 Description: Metals are likely to form new highs in the short term. Silver is expected to approach 50-51, with a reversal expected near this historical resistance level, but most likely not immediately. Manipulation toward 52-53 is not ruled out. The mid- and long-term priorities are currently in favor of selling. For this, a potential aggressive sell scenario is anticipated to occur near the 52-level. However, it is best to wait for a potential entry point near this price point.
Thanks for your support 🚀
Profits for all ✅
❗️ Updates on this idea can be found below 👇

Stop!Loss|Market View: GOLD🙌 Stop!Loss team welcomes you❗️
In this post, we're going to talk about the near-term outlook for GOLD ☝️
Potential trade setup:
🔔Entry level: 3955.780
💰TP: 3868.617
⛔️SL: 4015.272
"Market View" - a brief analysis of trading instruments, covering the most important aspects of the FOREX market.
👇In the comments👇 you can type the trading instrument you'd like to analyze, and we'll talk about it in our next posts.
💬 Description: Gold manipulation continues and will likely continue until the end of the US shutdown, or a potential peace settlement in the Middle East could reverse the current manipulative behavior in the metal too. Today, it is exceedingly challenging to identify potential entry points. However, in the near future, the 3955 area is interesting for potential sell trades, as it is the location of buyers' stop levels. If this occurs, it will result in a decline toward 3867. This situation would indicate a highly likely reversal of the local uptrend, which would stimulate selling in the mid-term.
Thanks for your support 🚀
Profits for all ✅
❗️ Updates on this idea can be found below 👇

Stop!Loss|Market View: NZDUSD🙌 Stop!Loss team welcomes you❗️
In this post, we're going to talk about the near-term outlook for the NZDUSD currency pair☝️
Potential trade setup:
🔔Entry level: 0.58228
💰TP: 0.57555
⛔️SL: 0.58856
"Market View" - a brief analysis of trading instruments, covering the most important aspects of the FOREX market.
👇 In the comments 👇 you can type the trading instrument you'd like to analyze, and we'll talk about it in our next posts.
💬 Description: In the medium term, the Australian and New Zealand currencies are viewed as especially pessimistic. Historically, these two major currencies have demonstrated a more effective decline, meaning a more effective strengthening of the USD. Short-term sell opportunities are near the 0.58485 area, but sell from current prices toward the local minimum of 0.57550 is also possible.
Thanks for your support 🚀
Profits for all ✅
❗️ Updates on this idea can be found below 👇

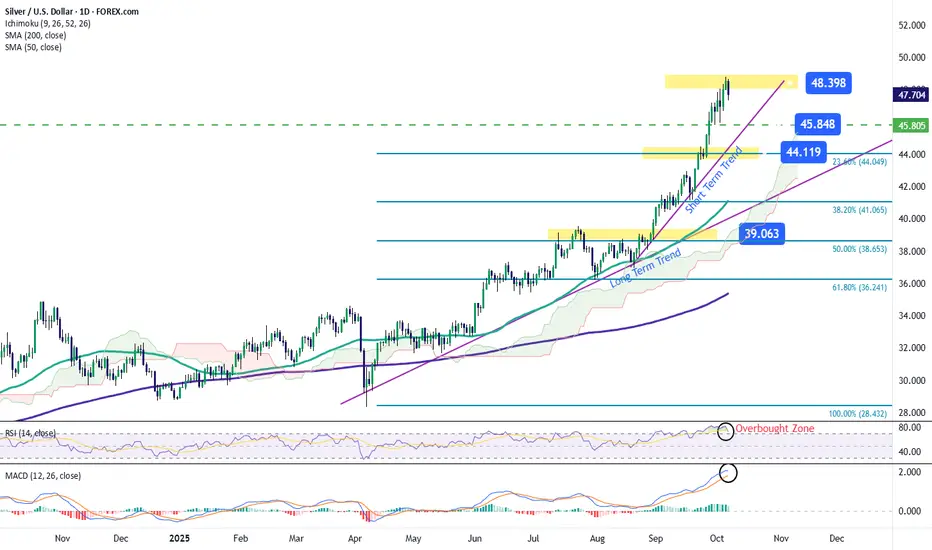
Silver Pulls Back from Recent HighsDuring the current session, silver has started to retreat from its recent highs, posting a decline of more than 2.4% in the short term. This movement has led to a renewed bearish bias in price action, driven mainly by the strengthening of the U.S. dollar. The DXY Index, which measures the dollar’s performance against other major currencies, remains above the 98-point level, reflecting a renewed firmness of the greenback. This strength has reduced investor appetite for precious metals, limiting silver’s upward momentum. If the dollar continues to strengthen, selling pressure on silver could intensify in the coming sessions.
Short-Term Uptrend Remains Intact
Since late August, silver has maintained a pronounced upward trend that remains dominant in the short term. Although some bearish corrections have been observed, they have not yet signaled a structural change in the trend. Therefore, as long as no clear selling signals emerge, the bullish structure continues to be the key pattern to watch at this stage.
RSI
The RSI line continues to hover near the overbought level (70), reflecting an imbalance caused by the recent surge in buying momentum. This could lead to price exhaustion and short-term downward corrections if the overbought condition persists.
MACD
The MACD histogram remains above the zero line, confirming a dominant bullish momentum in recent sessions. However, the MACD and signal lines are beginning to converge, which could foreshadow a bearish crossover and indicate exhaustion in the upward impulse. If this crossover occurs, the market could enter a period of indecision, leaving room for more pronounced pullbacks in the short term.
Key Levels to Watch:
$48 per ounce – Resistance: Corresponds to the recent peak reached by silver. A sustained move above this level could trigger a stronger bullish trend and reinforce a dominant buying bias.
$45 per ounce – Intermediate Resistance: Represents a technical barrier that could limit upside momentum and serve as a potential pivot zone for short-term corrections.
$44 per ounce – Key Support: Aligns with the 23.6% Fibonacci retracement level, acting as the most relevant short-term support. A break below this level could threaten the current bullish trend and shift the outlook toward a more pronounced bearish bias.
Written by Julian Pineda, CFA – Market Analyst
XAGUSD(SILVER):To $60 the silver is new gold, most undervaluedSilver has shown remarkable bullish behaviour and momentum, in contrast to gold’s recent decline. Despite recent news, silver remains bullish and unaffected by these developments. We anticipate that silver will reach a record high by the end of the year, potentially reaching $60.
There are compelling reasons why we believe silver will be more valuable in the coming years, if not months. Firstly, the current price of silver at 36.04 makes it the most cost-effective investment option compared to gold. This presents an attractive opportunity for retail traders, as gold may not be suitable for everyone due to its nature and price.
Silver’s price has increased from 28.47 to 36.25, indicating its potential to reach $60 in the near future. We strongly recommend conducting your own analysis before making any trading or investment decisions. Please note that this analysis is solely our opinion and does not guarantee the price or future prospects of silver.
We appreciate your positive feedback and comments, which encourage us to provide further analysis. Your continuous support over the years means a lot to us.
We wish you a pleasant weekend.
Best regards,
Team Setupsfx
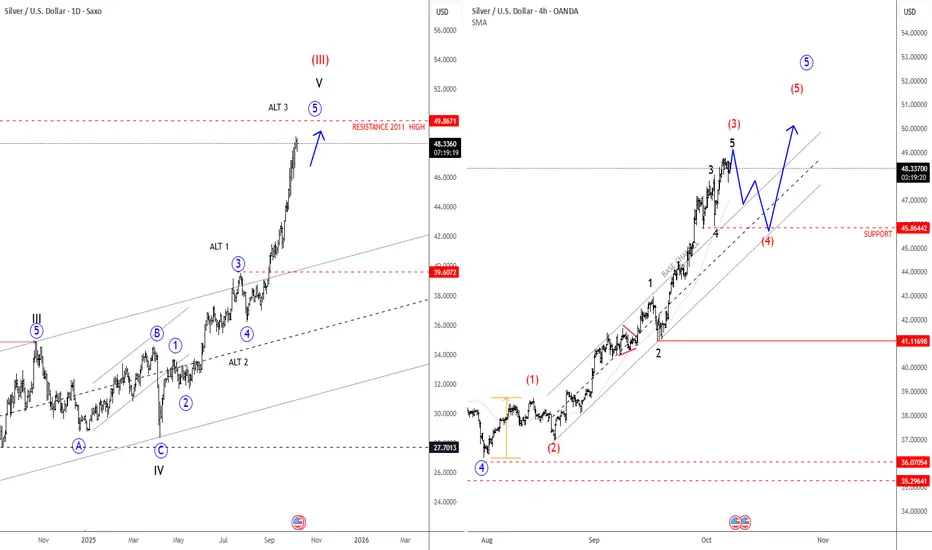
Silver Is Extending Impulsively Higher; All-Time Highs SoonSilver Is Extending Impulsively Higher, which can push the price into all-time highs from a technical point of view and by Elliott wave model.
Silver is on the rise and has been outperforming gold quite a lot over the last week, and it looks like an extended leg up is still in progress; seems like wave three of an extended impulse, therefore more gains are possible after next three-leg retracement. Based on the 4-hour chart, there is a chance that price goes towards 50usd, but there can be some new pullback first. Ideally red wave (4) could stabilize near 45.86. Only a sharp impulse down closer to 43 level will be an indication that higher degree wave four has started.
Higher Time frame charts show an ongoing bull cycle that is now targeting the high from April 2011, which could be the next major level and a potential area for a new retracement, maybe sometime in 2026.