Stop!Loss|Market View: USDJPY🙌 Stop!Loss team welcomes you❗️
In this post, we're going to talk about the near-term outlook for the USDJPY currency pair☝️
Potential trade setup:
🔔Entry level: 148.918
💰TP: 151.289
⛔️SL: 147.342
"Market View" - a brief analysis of trading instruments, covering the most important aspects of the FOREX market.
👇 In the comments 👇 you can type the trading instrument you'd like to analyze, and we'll talk about it in our next posts.
💬 Description: The price has returned to the previously formed accumulation below the 149 level. Despite this, buy prioraty is saved. The market context continues to indicate that buyers are more likely to be strong than sellers. Two buying scenarios are being looked for (see chart). The primary scenario is a potential trade on a breakout of the 149 area, while the alternative scenario is the formation of another false breakout of the lower accumulation border at 146.300 - 149.
Thanks for your support 🚀
Profits for all ✅
❗️ Updates on this idea can be found below 👇
XAG USD (Silver / US Dollar)

Will US government shutdown add further fuel to silver’s rally?
Concerns over a weakening US labor market, expectations for further Fed rate cuts, and heightened government shutdown risks have fueled sustained demand for silver as a safe haven.
September ADP private payrolls fell by 32,000, the steepest drop since March 2023, while August figures were sharply revised from a 54,000 gain to a 3,000 loss, underscoring labor market softness.
Meanwhile, the shutdown has officially begun after bipartisan talks failed to reach an agreement, with the key uncertainty now being its duration. A shutdown lasting more than a month could have widespread economic repercussions.
XAGUSD sustains its uptrend above EMA21. The diverging EMAs indicate to a potential expansion of bullish momentum. If XAGUSD closes above EMA21, the price may advance toward the psychological resistance at 48.00. Conversely, if XAGUSD breaks below EMA21, the price could retreat toward the support at 46.00.

SILVER (XAGUSD): ALL-TIME HIGH AHEAD!
A bullish rally may temporarily stop soon as Silver
is approaching a major resistance cluster based on a current All-Time High.
48.0 - 50.0 zone will be an important structure from where the market may retrace.
After a pullback from that, be ready for another bullish wave and a breakout of the underlined area.
❤️Please, support my work with like, thank you!❤️
I am part of Trade Nation's Influencer program and receive a monthly fee for using their TradingView charts in my analysis.

Silver Price: October Kicks Off with a 14-Year HighSilver Price: October Kicks Off with a 14-Year High
As the XAG/USD chart shows, today silver prices climbed above the $47.50 per ounce mark for the first time since 2011. Since the beginning of the month, silver has appreciated by approximately 15%.
Why is silver rising?
According to media reports, demand for so-called safe-haven assets has intensified amid the US government shutdown, which officially began on 1 October. President Trump has placed the blame on Democrats, while maintaining optimism that the shutdown could be leveraged to streamline the work of federal agencies.
Trading Economics further highlights that the Silver Institute forecasts a deficit in the global silver market. Production is expected at 844 million ounces – around 100 million ounces short of demand, which continues to be driven by the expansion of solar energy, consumer electronics, and data centres.
Technical analysis of the XAG/USD chart
On 22 September, when analysing the XAG/USD chart, we:
→ Drew a long-term upward blue channel, along with a steeper orange channel indicating accelerated growth.
→ Noted that the silver price had broken above the upper boundary of the blue channel and suggested that XAG/USD was in a vulnerable position for a potential correction.
Shortly thereafter (as shown by the red arrow), the price encountered resistance. However, it was insufficient to trigger a pullback, as the upper boundary of the blue channel acted as support (S), allowing silver to continue its ascent within the orange channel.
Yesterday, when reviewing the gold chart, we noted a sharp decline in precious metals at the start of Monday’s session. Although bulls managed to recover during the US session (signalling robust demand), bears remain present – underscored by today’s failure to hold above Monday’s high (marked by the black arrow).
Applying any oscillator (such as RSI) will likely reveal signs of bearish divergence, pointing to a weakening bullish momentum.
Taking the above into account, we could assume that:
→ The market remains bullish. While demand forces may be losing steam, the momentum of the rally could continue to play a significant role.
→ A correction is possible – for example, towards the lower boundary of the orange channel (S2), which is reinforced by a bullish FVG (an imbalance zone favouring buyers).
This article represents the opinion of the Companies operating under the FXOpen brand only. It is not to be construed as an offer, solicitation, or recommendation with respect to products and services provided by the Companies operating under the FXOpen brand, nor is it to be considered financial advice.

Silver To Hit $55? XAGUSD AnalysisSilver (XAGUSD) is clearly in a strong bullish trend on the daily chart. The price has broken out of previous resistance levels and continues to form higher highs and higher lows. The breakout above the $43.70–$44.00 zone shows strong demand, and daily candles are closing near their highs, which reflects strong buyer dominance. As long as price holds above the $43.70 support, momentum favors further upside.
The next major resistance sits around $50.00, followed by $52.50, and an extended move could test $55.00. Momentum indicators and price action confirm buyers are in control, with no significant bearish reversal patterns showing yet.
Trade Setup 📈
• Entry: $47.30 – $47.40
• Stop Loss: $43.70 ❌
• Target 1: $50.00 🎯
• Target 2: $52.50 🔥
• Target 3: $55.00 🏆
This setup offers a favorable risk-to-reward of around 1:2, with continuation potential if bullish momentum stays intact.

Stop!Loss|Market View: GOLD🙌 STOP!Loss team welcomes you❗️
In this post, we're going to talk about the near-term outlook for GOLD ☝️
Potential trade setup:
🔔Entry level: 3811.880
💰TP: 3654.765
⛔️SL: 3915.820
"Market View" - a brief analysis of trading instruments, covering the most important aspects of the FOREX market.
👇 In the comments 👇 you can type the trading instrument you'd like to analyze, and we'll talk about it in our next posts.
💬 Description: Sell priority is looking for gold, and there are two scenarios (see chart). Technically, we're witnessing a buying culmination, and a downward reversal is likely coming soon. The main target is seen near the POC, specifically the 3654 level. In the longer term, deeper targets are likely to be looked for.
Thanks for your support 🚀
Profits for all ✅
❗️ Updates on this idea can be found below 👇

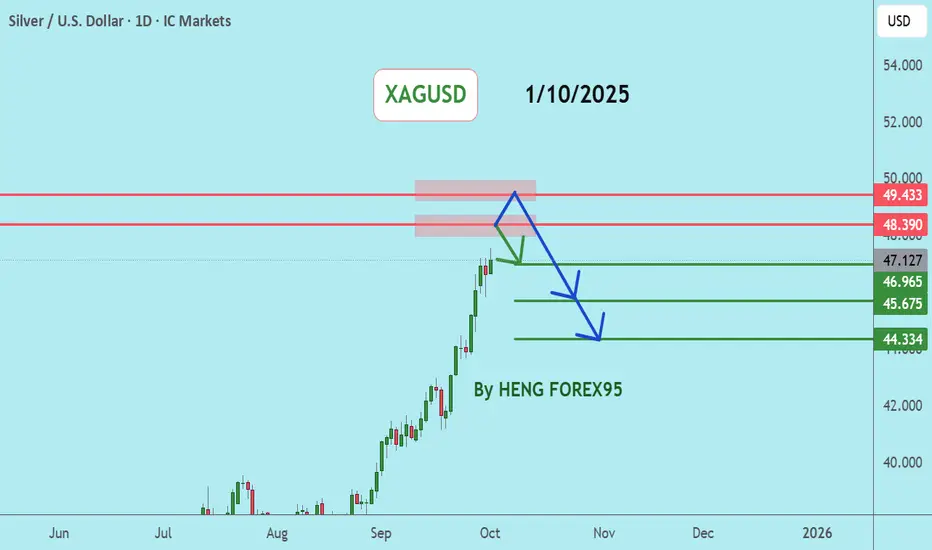
Silver Analysis – Multi-Year Highs but Correction LoomsSeptember has been a remarkable month for Silver, with prices running from the 40 zone all the way to 47.50, marking an impressive 20% gain and printing a new multi-year high.
Just like Gold, the long-term trend remains strongly bullish – no doubts there.
However, also like Gold, the recent rally looks overstretched, and history tells us that sharp corrections often follow such aggressive moves.
Yesterday, after touching above 47, Silver sold off hard and dipped to an intraday low of 45.78. Bulls quickly stepped back in, and overnight the market managed to print new highs around 47.57.
For now, the price remains elevated, but with correction looming, I believe the bearish side will eventually prevail in the short-term.
🔑 Technical Perspective:
• Key support to watch: 46.80.
• If this level fails to hold, we could see a stronger sell-off than yesterday’s, with the most appropriate near-term target sitting around 45.00.
🚀 As always, the market needs to confirm, but at these elevated levels, caution is warranted for late buyers.
XAGUSDSilver price is in a strong uptrend. The price has a chance to test the 48.39-49.75 level, which is a key resistance zone. If the price cannot break through the 49.75 level, it is expected that the price has a chance to go down in the short term. Consider selling in the red zone.
🔥Trading futures, forex, CFDs and stocks carries a risk of loss.
Please consider carefully whether such trading is suitable for you.
>>GooD Luck 😊
❤️ Like and subscribe to never miss a new idea!
SILVER Free Signal! Sell!
Hello,Traders!
SILVER Triple-top rejection at premium levels confirms distribution phase. SMC shows liquidity sweep above highs before sharp drop through neckline, shifting order flow bearish.
-------------------
Stop Loss: 4,721$
Take Profit: 4,537$
Entry: 4,632$
Time Frame: 3H
-------------------
Sell!
Comment and subscribe to help us grow!
Check out other forecasts below too!
Disclosure: I am part of Trade Nation's Influencer program and receive a monthly fee for using their TradingView charts in my analysis.

Silver Bullish breakout support at 4595The Silver remains in a bullish trend, with recent price action showing signs of a continuation breakout within the broader uptrend.
Support Zone: 4595 – a key level from previous consolidation. Price is currently testing or approaching this level.
A bullish rebound from 4595 would confirm ongoing upside momentum, with potential targets at:
4745 – initial resistance
4822 – psychological and structural level
4886 – extended resistance on the longer-term chart
Bearish Scenario:
A confirmed break and daily close below 4595 would weaken the bullish outlook and suggest deeper downside risk toward:
4555 – minor support
4525 – stronger support and potential demand zone
Outlook:
Bullish bias remains intact while the silver holds above 4595. A sustained break below this level could shift momentum to the downside in the short term.
This communication is for informational purposes only and should not be viewed as any form of recommendation as to a particular course of action or as investment advice. It is not intended as an offer or solicitation for the purchase or sale of any financial instrument or as an official confirmation of any transaction. Opinions, estimates and assumptions expressed herein are made as of the date of this communication and are subject to change without notice. This communication has been prepared based upon information, including market prices, data and other information, believed to be reliable; however, Trade Nation does not warrant its completeness or accuracy. All market prices and market data contained in or attached to this communication are indicative and subject to change without notice.

Potential long for XAGUSD/SilverLooking for a new potential entry for silver. Silver is really bullish, and im looking to buy and ride the price up to potential new ATH

Silver bullish breakout supported at 4440The Silver remains in a bullish trend, with recent price action showing signs of a continuation breakout within the broader uptrend.
Support Zone: 4440 – a key level from previous consolidation. Price is currently testing or approaching this level.
A bullish rebound from 4440 would confirm ongoing upside momentum, with potential targets at:
4570 – initial resistance
4615 – psychological and structural level
4650 – extended resistance on the longer-term chart
Bearish Scenario:
A confirmed break and daily close below 4440 would weaken the bullish outlook and suggest deeper downside risk toward:
4406 – minor support
4380 – stronger support and potential demand zone
Outlook:
Bullish bias remains intact while the silver holds above 4440. A sustained break below this level could shift momentum to the downside in the short term.
This communication is for informational purposes only and should not be viewed as any form of recommendation as to a particular course of action or as investment advice. It is not intended as an offer or solicitation for the purchase or sale of any financial instrument or as an official confirmation of any transaction. Opinions, estimates and assumptions expressed herein are made as of the date of this communication and are subject to change without notice. This communication has been prepared based upon information, including market prices, data and other information, believed to be reliable; however, Trade Nation does not warrant its completeness or accuracy. All market prices and market data contained in or attached to this communication are indicative and subject to change without notice.

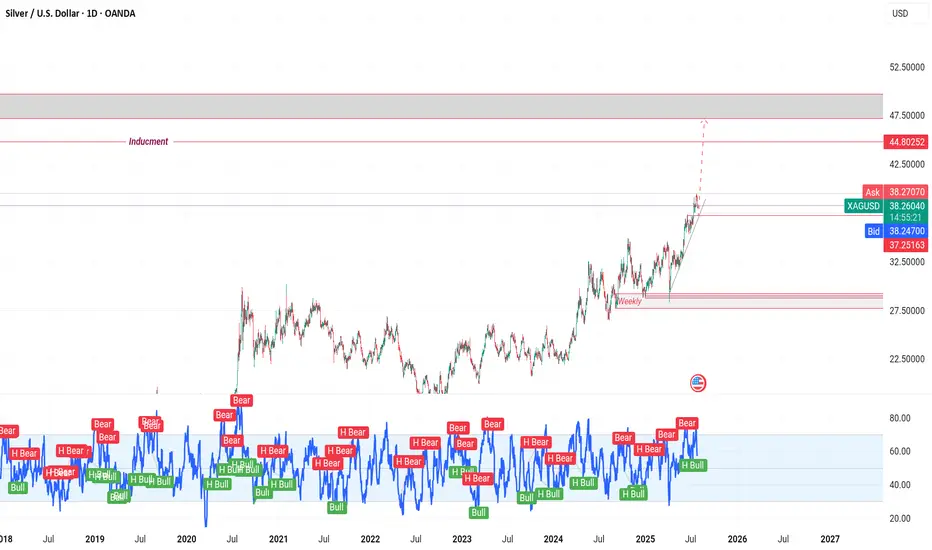
XAG/USD on high time frame
"Hello, for investors in XAG/USD, the $37 zone appears to be a low-risk area for buying. Both technical and fundamental analyses suggest that the price is likely to move higher towards $48."
If you require further insights or have additional information to discuss, feel free to share!
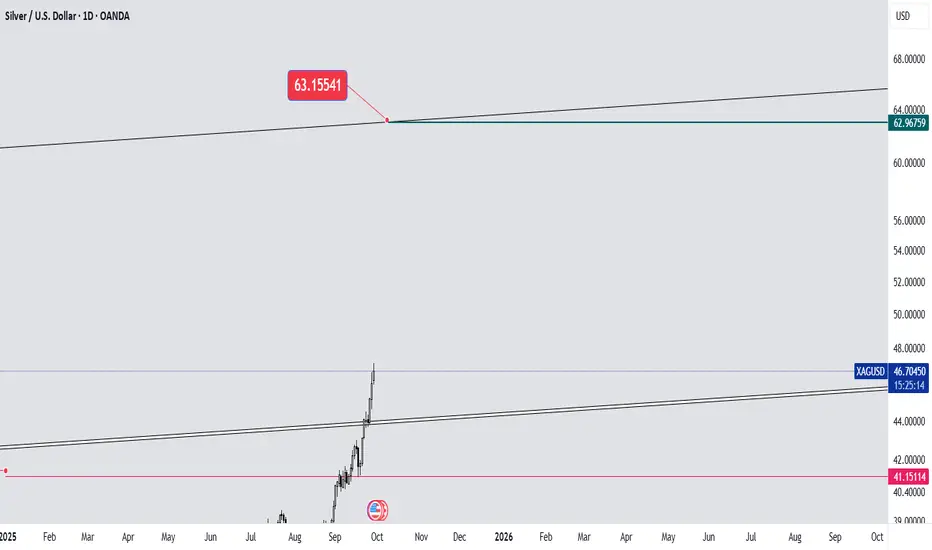
What is seen in the silver chart!!!The prospect of $62 per ounce of silver is very much on the horizon, but will this price growth be as fast as the price of silver has ever seen? You can read the factors that contribute to the realization of this prospect after reviewing international articles, but I do not think it will be too early to reach this silver rate!
Gold | Oil | Dollar | Silver | Natural Gas Price ForecastGold | Oil | Dollar | Silver | Natural Gas Price Forecast
AMEX:UNG AMEX:BOIL AMEX:KOLD COMEX:SI1!

SILVER: Expecting Bearish Movement! Here is Why:
Looking at the chart of SILVER right now we are seeing some interesting price action on the lower timeframes. Thus a local move down seems to be quite likely.
Disclosure: I am part of Trade Nation's Influencer program and receive a monthly fee for using their TradingView charts in my analysis.
❤️ Please, support our work with like & comment! ❤️

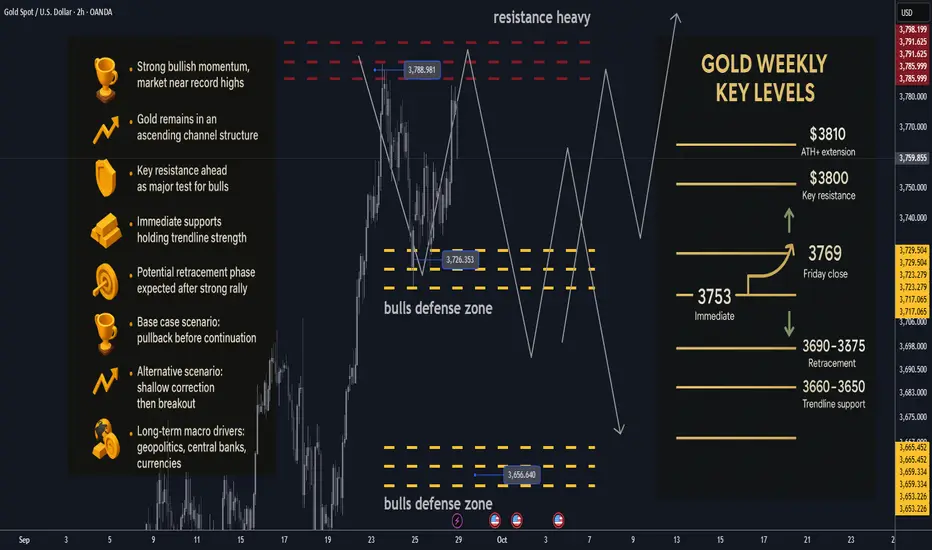
Gold next week: Key S/R Levels and Outlook for Traders🏆 Friday’s Close & Recent ATH: Gold closed the week near $3,769, not far from its latest all-time high ($3,734) as bullish momentum continues to dominate. Every dip is being met with strong buying interest, reinforcing the uptrend.
📈 Trend Structure: The market remains firmly inside an ascending channel on both 1H and 4H charts. The broader structure is bullish, with corrections appearing as healthy consolidations rather than reversals.
🔑 Key Resistance Levels: T he most critical resistance sits at $3,800, a psychological and technical barrier. Beyond that, $3,810–3,820 represents potential breakout extension targets if bulls push through.
🛡️ Support Zones: Immediate support rests at $3,753–3,755, aligned with a rising trendline. Deeper supports lie at $3,690–3,675, with stronger downside protection at $3,660–3,650. A sustained break below $3,650 would signal deeper correction risk.
⚖️ Likely Scenarios:
o Scenario 1 (Base Case) – A short-term pullback toward support before continuation higher.
o Scenario 2 – A shallow correction, followed by a direct breakout above $3,800.
Probabilities currently favor Scenario 1 due to overbought conditions.
📊 Short-Term Targets: On continuation, upside levels to monitor are $3,740 → $3,780 → $3,800, with a possible push toward $3,810 ATH+ extension.
💡 Market Sentiment Drivers: Geopolitical tensions, central bank accumulation, and persistent currency debasement concerns remain key macro tailwinds. These factors underpin the long-term bullish bias, despite near-term choppiness.
🔄 Retracement Outlook: Analysts suggest a retracement is due after the strong run-up. A controlled dip into the $3,660–3,640 zone could offer buying opportunities for swing traders targeting another leg higher.
🧭 Risk Levels to Watch: Holding above the ascending trendline (around $3,630–3,640) keeps the bullish structure intact. A decisive break below this area could trigger a deeper correction toward channel midpoints.
🚀 Overall Weekly Outlook: Gold remains in a strong bullish trajectory with $3,800 as the major battleground. Expect short-term pullbacks, but the path of least resistance is still higher, with long-term prospects pointing toward $4,000.
SILVER Hitting ALL-TIME-HIGH 50$! EPIC!
Guys!
While everyone was obsessed with Gold for obvious reasons, Silver quietly made 300%!!! since 2020, and more than 65% in 2025 alone. Bitcoin? How about Silver baby?! And I am not surprised. I've been telling everyone who'd listen that Silver is epically Undervalued and here we are at an all-time-high again. From where we are bound to see a good correction.
But make no mistake! Silver will keep growing, along with Gold in the coming years and the coming I will treat the coming correction as a way to buy MORE Silver!
Precious metals are out past, present and future with no real replacement, and I oh boy will I be buying the dip!

SILVER What Next? SELL!
My dear followers,
I analysed this chart on SILVER and concluded the following:
The market is trading on 4606.0 pivot level.
Bias - Bearish
Technical Indicators: Both Super Trend & Pivot HL indicate a highly probable Bearish continuation.
Target - 4537.7
Safe Stop Loss - 4644.6
About Used Indicators:
A super-trend indicator is plotted on either above or below the closing price to signal a buy or sell. The indicator changes color, based on whether or not you should be buying. If the super-trend indicator moves below the closing price, the indicator turns green, and it signals an entry point or points to buy.
Disclosure: I am part of Trade Nation's Influencer program and receive a monthly fee for using their TradingView charts in my analysis.
———————————
WISH YOU ALL LUCK

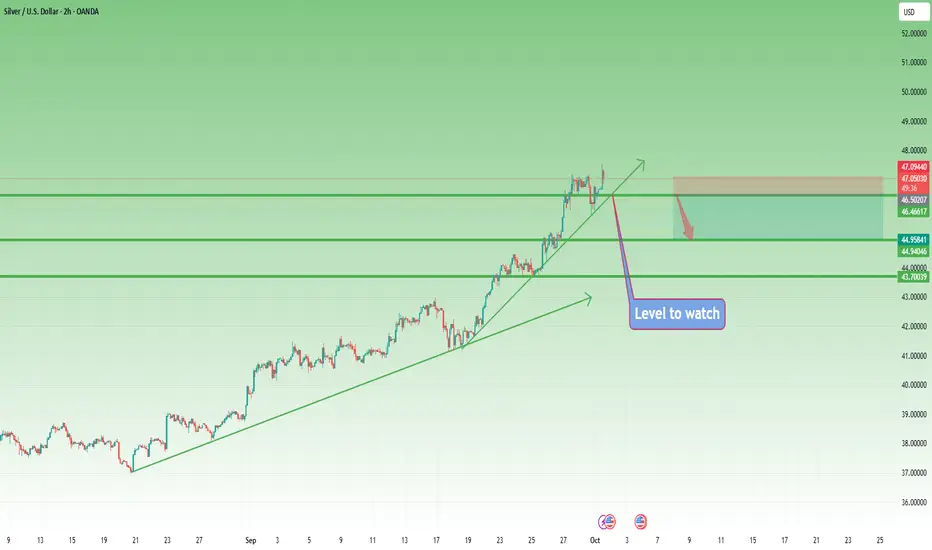
XAG/USD | Silver Rally Continues – Bulls Eye $44.60 & $44.80! By analyzing the Silver chart on the 2-hour timeframe, we can see that after correcting down to $43.34, the price gained demand again and rallied more than 2.5%, reaching $44.47.
Currently, silver is trading around $44.16. If the price breaks above $44.49, we could see another push higher, first retesting $44.47, and then aiming for $44.60 and $44.80 as the next targets.
Please support me with your likes and comments to motivate me to share more analysis with you and share your opinion about the possible trend of this chart with me !
Best Regards , Arman Shaban

Silver: Healthy Correction, 43.70 Support in FocusAs explained in my previous analysis, Silver extended its bullish move toward 45.00.
Naturally, after such a strong advance, the market is now undergoing a correction, with price trading around 44.30 at the time of writing.
The key point: this correction doesn’t look like a trend reversal, but rather a normal pause within the broader bullish context.
Why I remain bullish:
• Corrections are expected after sharp rallies – they allow the market to “reset.”
• The 43.70 support zone stands out as a key level where buyers could step back in.
• Market structure remains intact, with higher highs and higher lows still in place.
Trading Plan:
I continue to favor buying dips into support, with 43.70 being the ideal entry zone. As long as that level holds, Silver is well-positioned for another push higher, potentially retesting the 45.00 zone and beyond.

Silver - Expecting Bullish Continuation In The Short TermH1 - Strong bullish momentum.
No opposite signs.
Until the two Fibonacci support zones hold I expect the price to move higher further.
If you enjoy this idea, don’t forget to LIKE 👍, FOLLOW ✅, SHARE 🙌, and COMMENT ✍! Drop your thoughts and charts below to keep the discussion going. Your support helps keep this content free and reach more people! 🚀
--------------------------------------------------------------------------------------------------------------------

XAGUSD SILVER📈 Silver (XAGUSD) – Long Setup (4H)
Technical View
Price has broken out of a rectangle consolidation on the 4H chart.
Breakout is supported by bullish momentum candles.
Market structure showing higher highs (HHs) and higher lows
Trading Plan
Entry: On successful breakout retest / bullish confirmation candle.
Targets:
🎯 TP1:
🎯 TP2:
🎯 TP3:
Risk Management Rule
Once TP1 is hit, immediately move SL to entry (break-even).
Partial profits can be booked at TP1; let the rest run toward TP2 and TP3.
