LiamTrading – XAUUSD Fibo & Volume Profile AnalysisLiamTrading – XAUUSD Today's Scenario: Fibo & Volume Profile Analysis
Gold, after testing the 375x zone, has shown clear signs of weakening. On the H1 frame, the price structure is forming an adjustment phase as it aligns with key Fibonacci and Volume Profile levels. This is the time when the market begins to “filter” liquidity, creating opportunities for both short sell orders and buys at strong support zones.
Technical Analysis
Fibonacci indicates the 0.786 – 1.0 zone around 3756–3758 coincides with strong resistance and FVG, with a high potential for a reversal.
Volume Profile points out the POC zone around 3735–3740; if breached, it will pave the way for deeper downward pressure.
The confluence support zone 0.618 fibo + large volume around 3688–3691 is suitable for scalping buys.
Further, the 3648–3651 area is reinforced by VAL and the volume profile bottom, making it a strong long-term “Buy zone.”
Trading Plan Reference
Sell zone: 3756 – 3758, SL 3763, TP 3750 – 3748 – 3736 – 3710 – 3690 – 3655
Buy scalping: 3688 – 3691, SL 3685, TP 3701 – 3715 – 3728
Long-term Buy zone: 3648 – 3651, SL 3640, TP 3670 – 3688 – 3700 – 3718 – 3733 – 3755
In summary, gold is moving according to the technical structure with confirmation from Fibonacci and Volume Profile. Today's scenario prioritizes observing reactions around the sell zone 3756–3758 to find short opportunities, and waiting to buy at value zones 369x and 365x for the recovery wave.
This is my personal view on XAUUSD. If you want the fastest updates on the next gold scenarios, follow me and join the community to not miss out.
Xauusd(w)

26/9/68 : XAUUSD ( Europe / London Session )Using it from Europe Session until 7.00PM , I'll new analysis and update at 8.00PM
Resistance
3769-3774
3759-3764
3753
Support
3743
3733-3738
3722-3728

XAUUSD – Wolfe Waves continues on H4XAUUSD – Wolfe Waves continues on H4, price returns below the trendline: prioritising the correction scenario
Hello Trader,
Based on the Wolfe Waves structure on the H4 frame and current price behaviour, gold has returned to trading below the trendline, indicating a weakening of short-term upward momentum and making way for a downward correction before the market decides the next trend. The upper area has created a clear “sell zone”; below, two defensive buying zones appear for both scalping and medium-term.
Main Technical Picture
Wolfe Waves: wave 5 completes near resistance, then price falls back below the trendline — aligning with the correction scenario along Wolfe's target line 1–4.
Trendline & price box area: the close below the rising trendline shows “acceptance” below; immediate resistance lies in the 375x–376x cluster (sell zone).
Momentum: MACD H4 slows down, histogram narrows → high probability of a pullback – retest before a new decision.
Detailed Trading Scenarios
1) Sell according to the correction trend (priority)
Entry: 3756 – 3759
SL: 3764
TP: 3745 → 3732 → 3715 → 3690 → 3672
Reason: the 375x area coincides with the sell zone + upper trendline; selling at retest offers a good R:R ratio.
Confirmation/Invalidation: if H4 closes above 3764 and holds, the short-term selling scenario weakens.
2) Buy scalping in the buffer zone
Entry: 3701 – 3703
SL: 3695
TP: 3715 → 3732 → 3745 → 3766
Note: only a rebound in the correction phase; close each level and move SL according to TP1.
3) Buy medium-term (strong base area)
Entry: 3648 – 3651
SL: 3644
TP: 3672 → 3698 → 3708 → 3722 – 3727
Reason: the 365x area coincides with the demand/accumulation volume on H4; suitable for catching a deep rebound along with the larger trend.
Management: this is a medium-term order, so divide the volume, close each step, and move SL to breakeven after TP1.
Refer to my scenario if you find it reasonable, trade accordingly, and if you enjoy trading gold with high-quality scenarios, follow me

XAUUSD – Downtrend Continues to be FavoredDowntrend Continues to be Favored (Wolfe Waves Pattern H4)
Hello Trader,
Gold is following the Wolfe Waves structure on the H4 chart, after bouncing off the upper resistance zone and returning below the trendline. This indicates that the short-term upward momentum has weakened, and the scenario of a downward adjustment continues to be prioritized at this stage.
Technical Analysis
Wolfe Waves are clearly formed, wave 5 has hit resistance and a reversal signal has appeared.
The price failed to hold above the upper trendline, while the MACD shows weakening upward momentum.
The 3746 – 3748 zone is considered the main “sell zone” in the short term.
Nearby support zones: 3709 – 3711 and deeper at 3675 – 3678. Further out, the area around 3650 is an important “buy zone” in the medium term.
Trading Scenarios
1. Sell with the trend (priority)
Entry: 3746 – 3748
SL: 3754
TP: 3733 → 3720 → 3702 → 3690
2. Buy Short-term Scalping
Entry: 3709 – 3711
SL: 3705
TP: 3722 → 3730 → 3745
3. Buy Deep Support Scalping
Entry: 3675 – 3678
SL: 3670
TP: 3688 → 3696 → 3710 → 3725
4. Medium-term Buy Zone
Entry: around 3650
This is a large volume accumulation zone, coinciding with strong support on H4. This area is suitable for considering medium-term buy orders if the price adjusts deeply.
Conclusion
In the short term, the bearish scenario continues to be favored, especially when the price stays below the 3748 zone.
Buy strategies should only be considered in the form of scalping or at the important buy zone around 3650.
The current gold market is still in a distribution phase, so patience is needed to observe candle confirmations at entry zones to optimize the R:R ratio.
This is today's XAUUSD trading scenario according to Wolfe Waves on H4. You can refer to it and combine it with your personal strategy for the best risk management.
Follow me to receive the latest scenarios when the price structure changes.

Gold – Waiting for the Perfect DipIn yesterday’s analysis, I mentioned that after reaching a new ATH just under 3800, Gold could enter a correction, and that this corrective move should be seen as a buying opportunity.
Indeed, we’ve had a pullback, but it hasn’t gone deep enough to trigger my buy limit orders – which kept me on the sidelines for now.
Still, my idea remains unchanged: I expect a liquidity dip closer to the 3700 zone, which stands out as the key support area for buyers.
Trading Plan:
• I continue to look for buying opportunities on dips, ideally around 3700.
• If price holds this zone, the bullish structure remains intact and another run toward ATH levels becomes likely.
• However, if Gold breaks below 3700, the market could enter a deeper correction phase, and I will have to re-evaluate my bias and strategy.

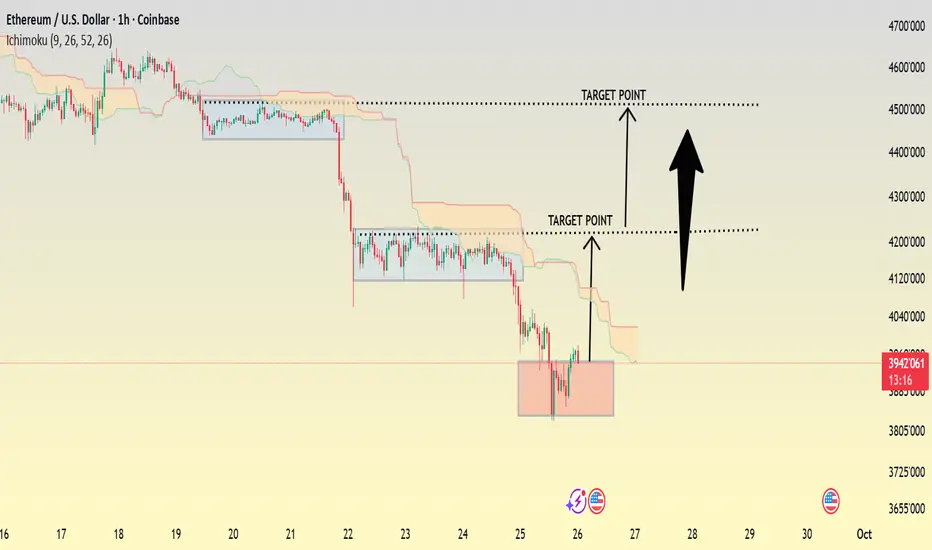
ETH/USD 1HOUR Chart Pattern ....ETH/USD is currently holding above a strong support zone, showing signs of bullish momentum building up. As long as price stays above this zone, buying pressure can continue toward the first target at 3,820 and further extension toward the second target around 4,120.
📌 Entry Zone: 3,945 – 3,940
📌 Target 1: 4,225
📌 Target 2: 4,515
📌 Stop Loss: Below 3,880
⚡ Summary:
ETH is forming a clean bullish structure after consolidation. This setup is favorable for buyers aiming for medium-term upside moves. A break and close above 4225 will confirm stronger bullish continuation.
XAUUSD – Bullish Setup (1H Trendline Play) ..Gold is moving inside an ascending channel, respecting the bullish trendline structure. Market has not broken the trendline yet, which confirms that buyers are still in control.
📌 Entry Zone: 3746 – 3744 (buying interest building near the trendline support)
📌 Target/Resistance: 3794 (next key resistance level)
As long as price holds above the trendline, we expect a bullish continuation towards the resistance zone. Breakout from 3794 will further strengthen the upside momentum, while failure at this level may trigger pullbacks.
This setup offers a clean risk-to-reward trade for buyers with a defined structure based on trendline support and overhead resistance.

GOLD falls slightly, market awaits inflation dataIn the Asian trading session on Friday morning (September 26), spot OANDA:XAUUSD hovered around 3,747 USD/ounce, as if "listening" for important news: the upcoming US PCE inflation data. This is considered an information bomb that can cause the gold market, US Dollar and stocks to shake strongly.
Earlier, on Thursday, gold lost steam when the number of unemployment claims in the US unexpectedly decreased. Specifically, the US Department of Labor reported that the week ending September 20 had only 218,000 applications, lower than the forecast of 235,000 and down 14,000 compared to the previous week. This news reduced the market's expectation that the Federal Reserve (Fed) would quickly cut interest rates.
However, gold prices still closed up 0.36% at $3,749.36/ounce, after rising as much as 0.6%. Also in the week, gold hit a historic peak of $3,790.82/ounce on Tuesday, a figure that made many investors “just sit and watch the chart and sigh with regret, just like AD, reviving when preparing to go to the island”.
According to CME's FedWatch tool, the possibility of the Fed cutting interest rates in October is now priced by the market at 85%, down from 90% before the employment data was released. In other words, the Fed is still holding the knife, just hasn't decided whether to cut the "interest rate" yet.
The US Bureau of Economic Analysis will release its PCE index for August today. Forecasts show PCE rising 2.7% year-on-year, up from 2.6% previously. The core PCE (excluding volatile energy and food prices) is expected to rise 2.9%, the same as in July.
Since this is the Fed’s preferred measure of inflation, any higher-than-expected figure could strengthen the US dollar, sending gold tumbling in the short term.
Gold, by its nature, does not generate interest. It only really shines in a low-interest-rate environment, which investors are hoping the Fed will soon bring.
Analysis of the technical outlook for OANDA:XAUUSD prices
Main Trend
Gold is still in a fairly clear uptrend channel.
The price is fluctuating around 3,739 USD/oz, approaching the midline of the uptrend channel.
Short-term trend: up but with slight corrections.
Important resistance
3,779 USD (Fib 0.382): if broken, gold can quickly test 3,825 - 3,872 USD.
3,938 - 4,022 USD: strong resistance zone, reaching the top of the uptrend channel, easy to take profit.
Important support
3,738 USD (current price).
3,720 USD (Fib 0.236 + nearest MA zone).
3,706 USD: strong support, breaking this zone, there is a risk of returning to test 3,628 USD.
RSI
Still above 60, indicating the market is still biased towards buyers, but showing signs of being a bit “overextended”.
SELL XAUUSD PRICE 3815 - 3813⚡️
↠↠ Stop Loss 3819
→Take Profit 1 3807
↨
→Take Profit 2 3801
BUY XAUUSD PRICE 3682 - 3684⚡️
↠↠ Stop Loss 3678
→Take Profit 1 3690
↨
→Take Profit 2 3696

XAU/USD Technical Setup: Reversal Brewing Inside Bearish ChannelAbsolutely! Let's break down the technical analysis chart for **Gold Spot U.S. Dollar (XAU/USD)** on the 1-hour timeframe. Here's what it's signaling:
---
### 📉 Chart Structure: Descending Channel
- The price action is confined within a **descending channel**, marked by two parallel trend lines sloping downward.
- This typically indicates a **short-term bearish trend**, but also sets the stage for a potential **bullish breakout** if momentum shifts.
---
### 🔄 Reversal Signal: Rounded Bottom
- Inside the channel, there's a **rounded bottom pattern**—a classic reversal formation.
- This suggests that selling pressure is weakening and buyers may be preparing to take control.
---
### 📈 Trade Setup Overview
| Component | Level | Purpose |
|----------------|-------------|----------------------------------|
| **Entry Point**| 3,754.95 | Buy trigger after breakout |
| **Target Point**| 3,726.91 | Profit-taking level |
| **Stop Loss** | 3,775.95 | Risk control if breakout fails |
> ⚠️ Note: The **target point is lower than the entry**, which is unusual for a bullish breakout. This might be a labeling error or a short-term scalp strategy. Typically, you'd expect the target to be **above** the entry in a long trade.
### 🧠 Strategic Interpretation
- **Bullish Bias**: The rounded bottom and breakout arrow suggest a bullish move is expected.
- **Risk Management**: The stop loss is placed above the entry, which is unconventional. Normally, you'd place it below the entry in a long setup.
- **Channel Breakout**: If price breaks above the descending channel with volume confirmation, it could trigger a strong upward

Gold Price Outlook – Trade Setup (XAU/USD)📊 Technical Structure
Gold (XAU/USD) is trading near $3,740, consolidating below the descending trendline resistance. The support zone lies at $3,723 – $3,719, while the resistance zone is around $3,761 – $3,765. The price structure shows a “buy-the-dip” bias as long as support holds, but near-term pressure remains capped by the downtrend line. A breakout above $3,765 could open the path toward $3,785.
🎯 Trade Setup
Entry: $3,719 – $3,723 (support retest)
Stop Loss: $3,715
Take Profit: $3,764 / $3,785
Risk/Reward (R:R): ~1 : 5.4
🌍 Macro Background
Markets await the US Core PCE Inflation data later today – the Fed’s preferred inflation gauge. Stronger-than-expected PCE could strengthen the USD and pressure gold lower. On the other hand, a softer reading may revive rate cut expectations, supporting gold. Additionally, Trump’s new tariffs (100% on pharmaceuticals, 50% on cabinets, 30% on furniture, etc.) and ongoing geopolitical risks with Russia provide safe-haven flows that keep gold attractive. Despite the USD holding at three-week highs, investors continue to see gold as a hedge amid policy uncertainty and trade tensions.
🔑 Key Technical Levels
Resistance: $3,764 / $3,785
Support: $3,723 / $3,719
📝 Trade Summary
The overall structure favours a buy-the-dip strategy near support zones, with upside potential toward $3,764 – $3,785 if US PCE comes in softer. However, a stronger inflation print may trigger a deeper pullback below $3,719. Traders should stay alert for volatility around the data release.
⚠️ Disclaimer
This analysis is for reference only and does not constitute trading advice. Trading involves significant risk, and proper risk management is essential.

Gold Elliott Wave Outlook: Possible Wave 4 CorrectionGold Elliott Wave Analysis: Potential Wave 4 Correction Toward $3,650
The price of gold (XAU/USD) has recently shown signs of completing its third Elliott wave around the $3,720 region. According to Elliott Wave analysis for gold, this level may have marked the peak of Wave 3, and the market could now be setting up for a Wave 4 correction. The minimum retracement target for this corrective move appears to be in the $3,650 support zone. However, the ascending trendline remains intact, which means entering a short position prematurely—before a decisive break of the trendline—still carries significant risk.
Elliott Wave Perspective
In Elliott Wave theory, Wave 4 typically represents a corrective phase following the strong impulsive move of Wave 3. These corrections often retrace into previously consolidated zones, creating a buying opportunity before Wave 5 emerges. In this case, the highlighted box around $3,650 represents the most probable demand zone where buyers could step back in.
The critical factors to watch on the chart are:
Whether gold can hold above the rising green trendline. A confirmed breakdown would significantly increase bearish momentum.
If gold fails to reclaim and sustain the $3,720 level, sellers may gain confidence and push prices lower.
The $3,650 area is both a psychological and technical support, making it an ideal candidate for the bottom of Wave 4.
Keywords for SEO: gold Elliott Wave analysis, wave 4 correction, gold price forecast, gold support zone, XAUUSD technical outlook, gold bearish scenario, gold trading strategy
Fundamental Catalysts Supporting a Bearish Outlook
While technical analysis suggests a potential drop, fundamentals also align with the possibility of a correction in gold prices. Several macroeconomic and market factors could act as catalysts for a decline from $3,720 toward $3,650.
Stronger U.S. Economic Data
Recent data releases from the United States have shown resilience in the economy. Stronger-than-expected GDP growth or consumer spending could push the Federal Reserve to maintain higher interest rates for longer. This hawkish outlook would support the U.S. dollar, making gold less attractive as a non-yielding asset.
Rising Real Yields
Gold has no yield, so its attractiveness declines when real interest rates rise. If U.S. Treasury yields continue to move higher while inflation expectations remain anchored, real yields will climb. This environment historically creates downward pressure on gold.
Strength in the U.S. Dollar
The U.S. dollar index (DXY) has been consolidating near higher levels. A renewed surge in the dollar would make gold more expensive for foreign buyers, limiting demand and contributing to downside pressure.
Weak Physical Demand from Asia
Physical demand from key gold-buying nations like China and India remains a major factor. Recent reports indicate that China’s gold imports via Hong Kong fell by nearly 39% compared to the previous month, signaling weakening appetite. This reduction in demand could remove an important support pillar for gold prices.
ETF Outflows and Reduced Speculative Interest
Gold ETFs and futures often amplify momentum. If speculative capital continues to exit the market, price declines could accelerate.
Diminished Geopolitical Tensions
Gold acts as a safe-haven asset during crises. However, if global geopolitical risks or inflation fears ease, investor demand for gold could wane, further validating a correction.
Trading Strategy and Risk Management
The current technical setup suggests caution. While the Elliott Wave pattern points toward a corrective move, timing the entry is crucial:
A break below the green uptrend line would confirm bearish momentum and increase the probability of a decline toward $3,650.
Aggressive traders may attempt to short below $3,720 resistance, but conservative traders may prefer waiting for a clean break and retest of the trendline.
Risk management remains essential, as failure of the bearish scenario could lead to a renewed rally above $3,800.
Conclusion: Gold Outlook for Traders
Combining Elliott Wave theory with fundamental drivers, gold appears vulnerable to a Wave 4 correction. A break of the rising trendline could accelerate selling pressure, with a minimum downside target of $3,650. Strong U.S. economic data, rising real yields, weaker physical demand from China, and strength in the U.S. dollar all support this bearish outlook.
Still, traders should remain flexible. Gold remains a safe-haven asset, and renewed geopolitical tensions or dovish central bank commentary could quickly reverse the bearish narrative. For now, monitoring the $3,720 resistance and the green uptrend line will be essential to confirm whether the next move is indeed a correction or just a consolidation before another rally.

Gold 1H – Will Gold Correction Extend Toward Discount Zones?Gold on the 1H timeframe is trading near 3,745 after repeated bearish pushes, with premium resistance clustered at 3,780–3,778 and a secondary resistance zone at 3,748–3,746. Discount demand remains positioned lower at 3,713–3,706 and deeper near 3,665. Recent CHoCH signals confirm short-term bearish pressure, suggesting engineered liquidity sweeps into resistance before potential retracements toward discount levels.
Today’s headlines on renewed U.S. inflation worries and expectations of a slower Fed pivot are weighing on sentiment, while ongoing Middle East geopolitical tensions keep safe-haven demand alive. This dynamic may fuel intraday volatility, with liquidity hunts at resistance zones likely before directional clarity develops.
________________________________________
📌 Key Structure & Liquidity Zones (1H):
• 🔴 SELL GOLD LIQUIDITY 3,780–3,778 (SL 3,787): Premium resistance where sweeps may trigger rejection toward 3,760 → 3,740 → 3,730.
• 🔴 SELL GOLD 3,748–3,746 (SL 3,755): Intraday resistance zone aligned with 0.5–0.618 retracement, offering downside targets at 3,730 → 3,720 → 3,715.
• 🟢 BUY ZONE 3,697–3,699 (SL 3,692): Discount demand in line with liquidity magnets, with upside targets at 3,715 → 3,730 → 3,745+.
________________________________________
📊 Trading Ideas (Scenario-Based):
🔻 Sell Setup – Liquidity Run (3,780–3,778)
• Entry: 3,780–3,778
• Stop Loss: 3,787
• Take Profits:
TP1: 3,760
TP2: 3,740
TP3: 3,730
🔻 Sell Setup – Intraday Rejection (3,748–3,746)
• Entry: 3,748–3,746
• Stop Loss: 3,755
• Take Profits:
TP1: 3,730
TP2: 3,720
TP3: 3,715
🔺 Buy Setup – Discount Demand (3,697–3,699)
• Entry: 3,697–3,699
• Stop Loss: 3,692
• Take Profits:
TP1: 3,715
TP2: 3,730
TP3: 3,745+
________________________________________
🔑 Strategy Note
With U.S. inflation concerns and geopolitical risks keeping gold under mixed pressure, intraday strategies should focus on fading liquidity grabs into premium resistance while being prepared to buy dips at well-defined discount demand. Expect volatility around 3,780 liquidity sweeps before corrections extend toward the 3,713–3,706 zone.

Gold Pullback Toward 3,700 Within Ongoing UptrendHey Traders, in today's trading session we are monitoring XAUUSD (Gold) for a buying opportunity around the 3,700 zone. Gold is trading in an uptrend, with price currently correcting toward this key support/resistance level.
Structure: The broader bias remains bullish, but price is retracing after recent highs.
Key level in focus: 3,700 — a critical area where buyers may look to step in and resume the upward move.
Fundamentals: Softer USD sentiment and steady safe-haven demand continue to favor the bullish case for Gold on dips.
Trade safe,
Joe.

XAUUSD (16-9-25 @ 10:54pm)
1. In 4 hours chart, OB and FVG peding to be sweept before go higher.
2. Zone 3665 to 3650 become a strong POI zone which FIBO 0.618 + OB + support zone existed.
Conclusion
Wait price come to POI zone and long entry

Global news might have us Stalling on Gold! Chart Context (MGC Futures, H1/H4)
Price stalled out after rejecting the H4 bearish zone (3791.4–3769.9).
Yesterday’s downside move lost steam before fully reaching the deeper H4 bullish demand (3746.3–3735.2).
We’re now compressing between Daily High (3792.1) and Daily Low (3752.0).
Fundamentals:
U.S. geopolitical/military headlines (Defense Secretary Pete Hegseth ordering hundreds of generals/admirals to an urgent meeting at Quantico, Sep 30) are creating uncertainty, which could trigger safe-haven flows in gold.
Bias Going Into Friday:
Watching for liquidity sweep of yesterday’s lows (~3752/DL). If swept and reclaimed, could trigger bullish continuation.
Alternatively, a clean break & hold above yesterday’s high (~3792/DH) sets up momentum longs targeting 3812+ (previous imbalance).
No trade in the middle of the chop — patience until liquidity is taken on one side.

GOLD BULLISH BIAS|LONG|
✅XAUUSD Price forms a bullish flag above the wide demand area, showing ICT displacement. Smart Money likely drives momentum toward liquidity resting at 3,780$. Time Frame 3H.
LONG🚀
✅Like and subscribe to never miss a new idea!✅

Tension at the Top – Will Gold Crack the Supply Wall or Fade BacHello traders 👋
Price is hovering at 3754, just beneath a key liquidity shelf and staring straight into premium resistance. Bulls have kept structure clean, but the real test is moments away. Today’s battle is shaped between a hardened supply above and a fresh demand pocket waiting below. This is a sniper’s day — let’s map it tactically 👇
🔹 HTF Structural Zones (D1, H4, H1 – wide institutional ranges)
🟥 Supply Zone (D1 OB) → 3770–3780
The last valid bearish OB on D1, untouched since formation. This is where previous rallies failed. Imbalance + FVG inside, aligned with RSI H1 overbought. Any return here requires extreme caution for bulls.
🟦 Demand Zone (H1–H4 confluence) → 3732–3726
The last bullish reaction base before the push toward 3761. Protected by EMA 21 + 50 (Dynamic EMA Flow). Clean structure, built with absorption and demand reloading. RSI shows bullish divergence on M30. Expect reactions if tapped.
⚪ Decision Zone (Intraday Control Shelf) → 3744–3740
The zone that separates continuation from correction. Price has defended this shelf three times, making it the intraday line of control. Below it → buyers lose momentum. Above it → bulls stay in charge.
🎯 Precision Zones (Execution Focus)
🟦 Long setups only inside 3732–3726
🟥 Short setups only after rejection inside 3770–3780
⚪ Control flips decisively in 3744–3740
🎲 Scenarios
🟢 Bullish Setup
Hold above 3744–3740 → push through 3758
Sweep and close above 3761 → price targets 3770–3780
Acceptance inside OB → extension toward 3810
🟥 Bearish Setup
Tap or sweep 3761, reject from 3770–3780
Reclaim 3758 → 3744 → break below decision zone
Loss of 3740 opens the gate for 3732–3726, with risk of deeper dive to 3698
🗺️ Tactical Map Summary
🟦 Potential Buy Zone: 3732–3726 (discount sniper zone)
🟥 Potential Sell Zone: 3770–3780 (premium OB supply)
⚪ Decision Zone: 3744–3740 (intraday control line)
🧩 Conclusion
Gold stands between two power zones. Bulls still lead, but they’re knocking at a door guarded by old supply. Today’s direction flips inside the 3744–3740 control zone. Patience is power. Wait for the reaction. Strike with confirmation.
Drop your thoughts in the comments, smash the like button, and hit follow on GoldFxMinds for more daily sniper plans. Let’s keep building this edge together 🚀✨

XAUUSD BUY 3734Here’s a sharp TradingView idea description for your XAUUSD Buy at 3734 setup, tailored for engagement and clarity:
🟢 XAUUSD Buy Setup – Targeting Upside from 3734
Gold is showing bullish momentum after a key support retest near 3734. Price action confirms a potential reversal zone with confluence from:
- 🔹 Fibonacci retracement aligning with 3734 (golden pocket zone)
- 🔹 Bullish engulfing candle on 4H chart
- 🔹 RSI bounce from oversold territory
- 🔹 MACD crossover signaling upward momentum
📈 Trade Plan:
- Entry: 3734
- Stop Loss
- Take Profit Zones
This setup favors a disciplined risk/reward approach. Watch for volume confirmation and news catalysts (e.g., Fed commentary or geopolitical tension) that could accelerate gold’s move.

Will Gold Buyers Defend 3725 for a Quick Move to 3750?Gold is showing signs of stability after recent price fluctuations, and a potential swing trade opportunity is forming. Buyers are attempting to defend the short-term support zone, which may encourage momentum toward the next resistance levels.
Key Levels:
Buy Entry Point: 3725
Take Profit: 3750
Stop Loss: 3710
Reasoning:
The price has been consolidating near support, and a bounce from this area aligns with the prevailing short-term bullish momentum. Protecting the trade with a stop at 3710 reduces risk in case of breakdown, while the upside target at 3750 captures the next logical resistance area.
Disclaimer:
This analysis is for educational purposes only and not financial advice. Markets are volatile manage your risk carefully and trade according to your own strategy.

The bearish trend will continue unless the price rises above3765#XAUUSD OANDA:XAUUSD
Gold closed with a negative daily line, reaching a low of around 3717. If today's closing daily line falls below the MA5 moving average and touches the MA10 moving average, we need to be alert that the bears may dominate the market again tomorrow, Friday.
The downward trend is still under pressure during the day, and trading is still mainly short-selling. The immediate resistance level to watch is 3748-3750, which also marks the boundary of the triangle pattern; a touch of this level could signal a short-selling opportunity. Further pay attention to the trend pressure of 3765. As long as this point is not broken, the short trend of gold will not change. Pay attention to the short-term support of 3735-3720 below. You can go long on gold if it is not broken on the first pullback.

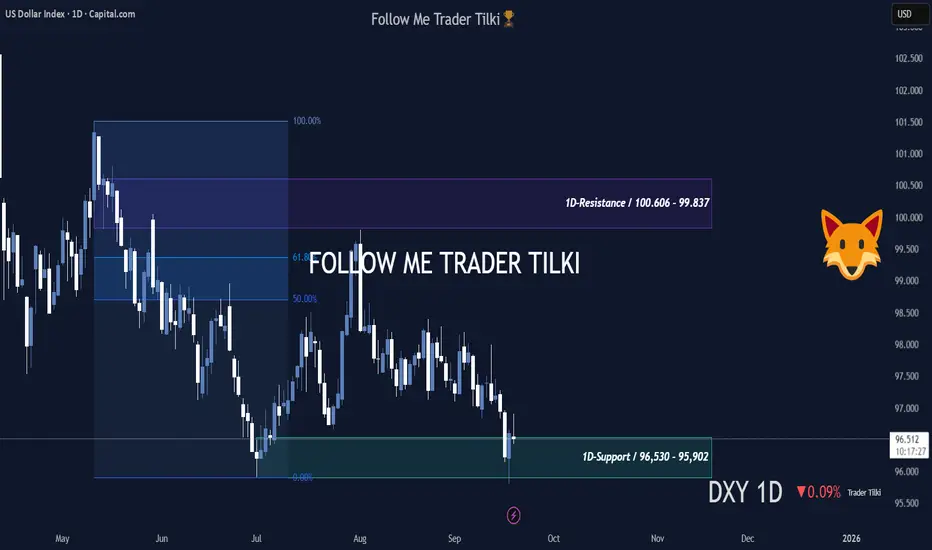
DXY at a Critical Juncture — What’s the Fed’s Next MoveHey Guys,
I’ve put together a swing-style analysis for the DXY.
This one’s been highly requested — my followers are valuable to me, and I never turn them down.
DXY Daily Levels:
- Resistance: 100.606 – 99.837
- Support: 96.530 – 95.902
From a fundamental perspective, the U.S. Dollar Index is currently dropping due to Fed policies.
No steps are being taken to push the dollar higher.
Because of this, investors are choosing gold as a safe haven instead of buying dollars.
Gold keeps hitting new ATHs, and naturally, the dollar index is sliding.
Unless the Fed takes action to support the dollar, this decline will continue.
In short, the drop in the dollar is entirely due to the policies implemented by the Fed Chair.
Remember — DXY isn’t heavily influenced by technical analysis; it’s driven by Fed policy.
That said, since the index has fallen so much, I believe we might see some steps taken in the coming months to lift the dollar.
I’ll be sharing updates right here.📢
Once support or resistance levels are broken, I’ll post new insights immediately.
Every like from you is my biggest motivation to keep sharing these analyses.
Thanks to all my friends who support me — you’re the best. ❤️
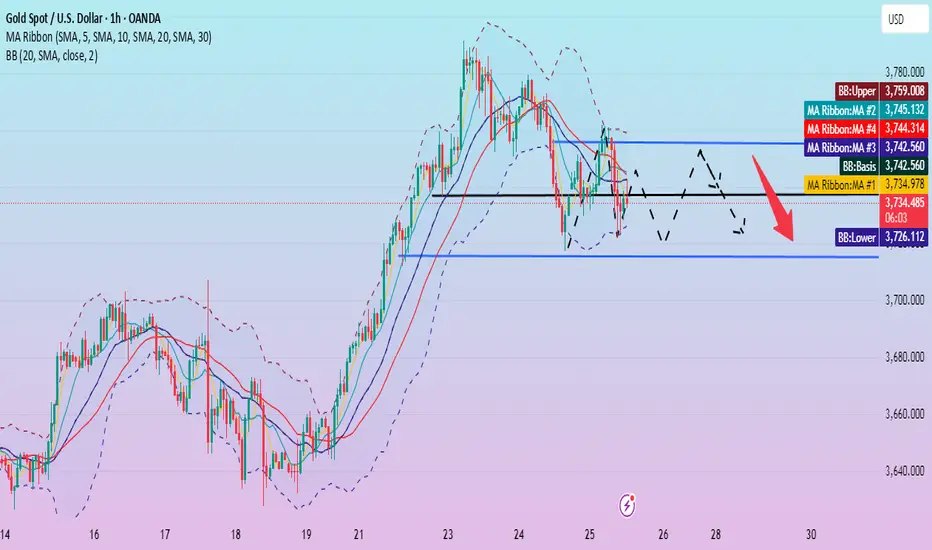
Is the correction over? Has the low been reached?This price correction began near the upper Bollinger Band at 3760, reaching a low near the lower Bollinger Band at 3722. It's currently rebounding slightly and trading near the middle Bollinger Band. The 1-hour MA20 moving average is converging with the middle Bollinger Band, indicating the possibility of further price adjustments in the short term.
Gold's 1-hour moving average is sloping downward, and the price is currently fluctuating around the low of 3735. Despite the bearish US initial jobless claims data, gold prices did not fall. Instead, they rebounded from around 3722 to 3745 before falling under pressure. As of now, it has not broken through the important support level of 3715. This level is a key focus in the short term.
From the 4-hour perspective, the effective support below is still maintained around 3715, which is consistent with the 1-hour line support. The upper pressure is focused around 3755. The short-term operation strategy of maintaining range fluctuations remains unchanged.
Trading strategy:
Go long around 3715, stop loss at 3705, profit range 3740-3750.
Short around 3755, stop loss at 3765, profit range 3725-3710.
Gold breaks records and tops out: Where next?Gold achieved a historic breakthrough to $3,759 per ounce, potentially driven by an unusual "barbell strategy" where investors simultaneously bought risk assets while hedging against systemic risks.
On the one hand, continued expectations for two additional rate cuts by year-end supported non-yielding assets. On the other hand, political uncertainty increases as Trump prepares to meet with lawmakers on funding proposals. The probability of a Gov shutdown approaches 70% by October 1st, which would force the FOMC into a 'blind' meeting in October.
Technicals
The short-term setup shows a double top formation at $3,759, suggesting potential consolidation rather than immediate continuation.
Resistance Levels : $3,800 is a critical resistance, both a Fibonacci extension cluster and a psychological level
Support Levels :
Immediate support at $3,740 (breakout confirmation level)
Secondary support at $3,700-$3,730 (previous consolidation zone)
Deeper pullback potential to $3,673 (61.8% Fibonacci retracement)
Wave Structure : Elliott waves suggest completion of a potential Wave 3, with consolidation expected before a possible fifth wave extension toward $3,785-$3,800
Forward Outlook
The setup favours consolidation over the remainder of the week, with key events including Fed Chair Powell's speech and Friday's PCE inflation data serving as potential catalysts for the next directional move.
The momentum divergences suggest limited downside risk from current levels, making any pullback toward $3,700-$3,740 a potential buying opportunity for the anticipated final leg higher toward the $3,800 resistance zone.
Risk management remains crucial given the proximity to potential reversal levels and the unusual nature of gold's correlation with equity strength.
This content is not directed to residents of the EU or UK. Any opinions, news, research, analyses, prices or other information contained on this website is provided as general market commentary and does not constitute investment advice. ThinkMarkets will not accept liability for any loss or damage including, without limitation, to any loss of profit which may arise directly or indirectly from use of or reliance on such information.
