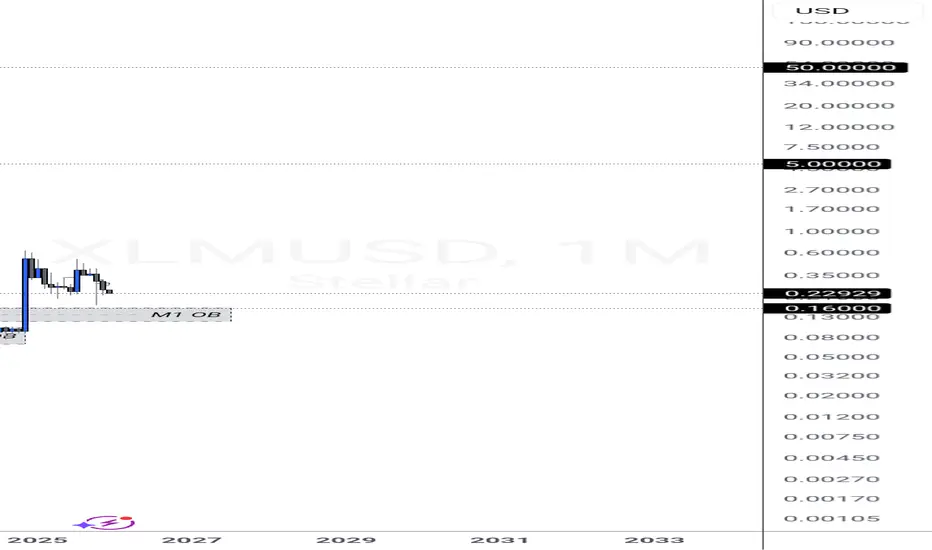
XLM global trend. Ascending channel. Triangle. January 2026Logarithm. 1-month time frame. Linear chart without market noise. Designed for visual understanding of long-term trend direction.
XLM

XLM Is Breaking Out...Are You Ready Before the Real Move Starts?Yello Paradisers! Are you paying close attention to this one? Because #XLM just made a critical structural shift and if you're not watching it closely, you might miss one of the cleanest breakout setups we’ve seen lately. #XLM has officially broken out of its descending resistance, and that same line is now acting as new support a classic confirmation that the market dynamic has shifted. What makes this move more significant? The breakout of selling climax occurred with a momentum candle, which increases the probability that institutional buyers are stepping in. This is the phase where smart money prepares for the next leg.
💎#XLM broke above the upper trigger line of the selling climax with a momentum candle a high-probability setup that big players are entering during the retracement phase. This type of breakout pattern often precedes strong upside continuation. The current probability for upside target sits at 2530, a major resistance level and potential reaction zone. If momentum sustains, this is where price could be heading next.
💎#XLM descending resistance was broken, and it’s now acting as new support, also there is a major structural shift and momentum shift that often precedes sharp upside moves when we look at price action.
💎#XLM holds momentum within the demand zone, the setup remains high probability targeting an initial upside move toward 2325, a key moderate resistance and structural level.
💎If #XLM fails to hold bullish momentum and a momentum candle closes below 1960, the current bullish probability becomes invalid. In that case, we could see further downside pressure.
That is why Paradisers, we are playing it safe right now. If you want to be consistently profitable, you need to be extremely patient and always wait only for the best, highest probability trading opportunities only on confirmations.
MyCryptoParadise
iFeel the success🌴

Buyers are waiting to re-enter XLM (8H)After creating a series of bearish moves, the market maker aggressively pushed the price upward in a sharp impulse move. During this strong rally, it is important to note that price not only formed a Bullish Change of Character (CHoCH), but also reclaimed key levels, confirming a shift in market structure from bearish to bullish.
Early buyers who entered alongside the market maker at lower prices have already secured their first round of profits, which has led to the current price correction / pullback. This retracement appears to be a natural and healthy reaction after a strong impulsive move, rather than a sign of weakness.
Traders who have already taken profits, along with new buyers, are now waiting for lower and more discounted prices to re-enter the market. Once sufficient buying interest returns at these levels and accumulation is completed, XLM has the potential to initiate another bullish move to the upside.
Trade Setup & Risk Management
To properly manage risk and plan a structured entry, a clear trading setup has been prepared around major support levels. These support zones are areas where we expect buyers to step back in.
We have two planned entry points, and positions should be entered using a DCA (Dollar Cost Averaging) strategy to improve average entry price and reduce risk in case of short-term volatility.
Targets & Invalidation
All targets are clearly marked on the chart.
At Target 1, it is recommended to secure partial profits.
After reaching the first target, move the stop loss to Break Even to protect capital.
If the stop loss is hit, this setup will be invalidated, and the bullish scenario should be reconsidered.
Final Notes
As long as price holds above the key support zones and the bullish structure remains valid, the overall bias stays bullish. Always trade with proper risk management and discipline.
⚠️ This analysis is for educational purposes only and not financial advice.
If you would like us to analyze a coin or altcoin for you, first like this post, then comment the name of your altcoin below.

Lumens Back up to a Quarter each in 2020inflation mechanism is gone, and the bottom barrel supply distribution is complete
nowhere to go but UP when everyone is either a FOMO buyer in the money, or a bagholder along for the reunion tour

XLMUSDT UPDATE#XLM
UPDATE
XLM Technical Setup
Pattern: Falling Wedge Pattern
Current Price: 0.2351$
Target Price: 0.4230$
Target % Gain: 85.96%
Technical Analysis: XLM is breaking out of a falling wedge pattern on the 1D chart, signaling a potential bullish reversal. Price has pushed above the descending resistance trendline after a prolonged downtrend, confirming breakout strength. The measured move from the wedge projects an upside target near 0.4230$, aligning with prior structure resistance and suggesting strong continuation potential if momentum holds.
Time Frame: 1D
Risk Management Tip: Always use proper risk management.

XLM/USDT Waiting for Confirmation: Fake Bounce or Trend ReversalXLM/USDT on the 8-hour timeframe is still trading under a clear bearish trend. Price continues to form lower highs and lower lows, confirming strong selling pressure. However, recent price action shows consolidation near the lower range, which could act as a short-term reaction zone.
---
Pattern Explanation
The chart highlights the following key patterns:
1. Descending Trendline (Major Dynamic Resistance)
The yellow descending trendline acts as the main dynamic resistance
Price has been repeatedly rejected from this level
As long as price remains below this trendline, the overall bias stays bearish
2. Bearish Continuation Structure
Market structure remains intact with consistent lower highs
Any upward move so far appears corrective rather than a true reversal
This suggests the market is still in a distribution phase
---
Key Levels
Resistance Levels:
0.2370 – minor resistance / short-term reaction area
0.2600 – key resistance from previous breakdown
0.3000 – 0.3300 – strong supply zone
0.3500 – major resistance
Support Levels:
0.2230 – 0.2150 – current consolidation and local support
0.2030 – 0.1950 – strong support zone if further breakdown occurs
---
Bullish Scenario
The bullish scenario becomes valid if:
Price breaks and closes decisively above the descending trendline
Followed by a confirmed close above 0.2370
Ideally supported by increasing volume
Bullish Targets:
0.2600
0.3000
0.3300
A successful breakout would signal bearish structure invalidation and open the door for a medium-term trend reversal.
---
Bearish Scenario
The bearish scenario remains dominant if:
Price fails to break the descending trendline
Rejection occurs around the 0.2370 – trendline area
Price breaks below 0.2150 support
Bearish Targets:
0.2030
0.1950
This would confirm a bearish continuation toward lower demand zones.
---
Conclusion
XLM/USDT remains under strong bearish control, with the descending trendline acting as a critical level. Until a confirmed breakout occurs, price is more likely to continue its downtrend or consolidate. Traders should stay patient and wait for clear confirmation before taking positions.
---
#XLMUSDT #Stellar #CryptoAnalysis #TechnicalAnalysis #Downtrend #BearishMarket #Altcoins #CryptoTrading #MarketStructure #SupportResistance #Trendline

STELLAR - Ready for TakeoffStellar has positioned itself on the top of a prior resistance line
A very bullish signal, as it signifies that price no longer respects that line as resistance and newer highs can be found
XLM moves closely with XRP
Daily chart

XLM has broken below the blue support level📊 XLM Update
XLM has broken below the blue support level 🔵,
confirming increasing selling pressure.
As long as price stays below this zone,
downside risk remains high and the trend stays weak.

TradeCityPro | XLM Trapped in Range, Awaiting Breakout Trigger👋 Welcome to TradeCity Pro!
In this analysis, I want to review XLM, one of the DeFi and RWA coins, which with a market cap of $7.72 billion is ranked 15th on CoinMarketCap.
⏳ 4-hour timeframe
On the 4-hour timeframe, this coin has formed a large range box, and for several weeks it has been moving inside this range.
✔️ The bottom of this box is at 0.22826, and the top of the box is at 0.25960, and currently the price is moving in the middle of this box.
📊 A smaller range box has also formed inside the main box, which is between the zones 0.23593 and 0.2467.
⛏ If either 0.23593 or 0.2467 breaks, we can open a short-term position with low risk. However, the main triggers are the break of the main box’s support and resistance.
⭐ So for a short position, the main trigger is 0.22826, and the early trigger is 0.23593.
⚖️ For a long position, breaking 0.2596 is the main trigger, and breaking 0.2467 is the early trigger.
📝 Final Thoughts
Stay calm, trade wisely, and let's capture the market's best opportunities!
This analysis reflects our opinions and is not financial advice.
Share your thoughts in the comments, and don’t forget to share this analysis with your friends! ❤️

Stellar (XLM) Approaching a Decision Zone inside the Descending Stellar continues to move inside a broad descending channel, a structure that has been guiding price since the October high. The recent decline found support at the lower boundary of this channel, where buyers stepped in and created a short-term reaction. This zone now acts as an important decision point for the next directional move.
Price is currently retesting a mid-range support cluster that includes the fifty percent and sixty-one point eight percent retracement levels of the latest impulse. This confluence zone often acts as a turning area when paired with a corrective decline inside a channel. If the market holds this level and pushes above the minor trendline resistance, the structure allows room for a broader recovery toward the upper boundary of the channel.
A confirmed breakout from the channel, followed by a successful retest, would open the path toward the mid-term resistance near zero point three one. This level aligns with previous supply and serves as the next major upside objective.
However, failure to hold the current support zone may send Stellar back toward the channel’s lower boundary around the zero point two one region. A breakdown below this area would signal continuation of the descending trend and postpone any meaningful recovery attempts.
Key Technical Notes:
Price remains within a well-defined descending channel on the four-hour timeframe.
Current structure is respecting a support cluster formed by Fibonacci retracements and previous demand.
Break and hold above the minor descending trendline would confirm bullish momentum.
First upside target sits at zero point two six, extended target near zero point three one.
Loss of the support zone exposes zero point two one and below.
Bias:
Neutral until the breakout is confirmed. Balanced risk on both sides with clear invalidation levels.

XLMUSD can drop another -50% before it bottoms.Stellar (XLMUSD) is in the middle of its Bear Cycle and currently consolidating within its 1W MA50 (blue trend-line) - 1W MA200 (orange trend-line) in anticipating of Phase 2 of the Cycle's structure.
As you can see, the dominant pattern since the January 2018 High has been a Triangle, with the recent Cycle Top making direct contact with the Lower Highs trend-line and the bottom with the Higher Lows trend-line.
There is a very high degree of symmetry among those Cycles. Fine example is the 1W RSI, which every time it hit 38.50, the price had always tested the 1W MA200 while on its Bear Cycle and always after breaking below the initial (dashed) Triangle, which is the first pattern post the Bull Cycle Top.
As far as the bottom is concerned, there is obviously the Higher Lows trend-line to consider but at the same time, the 0.786 Fibonacci retracement level can also assist as the previous two Cycle bottoms were priced just above it.
As a result we estimate that this Bear Cycle may bottom around 0.13000 before XLM turns into a long-term buy opportunity again.
---
** Please LIKE 👍, FOLLOW ✅, SHARE 🙌 and COMMENT ✍ if you enjoy this idea! Also share your ideas and charts in the comments section below! This is best way to keep it relevant, support us, keep the content here free and allow the idea to reach as many people as possible. **
---
💸💸💸💸💸💸
👇 👇 👇 👇 👇 👇

Wait! Is that a Stellar expansion coming?Stellar has been in denial, whether to expand or stay stagnant for years now, but this time around, Stellar has no way other excuses but to expand. WATCH OUT! 🚀
XLM – The bullish trend is stronger than ever! Updating targetsIn my previous XLM idea, I kept raising the invalidation level higher and higher, gradually bringing it closer to the current price. Eventually, that level was broken.
Many would have considered the plan officially invalidated at that point… but the overall bullish structure didn’t break at all. On the contrary, it only got stronger!
The fact that the price refused to go lower even after breaking the previous key level shows real strength and accumulation. This is exactly the kind of behavior we love to see in a healthy uptrend.
Therefore, I am raising my targets again:
🎯 Previous main target from the last idea: 0.27 (still very much in play)
🎯 New extended target: 0.3
❌New invalidation level (cancellation zone): 0.2505
As long as we stay above this zone, the bullish scenario remains fully intact and I expect continued upside.
The trend is alive and stronger than before. Let’s go, XLM! 🚀
(Chart is updated with new levels)

XLM About to Wake Up? Bullish Targets Ahead!Stellar (XLM) is starting to look very interesting again after a clean consolidation phase. The chart is showing signs of strength and I expect a bullish continuation in the coming days.
🎯My upside targets:
1. $0.255
2. $0.265
3. $0.275 (main target)
❌Invalidation level:
A close below $0.241 would cancel this bullish scenario.
⚠️ Disclaimer: This is not financial advice. This is purely my personal view and technical analysis. Always do your own research and manage your risk and never trade without stoplosses . Trading involves substantial risk of loss.
If you like the idea — hit the LIKE button 🚀
Follow me for more crypto ideas!
Drop in the comments which coin I should analyse next! 👇

$XLM AnalysisCRYPTOCAP:XLM can have another redistribution phase and then go upside to take those liquidities too.

CHN ready to runCHN has demonstrated encouraging developments after emerging from a descending wedge pattern, bolstered by a bullish RSI divergence and the formation of a bull flag on the hourly chart. Furthermore, the daily chart reveals hidden bullish divergence, complemented by support from a trendline established in July and a .05 Fibonacci retracement level. A decisive move above $2 would serve as a strong indicator of a structural shift, potentially paving the way for a more substantial upward trend. Good luck and happy trading! 🍀

XLM/USDT — Rebound from Golden Zone or Continue the Downtrend?The XLM market is regaining attention after revisiting the golden zone at 0.248 – 0.220, an area that has repeatedly served as a strong foundation for buyers in recent months. The price reaction in this zone shows clear signs of sell-side absorption, visible through the emergence of long lower wicks, indicating sellers are losing momentum while buyers are quietly stepping in.
The medium-term structure remains bearish, characterized by a series of lower highs and lower lows. However, a potential technical reversal could unfold if the price manages to close a 2D candle above 0.32. This level acts as the psychological barrier separating a possible trend reversal from a mere corrective bounce.
If buying momentum continues, the layered resistance zones at 0.348 – 0.405 – 0.450 – 0.490 – 0.560 will serve as major checkpoints on the road to recovery. A breakout and consolidation above 0.405 could mark the formation of a new bullish structure.
Conversely, failure to hold the 0.248–0.220 support zone and a confirmed 2D close below 0.22 would strengthen the bearish continuation scenario, with potential downside targets toward 0.18 or even 0.155, where major accumulation may reappear.
---
Bullish Scenario:
Strong rebound from the 0.248–0.220 zone, forming a new higher low.
Main confirmation: 2D close above 0.32.
Step-by-step targets:
1. 0.348 (structure confirmation)
2. 0.405 (mid-term resistance)
3. 0.450–0.490 (distribution zone)
4. 0.560 (final short-term bullish target)
> A sustainable bullish structure forms only if buyers can hold above 0.348–0.37 for multiple consecutive 2D candles.
---
Bearish Scenario:
Breakdown below 0.220 with strong volume confirms sellers’ dominance.
Next targets: 0.18 and 0.155, where liquidity hunts and possible re-accumulation could occur.
This scenario remains valid unless the price reclaims 0.248 after a breakdown (failed reclaim = bearish confirmation).
---
Pattern:
The current setup resembles a “Descending Range with Accumulation Base”, where price continues to make lower highs but forms a flat base structure around 0.248–0.220.
Such formations often mark the early phase of a trend reversal when accompanied by increasing volume and a false breakdown (liquidity sweep).
If a break of structure occurs above 0.32, this could evolve into a Double Bottom Reversal Pattern.
---
Conclusion:
XLM is at a critical moment — the historical golden support zone is being tested once again.
Buyers have a solid chance to initiate a strong reversal, but without a confirmed close above 0.32, it could still turn out to be a dead cat bounce.
Aggressive traders may look to accumulate within the 0.248–0.220 zone with a tight stop below 0.215, while conservative traders should wait for a breakout confirmation above 0.32 to validate a potential trend reversal.
---
#XLM #Stellar #XLMUSDT #CryptoAnalysis #TechnicalAnalysis #SupportZone #BullishReversal #CryptoTrading #Altcoins

$XLM History Rhymes Again. Stellar once again mirrors its 2017 Wyckoff structure, deep accumulation, silent re-accumulation… and then the eruption.
Structure is set, momentum is brewing, only one phase left.
Parabolic Expansion.
Share if you like it 🤝

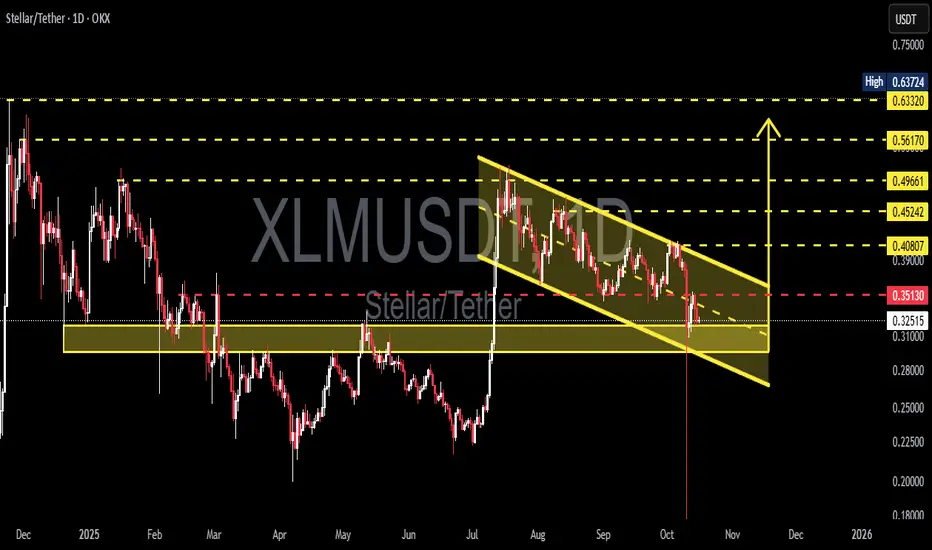
XLM/USDT — A Tense Standoff Between Bulls and Bears!XLM is currently sitting at a critical inflection point after a sharp mid-year rally, followed by a structured descending corrective channel. This setup signals that while bearish pressure remains dominant, quiet buying activity is emerging in the background.
Price is now consolidating right above the major support block around 0.29 – 0.32 USDT (yellow zone) — the same area that sparked a massive vertical breakout back in July. This zone has once again become a battleground between buyers and sellers.
In recent weeks, every dip into this region has triggered quick buy reactions, suggesting potential accumulation by larger players. However, the upper boundary of the descending channel continues to act as dynamic resistance, keeping the market in a tense balance awaiting a decisive move.
---
Key Technical Structure
Pattern: Descending Parallel Channel (structured correction after impulse move)
Major Support Zone: 0.29 – 0.32 USDT
Crucial Resistance: 0.351 USDT
Upside Targets if Breakout: 0.408 / 0.452 / 0.497 / 0.561 / 0.633 USDT
Downside Targets if Breakdown: 0.235 and 0.21 USDT
---
Bullish Scenario — “The Silent Accumulation Play”
If XLM successfully defends the 0.29–0.32 support zone and breaks above 0.351 with convincing daily volume, it could signal the start of a trend reversal.
A breakout from this descending channel could ignite a local short squeeze, pushing price toward 0.408 – 0.497, and potentially up to 0.63 USDT if bullish momentum strengthens.
Such a move would confirm the end of the corrective phase and mark the beginning of a new impulsive wave for XLM.
> “As long as this support holds, the potential for a reversal remains quietly alive.”
---
Bearish Scenario — “Break the Floor”
Conversely, if the demand block at 0.29–0.32 fails to hold, XLM could enter another capitulation leg, targeting 0.235 – 0.21 USDT.
This would confirm the continuation of the downtrend, with the descending channel acting not as a correction, but as a bearish continuation pattern.
Losing this critical support would give full control to sellers and expose the price to thin liquidity areas not revisited since early 2025.
---
Strategic Conclusion
XLM is standing at a make-or-break zone.
The longer the price holds above the yellow block, the stronger the case for a potential reversal wave. But one decisive daily close below 0.29 would likely shift the entire market structure back into a dominant downtrend.
> This quiet phase is where the next big move is being decided.
Don’t react — anticipate.
---
Analyst Notes
Volume remains muted, signaling potential accumulation.
RSI shows a mild bullish divergence (early signs of momentum shift).
Price structure is still locked within the channel; direction will be confirmed only upon a daily breakout.
---
#XLM #Stellar #CryptoAnalysis #TechnicalOutlook #CryptoMarket #Altcoins #CryptoTrading #TechnicalAnalysis #BreakoutSetup #SupportZone

XLMUSDT - This Classic Bearish Setup Could Trap Late LongsYello, Paradisers! Are you prepared for what could be the next leg down in XLMUSDT? Many are still looking for long setups, but this clean bearish formation could catch them completely off guard.
💎XLMUSDT has officially broken below its key ascending support trendline, and price action has since retested this breakdown level—right where it meets a strong resistance zone. This area is further reinforced by the 200 EMA, which has historically acted as a powerful dynamic resistance in trending markets. What adds even more weight to the bearish case is the textbook Double Top-pattern that has formed right at this confluence.
💎To make matters worse for the bulls, we’re seeing clear bearish divergence across multiple indicators, including the MACD, RSI, and Stochastic RSI. When these divergences align with a structural breakdown and a resistance retest, the probability of a bearish continuation significantly increases. This is not the kind of setup smart traders ignore.
💎For those looking to enter this move, aggressive traders could consider a position from the current price area. However, a more disciplined approach would be to wait for a clean pullback into the resistance zone, followed by a clear bearish candlestick confirmation. This not only offers a better entry, but also significantly improves the risk-to-reward ratio by allowing tighter risk placement above the invalidation level.
💎That said, if the price breaks out and closes a full candle above the resistance zone, the current bearish outlook would be invalidated. In that scenario, it would be best to stand aside and wait for clearer price action to develop before making any further decisions. Chasing moves after invalidation is never worth it.
🎖This is how professional traders separate themselves from the crowd—by waiting for high-probability setups and protecting capital when the market proves them wrong. Discipline and timing will always outperform emotion and FOMO in the long run. Stay sharp, Paradisers, and remember: consistency, strategy, and patience are the only way you’ll make it far in this market.
MyCryptoParadise
iFeel the success🌴

XLM analysis (1hour)The price may reach the mirror Support and experience a strong upward move afterward. However, if this zone fails, we should expect the price to drop toward the PRZ (Potential Reversal Zone).

$XLM Fractal $8.00Looking at fractal from the 2017 Era we can see there is a chance the parabolic movement at the end of the pattern will occur again. 1×10^-27

XLM/USDT Is Testing Its Last Line of Defense — Breakout ImminentOverview
XLM is currently sitting at a critical inflection point on the daily timeframe. The chart reveals a clear Descending Channel structure that has persisted since August — a sign of sustained selling pressure, but also a classic setup for a major bullish reversal if price breaks out decisively.
Right now, XLM is reacting from the key demand zone at $0.31–$0.28, which previously triggered a strong upward move. How price behaves here will likely determine the trend direction for the remainder of the year.
---
Pattern Explanation
Descending Channel (Yellow)
This pattern shows consistent lower highs and lower lows, indicating bearish control. However, each touch of the lower boundary has sparked a strong bounce, suggesting that buyers are gradually defending the lower levels.
Critical Demand Zone ($0.31–$0.28)
This zone has historically acted as a strong accumulation area. The recent long wick below this zone signals a liquidity sweep, often seen when institutional players absorb sell orders before pushing price upward.
Pivot Level $0.351
Acts as a psychological and mid-range pivot. A confirmed daily close above this level could trigger a short-term momentum shift in favor of the bulls.
---
Bullish Scenario
If XLM breaks and closes above the channel resistance and confirms a move above $0.351, it could mark the beginning of a trend reversal phase. Potential upside targets include:
Target 1: $0.408 — first local resistance after breakout.
Target 2: $0.452 – $0.497 — secondary resistance and trend validation zone.
Target 3: $0.562 – $0.633 — major resistance cluster and pre-expansion level.
Key confirmation: daily close above channel + volume breakout.
Additional signal: strong bullish candle (Marubozu or engulfing) with high volume.
---
Bearish Scenario
If price fails to hold above $0.31–$0.28 and closes below the channel support, the bearish continuation may extend further:
Target 1: $0.25 — next minor demand area.
Target 2: $0.18–$0.20 — final liquidity zone before potential macro reversal.
A breakdown below this zone may trigger panic selling, but could also represent the final capitulation phase before long-term accumulation begins.
---
Market Dynamics
The long lower wick seen recently indicates liquidity absorption by larger players (whales). This suggests that smart money might be accumulating positions while retail traders exit in fear.
If this pattern continues, XLM could be preparing for a macro reversal, similar to previous recovery structures seen in mid-2025.
---
Conclusion
XLM is currently at a decision zone:
A breakout above $0.351 would confirm a reversal setup and open room for a rally toward $0.40+.
A breakdown below $0.31 would confirm bearish continuation toward deeper liquidity levels.
Traders should wait for confirmation and volume before taking major positions. The $0.31–$0.28 zone remains the most attractive accumulation area, while a breakout above the channel could spark a trend shift with strong momentum.
---
#XLM #Stellar #CryptoAnalysis #TechnicalAnalysis #PriceAction #DescendingChannel #BreakoutSetup #AltcoinAnalysis #SupportAndResistance #MarketStructure