Lumens To The MoonBINANCE:XLMBTC has risen above resistance, came down and made resistance new support. Since the glorydays of end 2017, begin 2018, Lumens has been on a decline along with most of the other alt coins. When the support of 2000 satochi broke, a decline of more than 70% followed. Since then, the price went sideways for more than 40 weeks. However, with the recent price action, Lumens has made it out of its bear market teritory and now shows strength when it bounced off the green support zone. The target for this break out is at the previous support of 2000 satochi.
Xlmbtclong

XLM looking great for a potential trend reversal long term XLMBTC
Just broke and retested resistance at 857 on the weekly. Will be looking for a bounce now on the daily for a potential long term long.
Market structure started to change on the weekly from around March but haven’t been able to break resistance at 857 until now. Also retesting 20 EMA at the same time. As long as we don’t close below the 20 EMA or support at 857, I will consider opening a long entry with first take profit area at around 1753 for a 100% gain.
Potential for much more IMO.


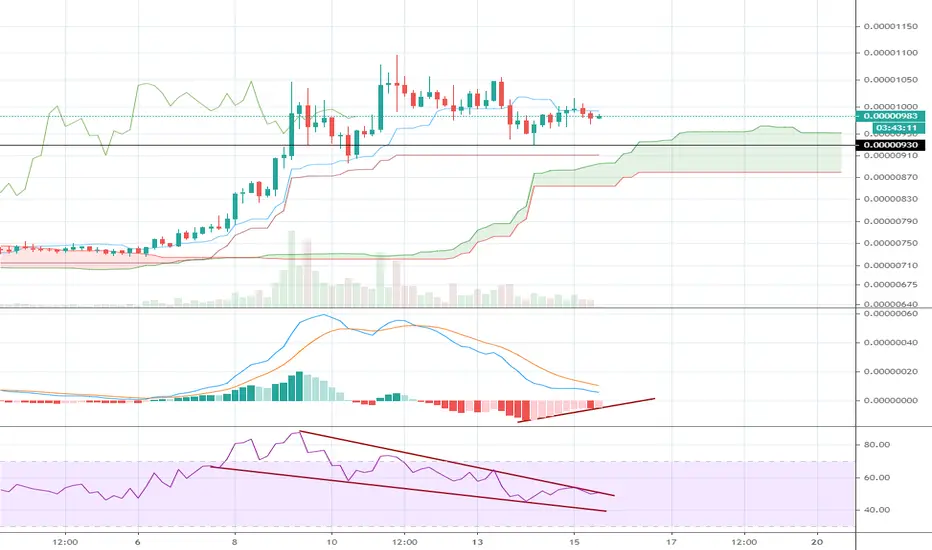
XLM STELLAR LUMENS upside potentialWith this huge volume we can expect STELLAR LUMENS XLM to go to the next resistance level.
A small correction, because of the overbought condition is also in play.
If you are interested to test some amazing buy and sell indicators, which give the signal at the beginning of the candle, not at the end of it, just leave me a message.


XLM.BTC (Y20.P3.E1).Macro structure.BullishHi,
With free time (recently) I like to look across the board and look for potential long opportunities based on key levels and easy to reach structure (trending).
Then if there is a few to chose from, potentially narrow it down to the best options.
I wish I could have a process to track all this once I start doing it, and review regularly. Manually this takes a lot of effort.
What I look for is formation and structure that looks familiar to me, simplicity and I think this one is one of them.
I have not gone through many charts yet and if you look at my recent posts, I have started this process.
Hopefully I will in a short time, maybe this weekend, complete the top 10 or 20 coins.
As for Stellar, one can see the MACRO structure and key points I have placed.
I think XLM against BTC for now, is straight forward.
Cheers,
S.Sari
Daily Chart
4 HRLY Chart

XLMBTCI'm by no means an expert. In my opinion price will continue to rise when looking at 4H chart. Support is respected, Monthly chart MACD crossover as well.


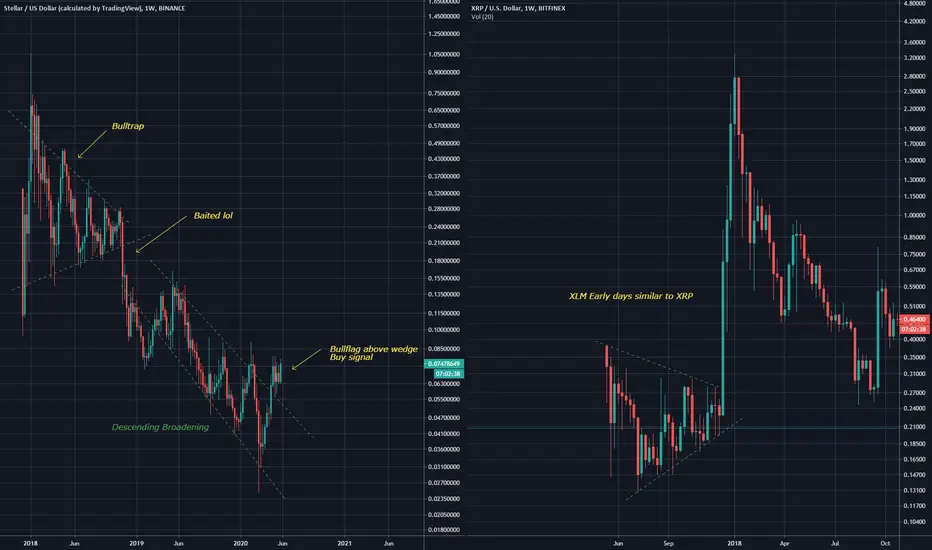
XLM vs XRP trianglescan be seen in the early days of XLM that a symmetrical triangle formed, likewise with XRP, however XRP produced large gains while XLM slumped
Will this triangle action influence future moonshots for the pair?
XLM has formed a bullflag above the wedge
Looks bullish
I am long XRP :D
XLM/BTC - Limited player.from the limit level.
the asset is growing steadily.
Broke through the dynamic resistance.
Let's get him on the good road.
Push ❤️ if you think this is a useful idea!
Before to trade my ideas make your own analysis.
Thanks for your support!

XLM/BTC (Bounce Up at 200ma Dynamic Support?)XLM/BTC
-the price is back at 200ma dynamic support
-holding previous support area at 700s
-still respecting downward trendline resistance
-if we see a break of the trendline
-going Long position is ideal
-stoploss is placed under 684s
-right now, this is a wait and see the game

XLM/USD (Long Term Bullish View)XLM/USD
-long term view
-key support last 2017 history
-bounced at the confluence area
-respecting downward resistance line
-if a breakout is confirmed
-upside potential is up to 0.16-0.28
-key stoploss is under 0.0240


XLM/BTC - 1 year accumulation after a 200-day drop.
Almost one year goes by XLM accumulation
EMA 50 and 200 show the intention to continue the trend.
It is mandatory to test the intersection zone before growth.
The asset has fallen by almost 90%.
Do we wait for full recovery and new heights?
Well, there will be at least a half recovery of the fall, after leaving the accumulation of their 100% can be taken away.
There's a bullish takeover on the monthly timeframe.
Let's take a closer look at the schedule:
XLM/USDT
Push like if you think this is a useful idea!
Before to trade my ideas make your own analysis.
Write your comments and questions)
Thanks for your support!

Neutral position XLMShowing some bullish signs such as being above the 50MA and the 200MA leveling out.
However past has shown .236 to be a significant resistance for price.
Hence my neutral stance on XLM currently if I see something else (bullish or bearish) I will update my stance.
