Wait! Is that a Stellar expansion coming?Stellar has been in denial, whether to expand or stay stagnant for years now, but this time around, Stellar has no way other excuses but to expand. WATCH OUT! 🚀
XLMLONG
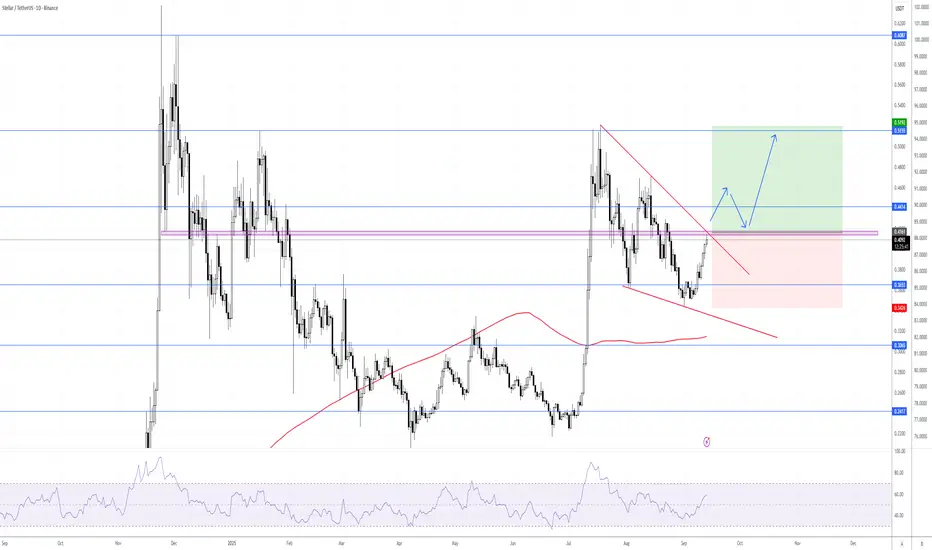
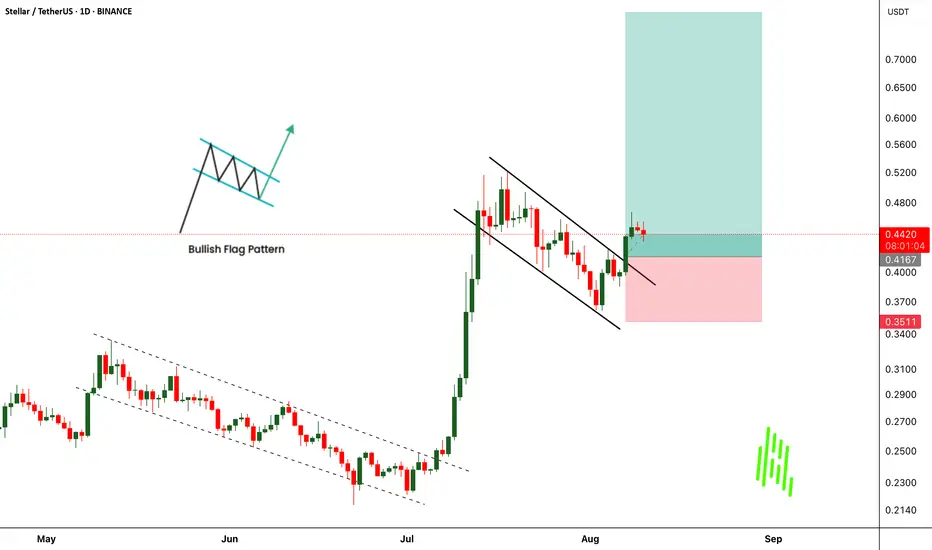
XLM/USDT — A Tense Standoff Between Bulls and Bears!XLM is currently sitting at a critical inflection point after a sharp mid-year rally, followed by a structured descending corrective channel. This setup signals that while bearish pressure remains dominant, quiet buying activity is emerging in the background.
Price is now consolidating right above the major support block around 0.29 – 0.32 USDT (yellow zone) — the same area that sparked a massive vertical breakout back in July. This zone has once again become a battleground between buyers and sellers.
In recent weeks, every dip into this region has triggered quick buy reactions, suggesting potential accumulation by larger players. However, the upper boundary of the descending channel continues to act as dynamic resistance, keeping the market in a tense balance awaiting a decisive move.
---
Key Technical Structure
Pattern: Descending Parallel Channel (structured correction after impulse move)
Major Support Zone: 0.29 – 0.32 USDT
Crucial Resistance: 0.351 USDT
Upside Targets if Breakout: 0.408 / 0.452 / 0.497 / 0.561 / 0.633 USDT
Downside Targets if Breakdown: 0.235 and 0.21 USDT
---
Bullish Scenario — “The Silent Accumulation Play”
If XLM successfully defends the 0.29–0.32 support zone and breaks above 0.351 with convincing daily volume, it could signal the start of a trend reversal.
A breakout from this descending channel could ignite a local short squeeze, pushing price toward 0.408 – 0.497, and potentially up to 0.63 USDT if bullish momentum strengthens.
Such a move would confirm the end of the corrective phase and mark the beginning of a new impulsive wave for XLM.
> “As long as this support holds, the potential for a reversal remains quietly alive.”
---
Bearish Scenario — “Break the Floor”
Conversely, if the demand block at 0.29–0.32 fails to hold, XLM could enter another capitulation leg, targeting 0.235 – 0.21 USDT.
This would confirm the continuation of the downtrend, with the descending channel acting not as a correction, but as a bearish continuation pattern.
Losing this critical support would give full control to sellers and expose the price to thin liquidity areas not revisited since early 2025.
---
Strategic Conclusion
XLM is standing at a make-or-break zone.
The longer the price holds above the yellow block, the stronger the case for a potential reversal wave. But one decisive daily close below 0.29 would likely shift the entire market structure back into a dominant downtrend.
> This quiet phase is where the next big move is being decided.
Don’t react — anticipate.
---
Analyst Notes
Volume remains muted, signaling potential accumulation.
RSI shows a mild bullish divergence (early signs of momentum shift).
Price structure is still locked within the channel; direction will be confirmed only upon a daily breakout.
---
#XLM #Stellar #CryptoAnalysis #TechnicalOutlook #CryptoMarket #Altcoins #CryptoTrading #TechnicalAnalysis #BreakoutSetup #SupportZone

$XLM Fractal $8.00Looking at fractal from the 2017 Era we can see there is a chance the parabolic movement at the end of the pattern will occur again. 1×10^-27

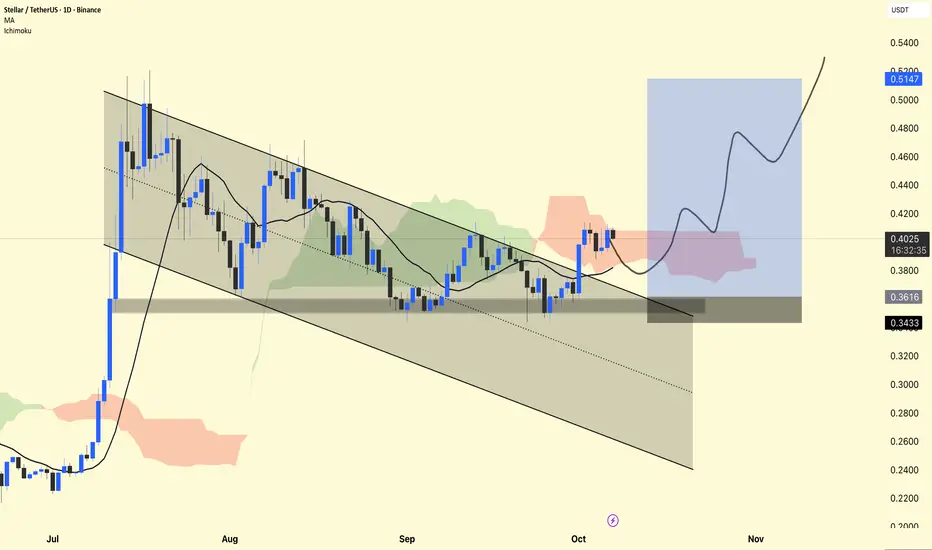
XLM/USDT — Daily Chart Analysis !!XLM/USDT — Daily Chart Analysis
The price is currently trading around $0.40, holding firmly above the demand zone ($0.36–$0.34).
The chart shows a falling channel breakout, which is a bullish reversal pattern.
The Ichimoku Cloud is showing early signs of a bullish trend as the price is attempting to hold above the cloud base.
The moving average (MA) at $0.38 is acting as dynamic support – a positive sign for further upside.
📈 Long Setup:
Entry Zone: $0.38–$0.40
Stop-Loss: Below $0.34 (clear invalidation level)
Targets:
🎯 $0.46 → First Target
🎯 $0.51 → Main Swing Target
DYOR | NFA
XLM/USDT | Falling WedgeBINANCE:XLMUSDT is forming a falling wedge pattern, and I’ve marked the breakout point.
Once it breaks out, I’d expect it to sequentially test the horizontal resistance levels.

Stellar Bullish FlagXLM/USDT formed a bullish falling wedge and is now approaching resistance. Breakout confirmation above 0.4161 opens the path to 0.5155, with potential extension to 0.6087. Wait for the breakout and the retest. Stop loss below 0.3425.
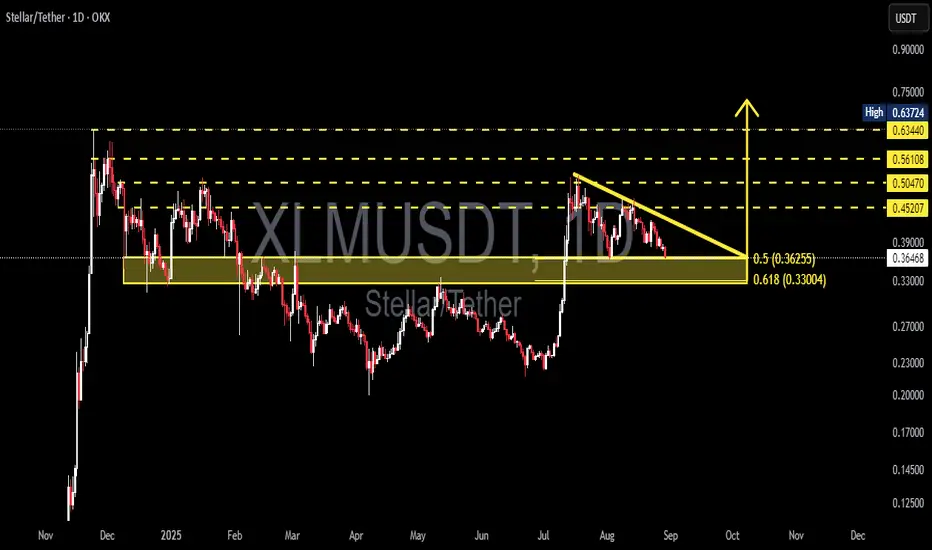
XLM/USDT — Descending Triangle at a Key Fibonacci Zone!🔎 Market Overview
Currently, XLM/USDT (Daily, OKX) is trading around 0.3645, testing the golden support zone between 0.3625 (0.5 Fib) and 0.3300 (0.618 Fib).
This area is highly significant because:
It has acted as a historical demand zone, repeatedly holding the price.
It aligns with the Fibonacci golden pocket (0.5 & 0.618 levels), often watched by institutional traders.
Price action forms a descending triangle, where sellers create consistent lower highs while buyers defend a horizontal floor.
In short, we are at a make-or-break decision point: will XLM break down further, or will buyers trigger a strong breakout against the classic bearish setup?
---
📐 Structure & Technical Context
Pattern: Descending Triangle → statistically bearish continuation, but strong support zones often trigger bullish fakeouts.
Lower Highs: indicate steady selling pressure.
Horizontal Support: strong cluster around 0.33 – 0.3625, coinciding with golden pocket Fib levels.
Key Resistances Above:
0.4520
0.5047
0.5610
0.6340 – 0.6370 (major supply zone).
A breakout above could flip the triangle into a bear trap and spark a mid-term rally.
---
🚀 Bullish Scenario
Main condition: price must break above the descending trendline with a convincing daily close + high volume.
Conservative entry: wait for breakout + retest (price breaks the trendline, then retests as support).
Upside Targets:
TP1 = 0.4520
TP2 = 0.5047
TP3 = 0.5610
TP4 = 0.6340 – 0.6370 (major resistance zone).
Invalidation: daily close below 0.33 (breakdown confirmed).
📊 Example Risk/Reward:
Entry = 0.3645
Stop = 0.33
TP1 = 0.4520
→ Risk = 0.0345 | Reward = 0.0875 → R:R ≈ 2.5 : 1
---
🩸 Bearish Scenario
If support breaks:
Trigger: daily close < 0.33 (0.618 Fib).
Downside Targets:
First = 0.27
Next = 0.23
Extended = 0.17 (historical swing low).
Strategy: short on breakdown + retest (support turned resistance).
Invalidation: price reclaims trendline & closes above 0.4520.
---
📊 Trading Plan Summary
The 0.33–0.3625 zone is the golden decision point:
Holding → potential bullish rally.
Breaking → deeper bearish continuation.
The descending triangle clearly shows where pressure is building.
Always manage risk tightly, as this pattern often creates false breakouts before the real move.
---
XLM is sitting at a critical crossroads. A descending triangle has formed exactly on the golden pocket Fibonacci (0.33–0.3625). A breakout could trigger upside targets at 0.45 / 0.50 / 0.56, while a breakdown could lead to 0.27 / 0.23. Wait for daily close + volume confirmation. This golden zone will decide XLM’s next big move.
#XLM #Stellar #XLMUSDT #CryptoAnalysis #Altcoin #DescendingTriangle #SupportResistance #Fibonacci #Breakout #BearishOrBullish #SwingTrade
XLMUADT Ready for Another Moonshot After Bullish Flag Breakout!$XLMUADT has just broken out of a well-formed bullish flag pattern, signaling the potential start of a strong upward move. This comes after its earlier breakout from a rising channel, which delivered impressive gains to traders who caught the move. The current breakout setup mirrors that previous rally, and if history repeats, we could be looking at another powerful uptrend in the making.
With momentum building and technicals aligning, buyers seem to be taking control again. However, as always, risk management is key, keep a strict stop loss in place to protect capital and lock in profits as the move unfolds. The market has already shown us what CRYPTOCAP:XLM can do, and this breakout might just be the next big opportunity.
$XLMUADT Currently trading at $0.44
Buy level : Above $0.415
Stop loss : Below $0.35
Target 1: $0.522
Target 2: $0.6
Target 3: $0.8
Max leverage 5x
Always keep stop loss
Follow Our Tradingview Account for More Technical Analysis Updates, | Like, Share and Comment Your thoughts
Bullish on XLMUSDTStellar / XLM turns bullish again, retracement is over. We have an EMA cross, we have passed an high volume node and now we try to move above EMA200. As soon as we manage to stay above we will head for the targets around 0.46$ and 0.52$.
For more trade ideas check and insights check our profile.
Disclamer: only entertaining purpose, no financial advice - trading is risky.
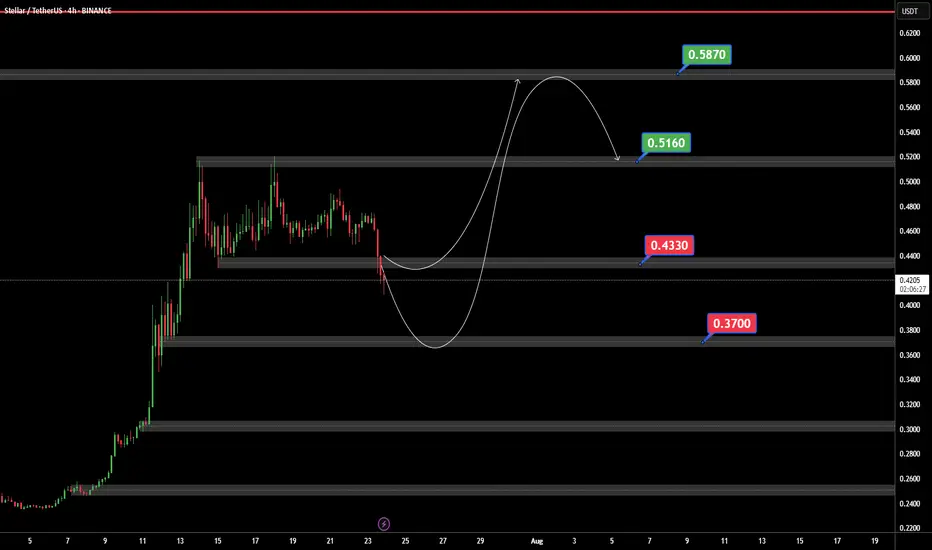
XLMUSDTIf BINANCE:XLMUSDT can support 0.4430 $ ready for jump to 0.5160 and best target in 0.5873 $.
But if XLM can price breaked 0.4330$ support we ready for a bear trend.
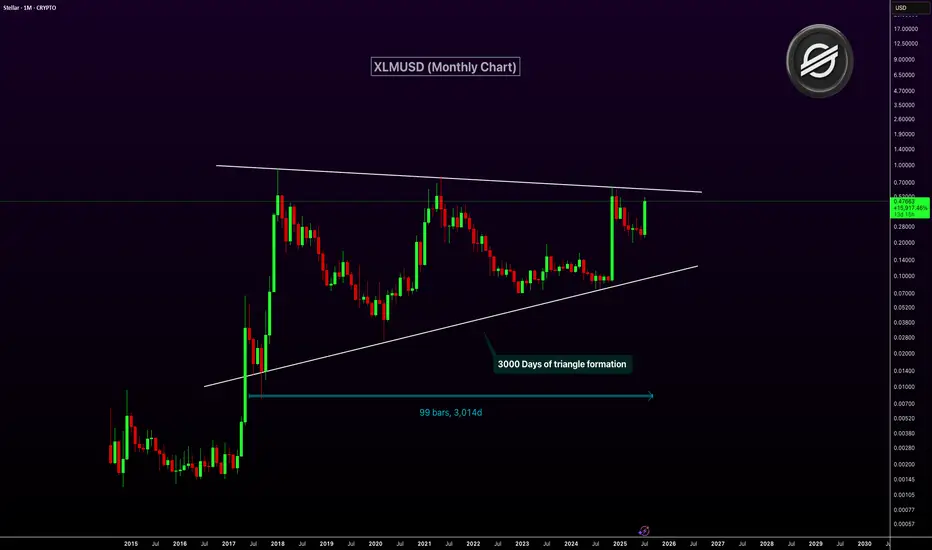
XLMUSD Nearing Breakout After 3,000-Day Triangle FormationXLM has been consolidating inside a massive symmetrical triangle for over 3,000 days. This long-term pattern on the monthly chart dates back to 2017. The price is now approaching the upper resistance trendline of the triangle. A breakout from this structure could ignite a major bullish rally.
The current monthly candle shows strong momentum with over 100% gains. A confirmed breakout above resistance could mark the start of a macro uptrend. This triangle is one of the most significant technical setups in XLM’s history.
Target 1: $1.00
Target 2: $2.50
Target 3: $5.00
XLMUSDT Eyes on $0.3109: Breakout Zone Could Ignite Rapid ClimbXLMUSDT is currently forming a bullish reversal structure on the 4-hour chart. After a prolonged downtrend, price has established a support base around the $0.2570 level. This zone has acted as a key support, rejecting downside attempts multiple times, and creating a potential accumulation floor.
The price is now pushing above short-term consolidation, hinting at a possible breakout from the recent range. This range behavior, followed by an early higher low formation, indicates that buyers may be stepping in more aggressively.
Support Zone
The support zone around $0.2570 to $0.2585 is structurally significant. Price dipped into this level twice and was strongly rejected both times. The most recent low around this zone created a long wick, suggesting liquidity grab and potential trend reversal.
This zone now serves as a clear invalidation point for the bullish setup. A break below would likely invalidate the long bias and open the door for a deeper retracement.
Resistance Levels and Take-Profit Targets
The chart identifies two major resistance levels.
The first resistance is around $0.2902, marking Take Profit 1 (TP1). This level acted as resistance multiple times in the past and should be the first area where selling pressure could return.
The second resistance, marked at $0.3109 (TP2), is a higher timeframe resistance zone. It was previously a strong ceiling before the drop in early June. If the momentum is sustained, this area becomes a logical final target for the current bullish swing.
Supertrend Confirmation
The Supertrend indicator has recently flipped green, supporting the bullish bias. The flip occurred after price reclaimed the mid-range, and the price is now consolidating just above the Supertrend baseline.
This is a classic bullish signal on the 4H chart, particularly when it aligns with a structural bottoming pattern and a clean risk-reward setup.
Risk–Reward Setup
The current setup offers a favorable risk-to-reward ratio of 2.49. Entry is positioned near $0.2723, with the stop-loss placed just below the support zone at $0.2570. This limits downside risk to approximately 5.6%.
The upside, on the other hand, stretches up to $0.3109, offering potential gains of around 14%. Even the first target at $0.2902 offers a decent 6.5% return, making this trade attractive for swing traders aiming for a mid-term move.
Momentum Shift and Potential Breakout
What strengthens the bullish case further is the price action attempting to break out of the recent lower high zone. There is a clear effort to reclaim momentum, and a successful 4H candle close above $0.2770 would signal a clean breakout and continuation.
Earlier price action shows signs of accumulation, including a liquidity sweep below $0.2570 followed by strong rejection — a common reversal pattern in crypto markets.

XLM short termHello
this time I am posting a short term idea (few days to few weeks).
After explosion in Q4 of 2024 XLM has formed a downtrending channel which can potentially turn into a bull flag.
Currently XLM price is sitting at a bottom of this channel.
Short term traders can look to purchase some XLM now and wait till it comes towards the top of the channel to sell and get some profit. If it reaches top of the channel potential is 50% price increase.
If the market turns bullish in next few days to weeks XLM might even break upwards out of this bull flag but do not count on it just yet.
This idea is somewhat risky so proceed with extreme caution and with tight stop-loss below the channel.
Good luck.

XLMUSDT Weekly LONG This is a weekly technical analysis for educational purposes on XLMUSDT. I believe that Stellar will find new higher high levels in the middle of the 2025 Bull Season.
As I mentioned before on my ALGOUSDT Weekly Analysis ;
"Considering the global economic crisis, the technical recession in the United States, the suppression of gold and other commodities, the real estate and unemployment crisis in China, and the European Union countries' struggle with inflation, I believe that market makers (the bulls) may create a false FOMO (Fear of Missing Out) during the 2024 BTC halving period, potentially driving BTC to levels of perhaps 50K+ before ending the year 2024 around the 20-25K range. When we consider the global effects, the real bull season is likely to occur between 2025 and 2026.
Reaching 100K in Bitcoin by 2024 wouldn't make much sense if most people don't have the financial means. It's important to remember that patient wealthy individuals often capitalize on the impatience of those with fewer resources. (let's say poors with high dreams) Those with limited means may not have the capital to participate in the market for couple of years.
This is not "clever riches profit from the idiot riches game". Never was. I believe.
I may be wrong, :)
Regards,

XLM Long following XRP StructureChart Comparison: XLM vs. XRP
On the left side of the chart, we have XLM/USDT, and on the right, we're comparing it with XRP/USDT. Both charts display a very similar structural pattern, with XRP showing a more advanced movement compared to XLM. It appears that XLM is currently lagging behind XRP but is likely to follow suit soon.
Given the similarity in price action and market behavior, I anticipate XLM will catch up, and I am expecting a move towards the marked target in the near future. If XLM continues to follow XRP's trajectory, we should see an upward move that aligns with the target zone.
Keep an eye on XLM for a potential breakout and move towards the target area marked in the chart.

#XLM/USDT Ready to go higher#XLM
The price is moving in a descending channel on the 1-hour frame and sticking to it well
We have a bounce from the lower limit of the descending channel, this support is at 0.4300
We have a downtrend on the RSI indicator that is about to be broken, which supports the rise
We have a trend to stabilize above the moving average 100
Entry price 0.4434
First target 0.4590
Second target 0.4746
Third target 0.4927

XLM SHORT Stellar Lumens 5-15min Chart:It appears to me there will be a shorting, so I am looking at a short-term scalp short on XLM 5min chart. Tradingview would not let me publish 5min so I am publishing on a 15min chart.

xlm long!"🌟 Welcome to Golden Candle! 🌟
We're a team of 📈 passionate traders 📉 who love sharing our 🔍 technical analysis insights 🔎 with the TradingView community. 🌎
Our goal is to provide 💡 valuable perspectives 💡 on market trends and patterns, but 🚫 please note that our analyses are not intended as buy or sell recommendations. 🚫
Instead, they reflect our own 💭 personal attitudes and thoughts. 💭
Follow along and 📚 learn 📚 from our analyses! 📊💡"

XLM/USDT BULL FLAG In this idea I show that XLM is about to pump out of a bull flag and really start taking off. Pretty basic chart here not too much frills or fluff. Hope you get in for the ride much love - ND

Possible XLM Parallel Channel Bullish ReversalPossible bullish reversal on XLM.
Reversals usually occur from the same distance in length as a the parallel channels top and bottom.

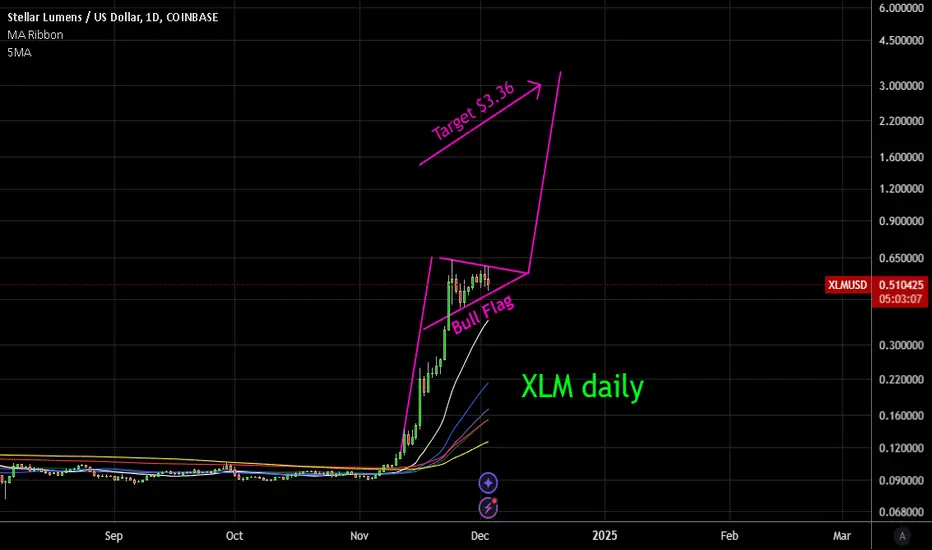
XLM Daily Bull FlagDaily chart of XLM with bull flag target of $3.36 usd. This is a 7x profit potential over the coming months. This is for educational purposes only, not financial advise.
Can XLM hit $1 this year? Let's find out!The Stellar price has recorded a strong bullish recovery around its $0.43 mark. By hovering close to that psychological barrier since the week started, this altcoin has formed a resistance/support level around the price range. This further makes it a crucial watch level.
Specifically, with an intraday surge of over 14% with a trading volume of $4.233 billion, the Stellar price has reclaimed the $0.50 mark. Moreover, with the recent bullish candle, this altcoin has formed a flag pattern in the 1D time frame, suggesting a significant increase in the price action.
The Relative Strength Index (RSI) continues hovering above the overbought range in the daily time frame. This highlights an increase in the buying-over-selling pressure for the altcoin in the crypto market.
Further, the EMA 50/200-day has displayed a constant uptrend after experiencing a Golden Cross earlier this month. This suggests that the altcoin may continue gaining value in the upcoming time.
If the bullish sentiment sustains, the XLM coin price will breach its important resistance level of $0.50 and head toward its upper high of $0.60. Maintaining the price above that level could set the stage for this altcoin to retest its upper high of $0.70.
Conversely, if the bears outrun the bulls, the Stellar token will retest its support trendline of the flag pattern. Furthermore, if the bears dominate the crypto space, this could result in it plunging toward its lower support level of $0.40.

Be patient with XLMUSD, it's time will comeHello everyone,
today I choose to talk about XLM.
Many consider it a dead coin, since it did not make a new ATH in 2021. But I prefer trading with verified coins that have been around for long enough to establish patterns in their charts. And I trade based on these patterns.
This is a weekly chart of XLMUSD.
It is one of the sleepiest coins. But when it wakes up, it is a rocket.
How to read my chart:
- When XLM is in bull market, it respects 21 weekly EMA -> price action above it. (arrow up)
- When XLM is in bear market, it respects 21 weekly EMA -> price action below it.
- In accumulation, price action plays with 21 weekly EMA, goes above it then below, then again above it, and below... (rectangle)
Sure, this does not help, right. How could you know if we are still playing with 21 weekly EMA or is this cross above start of parabolic rise. Well, the answer lies in RSI.
XLM goes parabolic once weekly RSI crosses above 70 (circle). We are not there yet so I do not expect fireworks tomorrow. Remember, XLM is one of the last ALTs in the bull run to wake up, that is why its bull runs are so violent. Because once it wakes up it makes up for all the sleeping in matter of few weeks.
More info on XLM:
- XLM created its base (red line). It has respected it since 2018. It has touched it in 2023 and 2024.
- People think XLM slept through 2023 bull run and hence is dead. But the fact is that the 2023 bull run is still not over and XLM will mark the end of it with its parabolic run.
I have started to slopwly accumulate XLM with the money gained from BTC and other ALTs that have already surged.
XLM potential is from 5x to 15x. You choose and determine where you want to take profit. BUT MAKE SURE TO TAKE THE PROFIT!
And remember: If you buy low, you do not need coin to break ATH to make substantial amount of money. Buying price is much more important then selling price.
Good luck.
P.S. Check my other posts. If you find value in my ideas, boost and share them.
If you want to stay notified, follow me.
