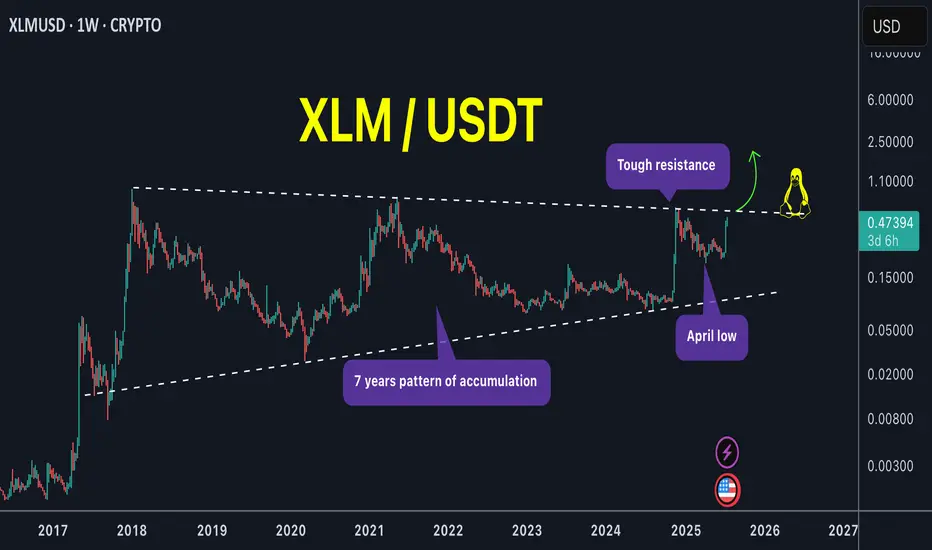
XLM/USDT Secondary trend. 14 04 2025Logarithm. Time frame 3 days. After a big pump "with a stick" (so that the "waiters" who want "a little cheaper" would not have time to buy) +8.5X from the accumulation zone of 2.4 years, now a descending wedge is forming on the rollback, similar to 2017. Breaking through its resistance (breaking the downward trend) - the second wave of price growth:
1) through consolidation and sideways movement (cutting the zone, dumping "in waves").
2) aggressive pump as in 2017 "with a stick" and entry into the main distribution zone (late autumn 2025)
The previous idea of the secondary trend was published on 14 01 2024 Exactly when the position was being collected in the horizontal channel in the 4 zones shown, as well as the reversal zone and the percentage of this first strong pump (under XRP).
XLM/USDT Secondary trend. 14 01 2024
XLM/USD Main trend. Timeframe 1 week. Channel. Publication in 2022.
Local wedge breakout zone.
XLMUSD

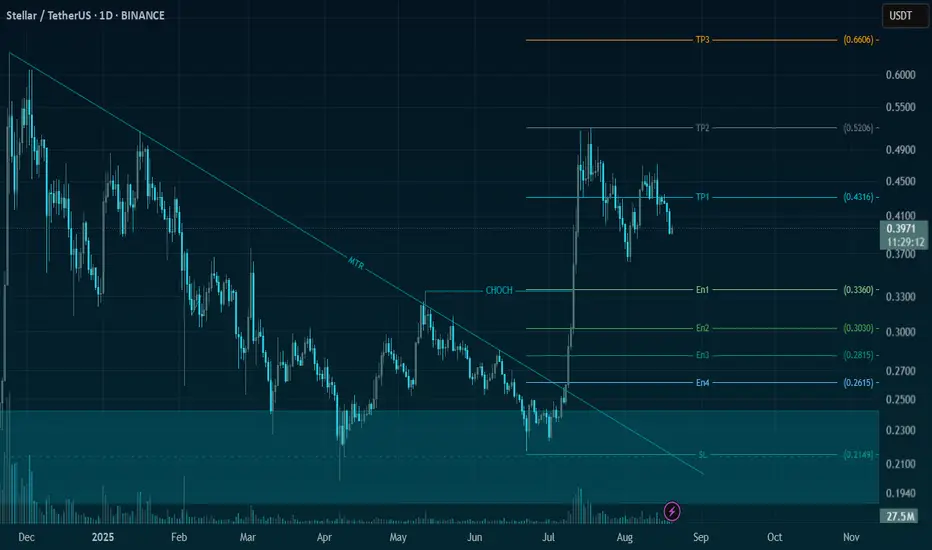
XLM/USDT - Bullish Momentum Gaining Strength🚀 Trade Setup Details:
🕯 #XLM/USDT 🔼 Buy | Long 🔼
⌛️ TimeFrame: 1D
--------------------
🛡 Risk Management (Example):
🛡 Based on $10,000 Balance
🛡 Loss-Limit: 1% (Conservative)
🛡 The Signal Margin: $375.52
--------------------
☄️ En1: 0.336 (Amount: $37.55)
☄️ En2: 0.303 (Amount: $131.43)
☄️ En3: 0.2815 (Amount: $168.98)
☄️ En4: 0.2615 (Amount: $37.55)
--------------------
☄️ If All Entries Are Activated, Then:
☄️ Average.En: 0.2929 ($375.52)
--------------------
☑️ TP1: 0.4316 (+47.35%) (RR:1.78)
☑️ TP2: 0.5206 (+77.74%) (RR:2.92)
☑️ TP3: 0.6607 (+125.57%) (RR:4.72)
☑️ TP4: 0.8946 (+205.43%) (RR:7.71)
☑️ TP5: 1.2501 (+326.8%) (RR:12.27)
☑️ TP6: Open 🔝
--------------------
❌ SL: 0.2149 (-26.63%) (-$100)
--------------------
💯 Maximum.Lev: 2X
⌛️ Trading Type: Swing Trading
‼️ Signal Risk: 🙂 Low-Risk! 🙂
🔎 Technical Analysis Breakdown:
This technical analysis is based on Price Action, Elliott waves, SMC (Smart Money Concepts), and ICT (Inner Circle Trader) concepts. All entry points, Target Points, and Stop Losses are calculated using professional mathematical formulas. As a result, you can have an optimal trade setup based on great risk management.
📊 Sentiment & Market Context:
Stellar (XLM) is showing strong bullish momentum amid a growing demand for scalable, fast cross-border payment solutions. With the expanding adoption of Stellar’s blockchain technology in financial institutions and partnerships driving real-world use cases, market sentiment is turning increasingly optimistic. This fundamental strength combined with solid technical setups makes XLM/USDT a compelling long opportunity.
⚠️ Disclaimer:
Trading involves significant risk, and past performance does not guarantee future results. This analysis is for informational purposes only and should not be considered financial advice. Always conduct your research and trade responsibly.
💡 Stay Updated:
Like this technical analysis? Follow me for more in-depth insights, technical setups, and market updates. Let's trade smarter together!
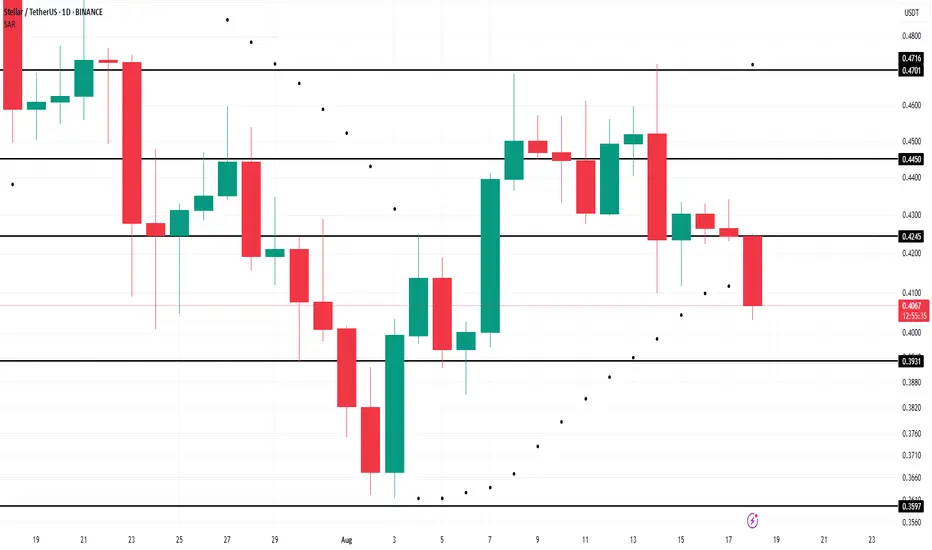
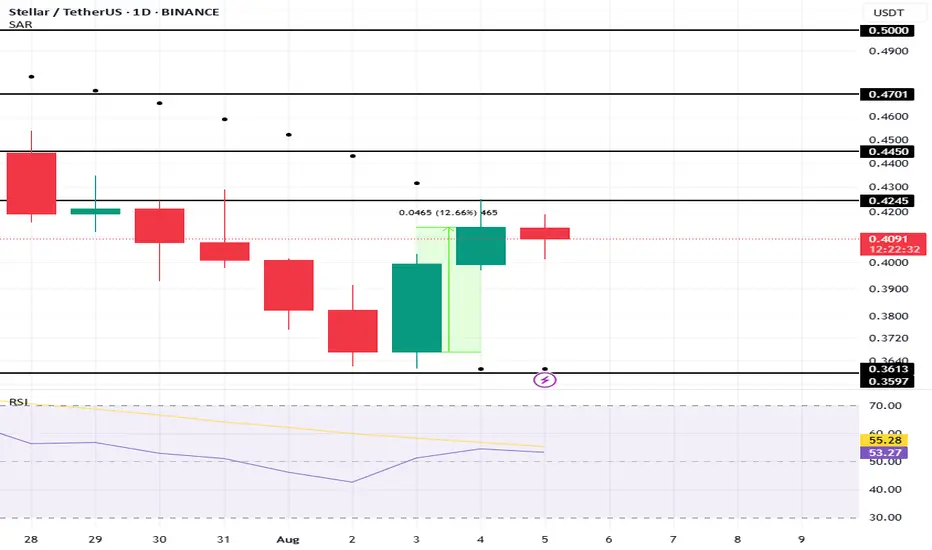
Stellar Falls To $0.40; But Parabolic SAR Flags Deeper DeclineAt the time of writing , BINANCE:XLMUSDT trades at $0.409 and faces a risk of slipping lower. Technical factors point to a potential drop toward $0.393 support, a level that may determine whether bearish control continues to strengthen in the coming sessions.
From a technical perspective, BINANCE:XLMUSDT momentum is leaning bearish . The Moving Average Convergence Divergence (MACD) indicator has confirmed a bearish crossover, signaling growing downside pressure. The crossover reflects weakening strength among buyers and indicates a market environment increasingly favorable for sellers.
Adding to the concern, the Parabolic SAR indicator is positioned above candlesticks, acting as resistance. This placement confirms a downtrend, suggesting BINANCE:XLMUSDT could face additional declines. If bearish sentiment dominates, the cryptocurrency might even test deeper support near $0.359, worsening investor confidence further.
However, if traders shift toward a bullish stance, Stellar has recovery potential. Reclaiming $0.424 as support could allow BINANCE:XLMUSDT to climb toward $0.445. Achieving this move would negate the bearish outlook, signaling renewed strength and stabilizing the asset after recent declines.
Xlm - More short term upside. Should we be medium term bearish?There is a high probability that Btc will go lower (see my Aug 16 Btc chart). Does that mean alts will too? I hope not, but I need to protect my gains. Being too bulish can get me in trouble, especially if I'm not taking profits.
Being aware of inflection points has proven to be extremely helpful in retaining my gains. If I'm wrong and the asset pumps, that's OK too. Because I have learned that losing out on "potential gains" (FOMO) is NOT the same as losing my capital.
May the trends be with you.

xlm futurefor 1 year from now, xlm can possible reach 250 to 314 billion dollars market cap.
it is the one million scenario that exist and it can be wrong.

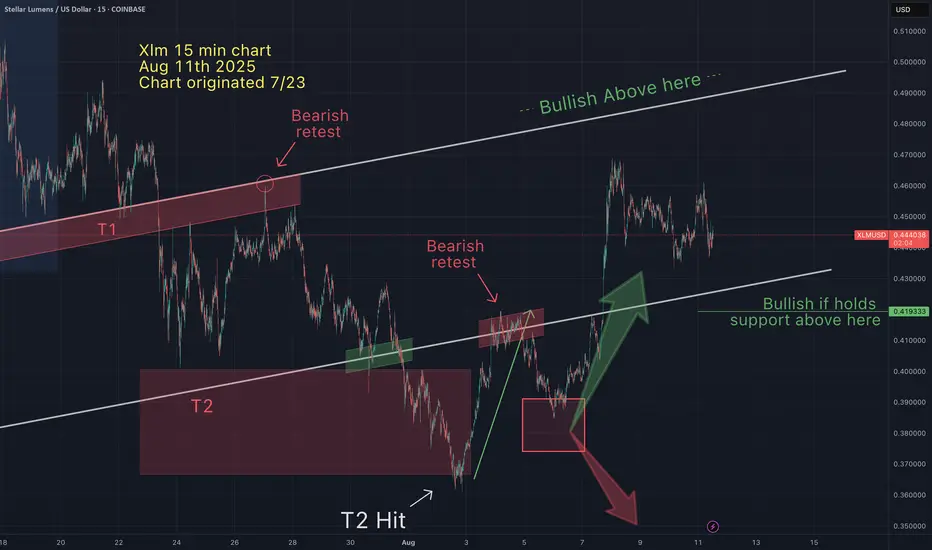
How did I know that Xlm would retrace...then bounce off $0.38?On Aug 5th I suggested that Xlm was apporaching an "inflection point", indicated by my green and red arrows converging at $0.38. See chart below from Aug 5th.
In mathematics an "inflection point" is a point in the curve at which a change in the direction of curvature occurs. These price charts are merely graphs, with coordinates and reoccuring patterns. Anticipating inflection points allow me to determine directionality. Knowing where direction may change allows me to either make quick profitable decisions and/or where to set appropriate stops (invalidation).
TA works!
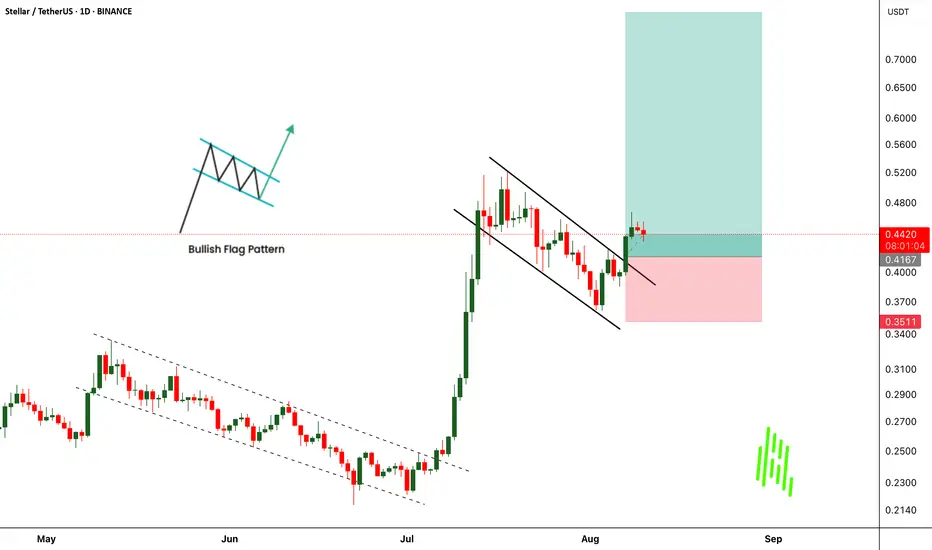
XLMUADT Ready for Another Moonshot After Bullish Flag Breakout!$XLMUADT has just broken out of a well-formed bullish flag pattern, signaling the potential start of a strong upward move. This comes after its earlier breakout from a rising channel, which delivered impressive gains to traders who caught the move. The current breakout setup mirrors that previous rally, and if history repeats, we could be looking at another powerful uptrend in the making.
With momentum building and technicals aligning, buyers seem to be taking control again. However, as always, risk management is key, keep a strict stop loss in place to protect capital and lock in profits as the move unfolds. The market has already shown us what CRYPTOCAP:XLM can do, and this breakout might just be the next big opportunity.
$XLMUADT Currently trading at $0.44
Buy level : Above $0.415
Stop loss : Below $0.35
Target 1: $0.522
Target 2: $0.6
Target 3: $0.8
Max leverage 5x
Always keep stop loss
Follow Our Tradingview Account for More Technical Analysis Updates, | Like, Share and Comment Your thoughts
Bullish on XLMUSDTStellar / XLM turns bullish again, retracement is over. We have an EMA cross, we have passed an high volume node and now we try to move above EMA200. As soon as we manage to stay above we will head for the targets around 0.46$ and 0.52$.
For more trade ideas check and insights check our profile.
Disclamer: only entertaining purpose, no financial advice - trading is risky.
Stellar (XML) Price Ends 2-Week Downtrend As Inflows SpikeBINANCE:XLMUSDT price is currently trading at $0.41 1, just under the resistance level of $0.424. Breaking this resistance will be key for XLM to recover the recent losses and continue its upward trajectory. The Parabolic SAR moving below the candlesticks after two weeks signals that the downtrend is coming to an end.
Ethereum’s technical indicators also suggest a return to bullish momentum. The Relative Strength Index (RSI) has moved back into the positive zone, above the neutral 50.0 mark, after briefly dipping into bearish territory. This reversal from the prior downtrend shows that BINANCE:XLMUSDT is regaining strength.
The RSI indicates that investor sentiment is improving . The brief period of bearishness was likely caused by broader market uncertainty and skepticism. However, with the RSI back in the positive range, the likelihood of further price increases has increased.
If Stellar can flip $0.424 into support , it could pave the way for a rise past $0.445 and possibly reach $0.470 . This would allow BINANCE:XLMUSDT to recover a significant portion of the losses it sustained over the past two weeks and continue its uptrend.
However, if broader market conditions fail to remain bullish and investor sentiment turns negative, BINANCE:XLMUSDT could face a decline. A failure to maintain support at $0.424 could lead XLM to drop to $0.393 , with further bearish momentum pushing the price to $0.359, invalidating the bullish outlook.
Stellar (XLM) Shoot Up 11%, Aims To Cross This Barrier
BINANCE:XLMUSDT price has increased by 11% over the last 24 hours , positioning it among the top-performing altcoins. Trading at $0.4077 , the altcoin remains under the resistance of $0.4245. This indicates potential for a breakout if broader market conditions stay favorable and support the bullish trend.
The 50-day exponential moving average (EMA) provides strong support, signaling that the broader market momentum is bullish. This support could propel BINANCE:XLMUSDT towards $0.4450 , with further gains potentially pushing it to $0.4701, confirming the continuation of its positive trajectory in the market if conditions remain favorable.
However, if market conditions worsen , especially with the upcoming August 7 announcements, XLM might fail to breach $0.4245 . In this case, the price could fall to $0.3597 , and losing this support would invalidate the bullish outlook for BINANCE:XLMUSDT , signaling potential downside risks in the coming days.

XLMUSDT 1H Market OutlookBINANCE:XLMUSDT
Trade Setup:
Target 1: 0.4513
Target 2: 0.4872
Target 3: 0.5231
Target 4: 0.1808
Stop Loss: 0.3795
Pattern: The chart indicates a "CHOCH" (Change of Character) pattern, suggesting a potential trend reversal or continuation depending on context.
Trend: Recent price action shows an upward movement after a dip, with the price approaching the entry level.

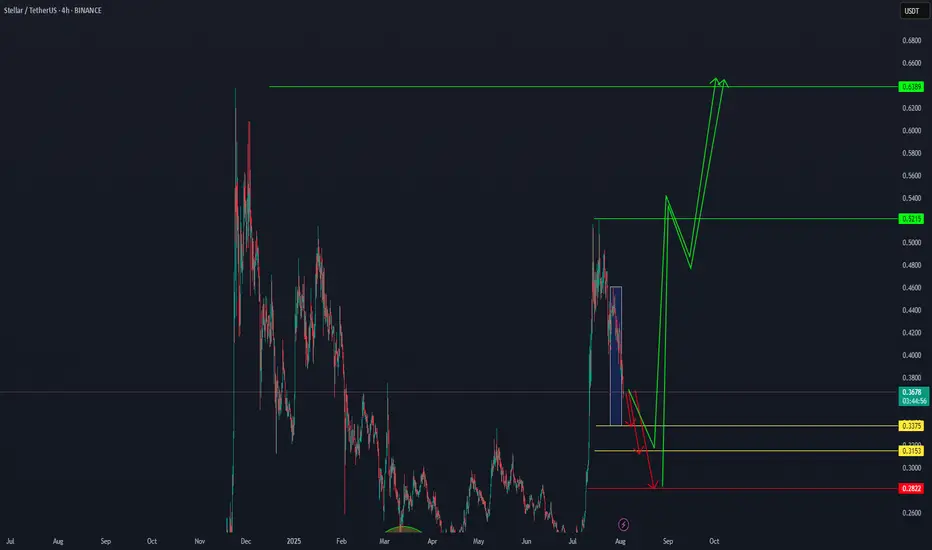
"Stellar XLM will definitely reach 0.6389."" Stellar (XLM) is expected to begin its upward move from the price zones of 0.3375, 0.3153, and 0.2822, heading toward the confirmed targets of 0.5215 and then 0.6389.
While the exact starting point may vary slightly, the targets at 0.5215 and 0.6389 are considered certain." BINANCE:XRPUSDT
Juicy 12hr Setup on $XLMUSDT
Decided to take this as a short-term play, level by level.
Already holding an initial position (see my previous CRYPTOCAP:XLM post), but this current setup was too clean to pass up.
Still believe CRYPTOCAP:XLM is one of those coins primed to finally break out of its multiyear consolidation—and I’m expecting that breakout to happen this year.
First TP at 62c, and letting the rest ride if momentum kicks in. BINANCE:XLMUSDT

XLMUSDT – Accumulation Phase or the Start of a Major Breakout?🔍 Market Overview:
Stellar (XLM) against USDT is showing a technically significant structure. After breaking above a long-standing consolidation zone, price is now in a mild corrective phase, retesting previous resistance as new support. This setup suggests a critical decision point — will XLM confirm a bullish continuation, or was it a false breakout before further decline?
---
📌 Key Price Levels:
✅ Strong Demand Zone (Historical Support + Fibonacci Confluence)
XLM recently surged from the zone between $0.32972–$0.36213, which coincides with:
Fibonacci retracement levels: 0.5 (0.36213) & 0.618 (0.32972) from the recent swing low
A multi-tested support/resistance zone, now acting as a major demand area
This zone is currently the most critical support region for bulls to defend.
❌ Layered Resistance Zones (Bullish Targets Ahead)
If upward momentum resumes, watch these key resistance levels:
0.45207 → Nearest resistance
0.50470 → Structural resistance
0.56108 → Mid-range psychological barrier
0.60000 → Historical resistance zone
0.63440 → Medium-term technical target
0.63724 → Local swing high
---
📈 Bullish Scenario:
> "As long as price holds above the demand zone without printing lower lows, the bullish bias remains valid."
1. Bullish continuation confirmed with a daily close above $0.45207, ideally supported by strong volume.
2. A bullish continuation pattern (e.g., flag or pennant) may be forming.
3. Short-term targets extend to $0.50470–$0.56108, with a mid-term outlook toward $0.63+.
4. Macro sentiment or altcoin market momentum could act as a breakout catalyst.
---
📉 Bearish Scenario:
> "A breakdown below the demand zone could trigger a bearish trend reversal."
1. Failure to hold $0.42 could trigger a deeper pullback to $0.36–$0.33 zone.
2. A confirmed breakdown below $0.32972 (Fibo 0.618) invalidates bullish structure, possibly starting a new downtrend (Lower Lows).
3. Watch for potential bearish divergence if price gets rejected around $0.45–$0.50 area.
---
📐 Chart Pattern & Market Structure:
Currently showing a developing Higher High & Higher Low (HH-HL) structure — a sign of early trend reversal.
Price may be forming a Bullish Rectangle or Ascending Triangle, depending on future break direction.
This pullback appears to be a healthy retest, not a trend reversal (yet).
---
🧠 Strategy & Trader Insights:
Swing traders may look to enter near $0.36–$0.38, with tight stops below $0.32.
Breakout traders should wait for a clear breakout and close above $0.45207 before entering.
Avoid chasing trades in the middle of the range — wait for confirmation or rejection at key levels.
---
💬 Final Thoughts:
This is a high-potential setup for XLM, provided the current support structure holds. The demand zone is acting as a critical foundation for any bullish continuation. However, risk management is essential as the market approaches a key decision point.
#XLMUSDT #Stellar #CryptoAnalysis #AltcoinSeason #PriceAction #SupportResistance #TechnicalAnalysis #FibonacciLevels #BreakoutSetup

XLM target hit - But is there more downside?7/23- My first post - Xlm was $.42
7/24-Xlm hit T2 @ $.4
7/27-Pumped 15% - as anticipated (indicated on this chart on 7/23)
After 2 fakeouts I would expect XLM to bounce from the GP.
If not, the bottom of T2 may be hit, then bounce.

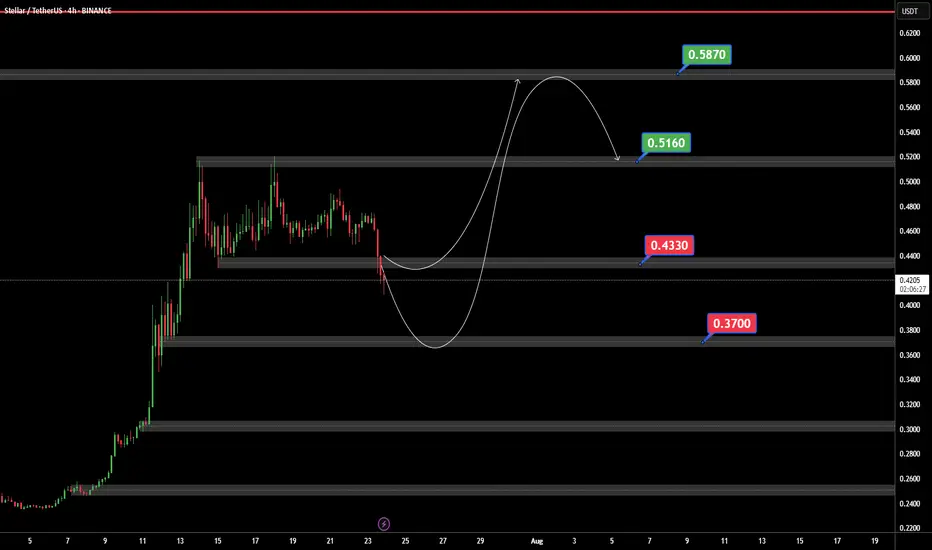
XLMUSDTIf BINANCE:XLMUSDT can support 0.4430 $ ready for jump to 0.5160 and best target in 0.5873 $.
But if XLM can price breaked 0.4330$ support we ready for a bear trend.
XLM/USD XLM is showing one of the strongest bullish setups right now.
A macro “Cup”, with a smaller “Cup with Handle” forming inside it — a powerful setup often leading to parabolic breakouts.
Before a true breakout, price may fake out to the downside, trapping longs.
This is classic market maker behavior — shakeouts followed by strong reversal and breakout. Stay focused on the reaction around yellow zone.
Currently in the final stages of the “handle” formation.
A breakout may confirm a move toward $4

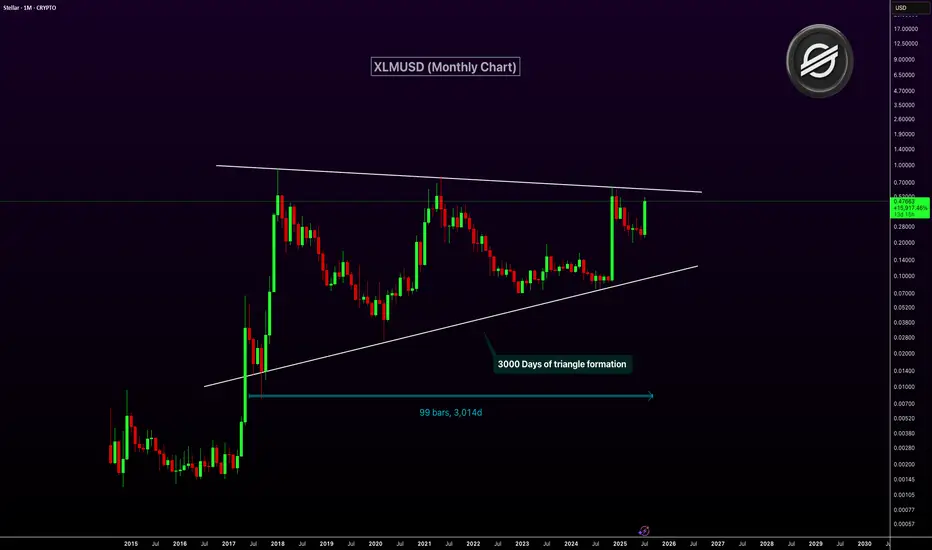
XLMUSD Nearing Breakout After 3,000-Day Triangle FormationXLM has been consolidating inside a massive symmetrical triangle for over 3,000 days. This long-term pattern on the monthly chart dates back to 2017. The price is now approaching the upper resistance trendline of the triangle. A breakout from this structure could ignite a major bullish rally.
The current monthly candle shows strong momentum with over 100% gains. A confirmed breakout above resistance could mark the start of a macro uptrend. This triangle is one of the most significant technical setups in XLM’s history.
Target 1: $1.00
Target 2: $2.50
Target 3: $5.00
XLM is the pump over or just getting started !XLM / USDT
What a huge weekly candle! We catched its strong move very early around 0.29$ a week ago (75% profits locked in spot)
With a zoom out chart we can see price is setting up nicely with several tests of pattern boundary. Next test of the upper boundary can lead to huge breakout of this mega pattern !
NOTE: Price must not close below april low and should close above upper boundary unless that its just a range
Keep an eye on it closely !
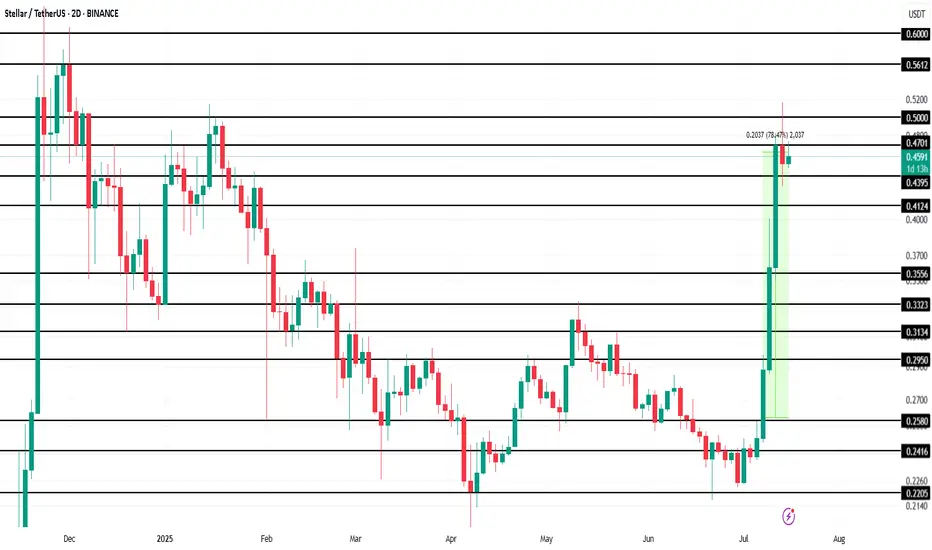
Stellar (XLM) Makes History Amid 78% Price Surge This WeekBINANCE:XLMUSDT is currently trading at $0.46, up 78.5% over the past week . However, the altcoin faces resistance at $0.47, a level it has struggled to breach in recent days. The ability to break this resistance is crucial for continued growth, as it will determine whether XLM can push higher.
BINANCE:XLMUSDT futures market activity has also surged, with Futures Open Interest hitting an all-time high of $520 million in the last 24 hours. This indicates that traders are increasingly interested in the asset's derivatives, which are capitalizing on its rise.
Given the strong sentiment from futures traders and the technical indicators, it is likely that BINANCE:XLMUSDT will push past the $0.47 resistance and target $0.50 in the coming days . A successful breakthrough could lead XLM toward its next target at $0.56, marking an eight-month high. This would signify continued strength for the asset.
However, if the broader market sentiment shifts or investors begin to sell their holdings, BINANCE:XLMUSDT could face a significant pullback. If the price falls below the key support levels of $0.43 and $0.41 , it could slide further to $0.35, which would invalidate the current bullish outlook.
Stellar XLM price analysisToday, the price of CRYPTOCAP:XLM rose quite dramatically, doing so at a critically important moment, but trading volumes are slightly insufficient for final confirmation.
Now let's look at what we wrote for the OKX:XLMUSDT chart four months ago: “It would be ‘right’ to test $0.19-0.20 before the start of strong growth.”
👆
The minimum was $0.19976 — do we "check" and "done" that?
📈 If so, then the price of #XLM should not fall below $0.226 anymore.
And ahead lies only growth in the price of the #Stellar token to at least $0.50, or even $0.60.
🏆 Well, and about the global goal for #XLMUSD we wrote in the previous idea — read, analyze, and turn information into profit!
_____________________
Did you like our analysis? Leave a comment, like, and follow to get more

Stellar (XLM) Rejected Hard—Brace for $0.25 Next?On the daily chart of XLM/USDT, price has made a steep, parabolic rise, pushing directly into a well-established resistance zone around $0.5155. This level has historically capped price moves, evident from several prior swing highs clustering near this area. The rally itself unfolded rapidly, without significant consolidation, leaving a series of untested supports in its wake.
This combination—a near-vertical climb into resistance—often signals buyer exhaustion. Indeed, the rejection candle formed right at the $0.5155 ceiling, which strengthens the bearish argument.
Below the current price action, there is a broad support zone between $0.3347 and $0.3504. This area previously acted as resistance earlier in the year and is likely to attract some buying interest if price pulls back decisively. Beneath it lie deeper supports around $0.2500, $0.2268, and $0.2000—levels that remain untested during this move up.
While the chart does not display volume bars, the sheer steepness of the final leg suggests momentum was likely unsustainable. Often, such aggressive spikes without healthy consolidation result in a retracement of 30–50% or more.
One critical factor to watch is whether price manages to reclaim and hold above $0.5155. Failure to do so implies that sellers remain in control, raising the probability of a broader pullback toward the mid-$0.30s or lower.
________________________________________
📉 Why This Setup Leans Bearish
This chart structure supports a bearish thesis because:
• Price is reacting strongly to historical resistance.
• The rally was parabolic, making it prone to sharp corrections.
• There is no clear consolidation base above the breakout point.
• Several untested support levels remain below current price, which the market may revisit.
If this move is indeed an exhaustion spike, the next phase is typically a retest of the last major consolidation area around $0.3504–$0.3347.
________________________________________
📊 Potential Bearish Trading Setup
Here is a structured trading idea to consider:
Short Entry Zone:
• Retest of the $0.5155–$0.5200 resistance area.
• Look for confirmation by way of bearish candlestick patterns (shooting star, bearish engulfing, or consecutive rejection wicks).
Stop Loss:
• Conservative stop above $0.6374 to allow for volatility.
• Alternatively, a tighter stop just above $0.5200 if using smaller size.
Targets:
• First target: $0.3504 (major support).
• Second target: $0.2500.
• Third target: $0.2000–$0.2268 (deeper retracement zone).

XLM/USDT;FREE SIGNALHello friends🙌
Given the good price growth, you can see that the price has entered a channel, which has caused the price to form a flag...
Now, with a strong channel breakdown by buyers and their entry, you can enter the trade with risk and capital management and move with it to the specified targets.
🔥Join us for more signals🔥
*Trade safely with us*
