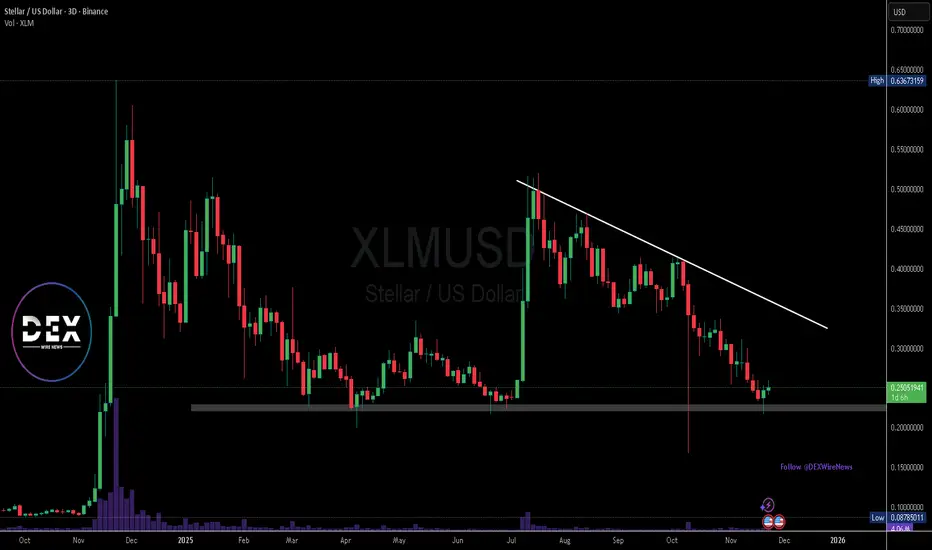
XLM About to Wake Up? Bullish Targets Ahead!Stellar (XLM) is starting to look very interesting again after a clean consolidation phase. The chart is showing signs of strength and I expect a bullish continuation in the coming days.
🎯My upside targets:
1. $0.255
2. $0.265
3. $0.275 (main target)
❌Invalidation level:
A close below $0.241 would cancel this bullish scenario.
⚠️ Disclaimer: This is not financial advice. This is purely my personal view and technical analysis. Always do your own research and manage your risk and never trade without stoplosses . Trading involves substantial risk of loss.
If you like the idea — hit the LIKE button 🚀
Follow me for more crypto ideas!
Drop in the comments which coin I should analyse next! 👇
Xlmusdlong

Stellar ( $XLM) Eyes Rebound as Protocol 25 Unlocks ZK PowerStellar (XLM) sits near $0.248 after a sharp monthly pullback that pushed the token back into a major demand zone between $0.22–$0.20. This region has triggered three powerful rallies in the past—32%, 53%, and 138%—making it a critical psychological and technical level. With X-Ray now entering the spotlight under Protocol 25, traders are watching closely to see whether renewed fundamentals can fuel another upside reaction.
Protocol 25: X-Ray Brings Zero-Knowledge to Stellar
Protocol 25 is one of Stellar’s most significant upgrades. It introduces X-Ray, a cryptographic toolkit designed to bring configurable privacy through zero-knowledge proofs while maintaining Stellar’s transparency model. Developers can now build privacy-enhanced applications without breaking compliance or altering the chain’s trust assumptions.
The upgrade introduces two key foundations:
BN254 Curve Support
Before Protocol 25, developers faced friction building ZK applications on Stellar. With bn254 precompiles—g1_add, g1_mul, and multi_pairing_check—Stellar now aligns with Ethereum-level ZK tooling and eliminates costly workarounds.
Poseidon & Poseidon2 Hashing
These ZK-optimized hashes enable faster proof generation, smoother off-chain integration, and better circuit performance. Anyone building Merkle trees, commitments, or complex ZK circuits now gains efficient primitives.
Stellar’s timeline is clear:
• Testnet vote: Jan 7, 2026
• Mainnet vote: Jan 22, 2026
Technical Outlook: XLM Must Defend $0.22
XLM broke a long-term descending trendline earlier this year before rejecting at $0.3 and sliding back into the $0.22 zone. This level is a historical launchpad:
Hold $0.22 → Move toward $0.31
Lose $0.22 → Drop toward $0.168
History says this region can ignite explosive reversals—if bulls defend it once again.
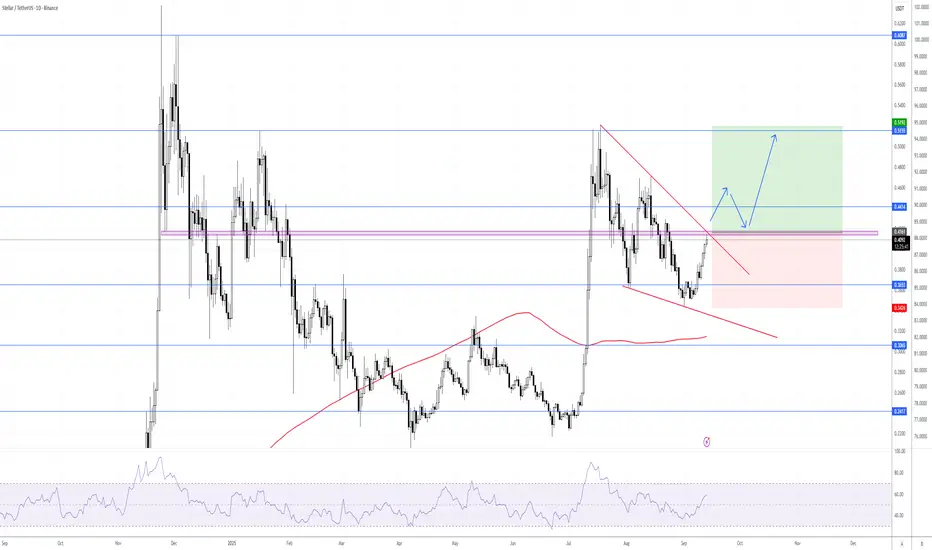
Stellar's(XLM) trajectoryConsidering the price hitting the supply zone (green area) and consuming the orders in that zone along with the reaction it has shown, now if the market also consumes the supply zone (orange area) and breaks through it, we expect the continuation of the upward movement to the next levels. BINANCE:XLMUSDT

$XLM Fractal $8.00Looking at fractal from the 2017 Era we can see there is a chance the parabolic movement at the end of the pattern will occur again. 1×10^-27

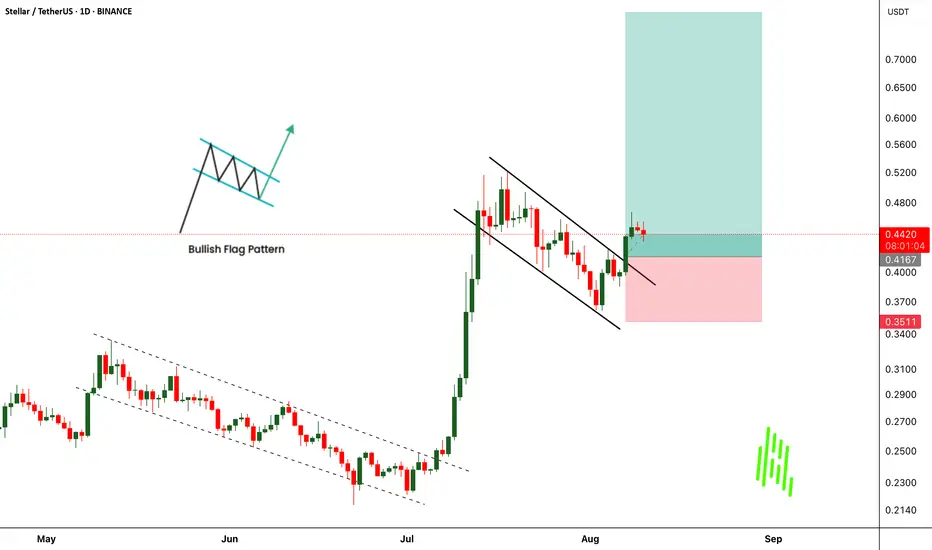
Stellar Bullish FlagXLM/USDT formed a bullish falling wedge and is now approaching resistance. Breakout confirmation above 0.4161 opens the path to 0.5155, with potential extension to 0.6087. Wait for the breakout and the retest. Stop loss below 0.3425.
Xlm - Take profit targetI'm anticipating my take profit to be hit this weekend. I bought the bottom last Sunday, and I'm up 14%, so if my target hits, I'm up 20%. Xlm may continue up beyond my take profit target, but I don't want to be greedy. May the trends be with you.

XLM: Hidden Accumulation Before a Violent Breakout?Yello, Paradisers do you see what’s happening on Stellar right now? While most eyes are turned away, XLM has been quietly carving a base inside a major demand zone, and the setup looks like it could fuel a massive move soon.
💎After weeks of pressure inside a descending channel, #XLMUSDT finally broke out, confirming that sellers are losing strength. For the last several days, XLM has been consolidating right above demand at $0.34–$0.35, holding firm despite repeated retests. This zone remains the line in the sand: as long as it’s defended, buyers keep the upper hand.
💎The breakout area around $0.37 is crucial now. A sustained close above it can trigger momentum toward the $0.42 minor resistance, and eventually even $0.48 where strong supply waits. On the flip side, failure to hold the demand zone could open the door for a deeper flush down into the invalidation area near $0.28, a level that would completely shift the outlook back to bearish.
💎Momentum indicators are already hinting at early accumulation, with signs of buyers stepping in at each retest of support. If this continues, #XLM could deliver a sharp vertical move that catches most of the market unprepared.
🎖Strive for consistency, not quick profits. Treat the market as a businessman, not as a gambler.
MyCryptoParadise
iFeel the success🌴

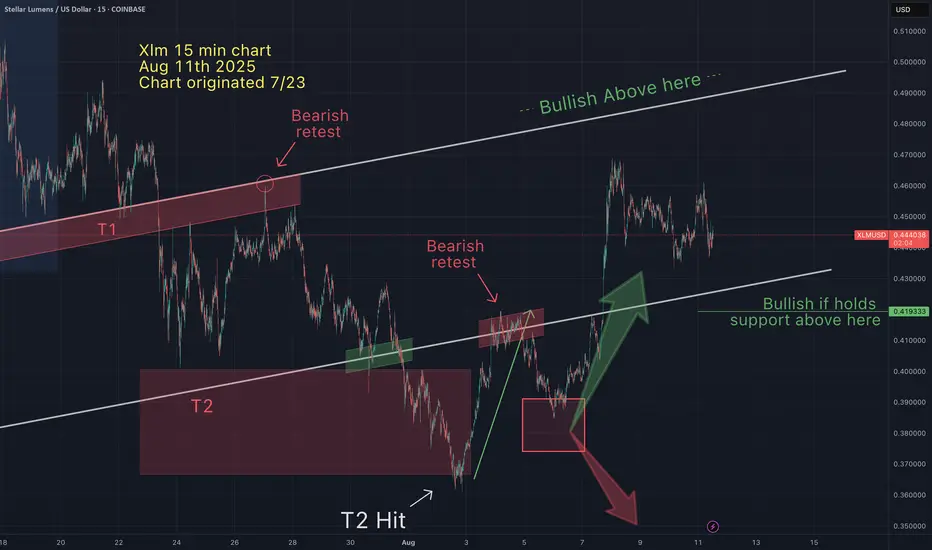
How did I know that Xlm would retrace...then bounce off $0.38?On Aug 5th I suggested that Xlm was apporaching an "inflection point", indicated by my green and red arrows converging at $0.38. See chart below from Aug 5th.
In mathematics an "inflection point" is a point in the curve at which a change in the direction of curvature occurs. These price charts are merely graphs, with coordinates and reoccuring patterns. Anticipating inflection points allow me to determine directionality. Knowing where direction may change allows me to either make quick profitable decisions and/or where to set appropriate stops (invalidation).
TA works!
XLMUADT Ready for Another Moonshot After Bullish Flag Breakout!$XLMUADT has just broken out of a well-formed bullish flag pattern, signaling the potential start of a strong upward move. This comes after its earlier breakout from a rising channel, which delivered impressive gains to traders who caught the move. The current breakout setup mirrors that previous rally, and if history repeats, we could be looking at another powerful uptrend in the making.
With momentum building and technicals aligning, buyers seem to be taking control again. However, as always, risk management is key, keep a strict stop loss in place to protect capital and lock in profits as the move unfolds. The market has already shown us what CRYPTOCAP:XLM can do, and this breakout might just be the next big opportunity.
$XLMUADT Currently trading at $0.44
Buy level : Above $0.415
Stop loss : Below $0.35
Target 1: $0.522
Target 2: $0.6
Target 3: $0.8
Max leverage 5x
Always keep stop loss
Follow Our Tradingview Account for More Technical Analysis Updates, | Like, Share and Comment Your thoughts
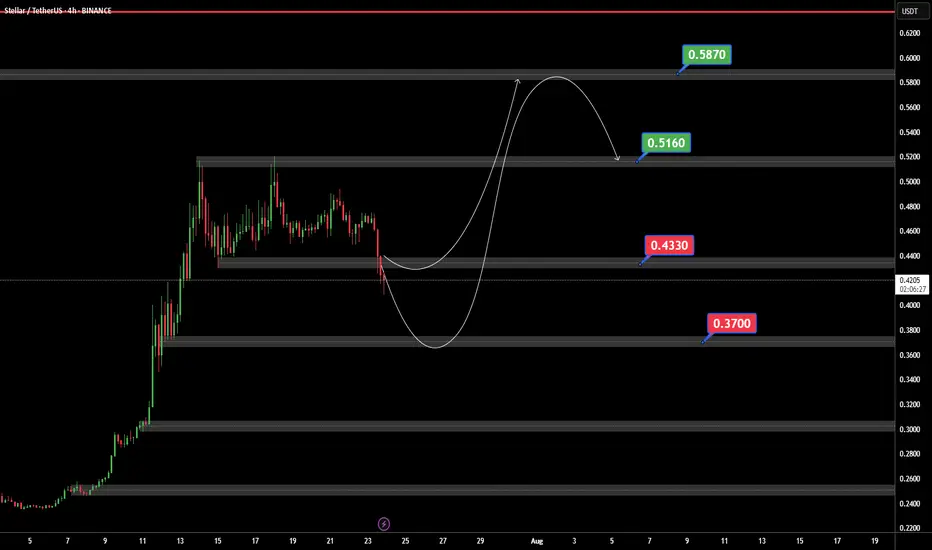
XLMUSDTIf BINANCE:XLMUSDT can support 0.4430 $ ready for jump to 0.5160 and best target in 0.5873 $.
But if XLM can price breaked 0.4330$ support we ready for a bear trend.
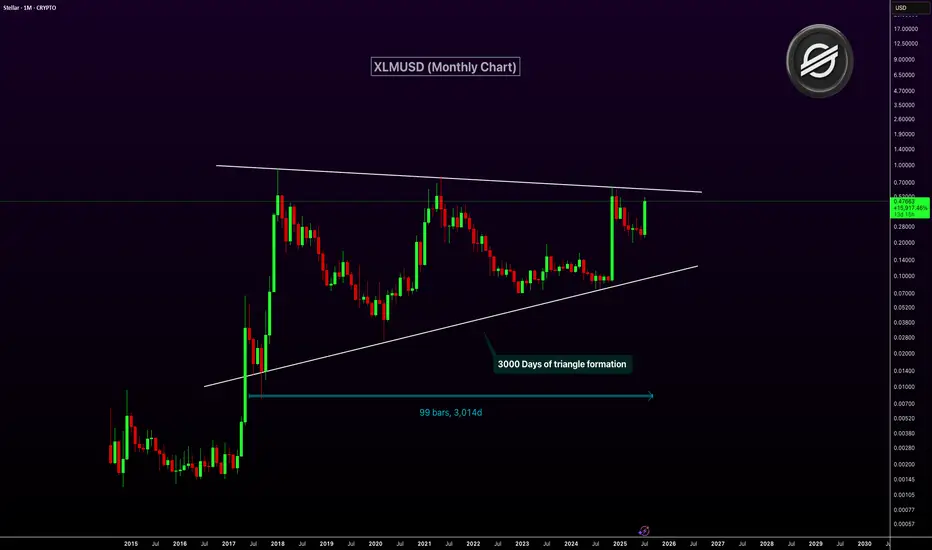
XLMUSD Nearing Breakout After 3,000-Day Triangle FormationXLM has been consolidating inside a massive symmetrical triangle for over 3,000 days. This long-term pattern on the monthly chart dates back to 2017. The price is now approaching the upper resistance trendline of the triangle. A breakout from this structure could ignite a major bullish rally.
The current monthly candle shows strong momentum with over 100% gains. A confirmed breakout above resistance could mark the start of a macro uptrend. This triangle is one of the most significant technical setups in XLM’s history.
Target 1: $1.00
Target 2: $2.50
Target 3: $5.00
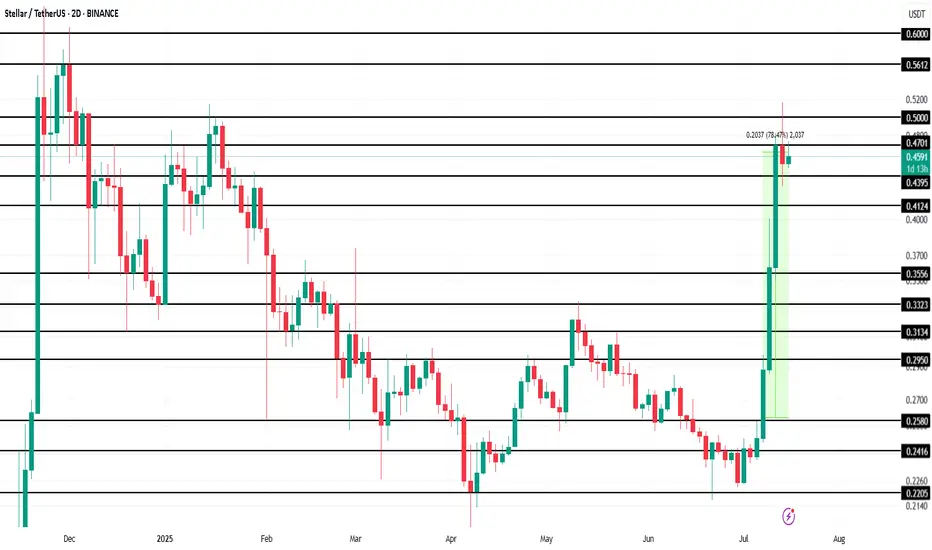
Stellar (XLM) Makes History Amid 78% Price Surge This WeekBINANCE:XLMUSDT is currently trading at $0.46, up 78.5% over the past week . However, the altcoin faces resistance at $0.47, a level it has struggled to breach in recent days. The ability to break this resistance is crucial for continued growth, as it will determine whether XLM can push higher.
BINANCE:XLMUSDT futures market activity has also surged, with Futures Open Interest hitting an all-time high of $520 million in the last 24 hours. This indicates that traders are increasingly interested in the asset's derivatives, which are capitalizing on its rise.
Given the strong sentiment from futures traders and the technical indicators, it is likely that BINANCE:XLMUSDT will push past the $0.47 resistance and target $0.50 in the coming days . A successful breakthrough could lead XLM toward its next target at $0.56, marking an eight-month high. This would signify continued strength for the asset.
However, if the broader market sentiment shifts or investors begin to sell their holdings, BINANCE:XLMUSDT could face a significant pullback. If the price falls below the key support levels of $0.43 and $0.41 , it could slide further to $0.35, which would invalidate the current bullish outlook.
XLMUSDT 1D AnalysisXLM ~ 1D Analysis
#XLM Buy gradually from here if you still have confidence in this coin with a short term target of at least 10%+ from here.

XLMUSDT 1D AnalysisXLM ~ 1D Analysis
#XLM Buy on retesting this support block or buy after successfully breaking the resistance line on this pattern with a short term target of at least 10%+.

XLMUSDT 1D AnalysisXLM ~ 1D Analysis
#XLM Buy after successfully penetrating this resistant line with a short -term target of at least 10%+ from here.

XLM Is About to Trap Thousands of Traders ?Yello Paradisers are you prepared for the next major move on XLM, or are you walking straight into the bull trap? We’re now approaching a critical decision point on XLMUSD that could shake out a lot of traders who are only reacting instead of planning. Here's exactly how we're playing it, step by step.
💎#XLMUSDT is currently trading inside a descending channel. As of now, we see a high-probability scenario where the price gets rejected from the descending resistance, setting up an ideal short opportunity with the current structure still favoring sellers. Should this rejection play out, we expect a breakdown of the moderate support level, with our target set at the $0.1970 zone.
💎Adding more weight to this bearish outlook is the fact that XLM is trading below both the 50 EMA and 200 EMA. This technical alignment confirms broader weakness in the trend and reinforces that any breakout attempts at this stage are likely to be reactive rather than sustainable simply small retracements within a dominant bearish macro setup.
💎However, if price fails to respect the descending resistance and pushes higher, our next major decision area is the supply zone at $0.2537. At that point, as always, we’ll wait with full discipline for confirmation. We’ll be watching closely for clear bearish reversal patterns, such as an Evening Star or a Shooting Star, before taking action. Only a strong and confirmed breakout above the $0.2537 level would invalidate our bearish outlook and shift the market structure into bullish territory.
Stay focused, Paradisers. Be the hunter, not the hunted.
MyCryptoParadise
iFeel the success🌴

XLM short termHello
this time I am posting a short term idea (few days to few weeks).
After explosion in Q4 of 2024 XLM has formed a downtrending channel which can potentially turn into a bull flag.
Currently XLM price is sitting at a bottom of this channel.
Short term traders can look to purchase some XLM now and wait till it comes towards the top of the channel to sell and get some profit. If it reaches top of the channel potential is 50% price increase.
If the market turns bullish in next few days to weeks XLM might even break upwards out of this bull flag but do not count on it just yet.
This idea is somewhat risky so proceed with extreme caution and with tight stop-loss below the channel.
Good luck.

XLM/USDT(BUY)hello friends
According to the formation of a QM model, it is possible to enter into a transaction with risk and capital management.
*Trade safely with us*

XLMUSDT Weekly LONG This is a weekly technical analysis for educational purposes on XLMUSDT. I believe that Stellar will find new higher high levels in the middle of the 2025 Bull Season.
As I mentioned before on my ALGOUSDT Weekly Analysis ;
"Considering the global economic crisis, the technical recession in the United States, the suppression of gold and other commodities, the real estate and unemployment crisis in China, and the European Union countries' struggle with inflation, I believe that market makers (the bulls) may create a false FOMO (Fear of Missing Out) during the 2024 BTC halving period, potentially driving BTC to levels of perhaps 50K+ before ending the year 2024 around the 20-25K range. When we consider the global effects, the real bull season is likely to occur between 2025 and 2026.
Reaching 100K in Bitcoin by 2024 wouldn't make much sense if most people don't have the financial means. It's important to remember that patient wealthy individuals often capitalize on the impatience of those with fewer resources. (let's say poors with high dreams) Those with limited means may not have the capital to participate in the market for couple of years.
This is not "clever riches profit from the idiot riches game". Never was. I believe.
I may be wrong, :)
Regards,

XLMUSD - Weekly forecast, Technical Analysis & Trading IdeasMidterm forecast:
0.1625 is a major support, while this level is not broken, the Midterm wave will be uptrend.
Technical analysis:
A trough is formed in daily chart at 0.3030 on 02/09/2025, so more gains to resistance(s) 0.3552, 0.3875, 0.4521 and more heights is expected.
Take Profits:
0.3552
0.3875
0.4521
0.4965
0.5602
0.6080
0.6905
0.7975
__________________________________________
❤️ If you find this helpful and want more FREE forecasts in TradingView,
. . . . . Please show your support back,
. . . . . . . . Hit the 👍 BOOST button,
. . . . . . . . . . . Drop some feedback below in the comment!
🙏 Your Support is appreciated!
Let us know how you see this opportunity and forecast.
Have a successful week,
ForecastCity Support Team

#XLM/USDT Ready to go higher#XLM
The price is moving in a descending channel on the 1-hour frame and sticking to it well
We have a bounce from the lower limit of the descending channel, this support is at 0.4300
We have a downtrend on the RSI indicator that is about to be broken, which supports the rise
We have a trend to stabilize above the moving average 100
Entry price 0.4434
First target 0.4590
Second target 0.4746
Third target 0.4927

xlm long!"🌟 Welcome to Golden Candle! 🌟
We're a team of 📈 passionate traders 📉 who love sharing our 🔍 technical analysis insights 🔎 with the TradingView community. 🌎
Our goal is to provide 💡 valuable perspectives 💡 on market trends and patterns, but 🚫 please note that our analyses are not intended as buy or sell recommendations. 🚫
Instead, they reflect our own 💭 personal attitudes and thoughts. 💭
Follow along and 📚 learn 📚 from our analyses! 📊💡"

XLM and the potential 560 Risk to reward Opportunity Hi Everyone;
today we have one of the best risk to reward Investment opportunity
it is more than 560 times the risk and the chart is look very promising.
I expect breaking the previous bear market key point will clear the way to the final target
