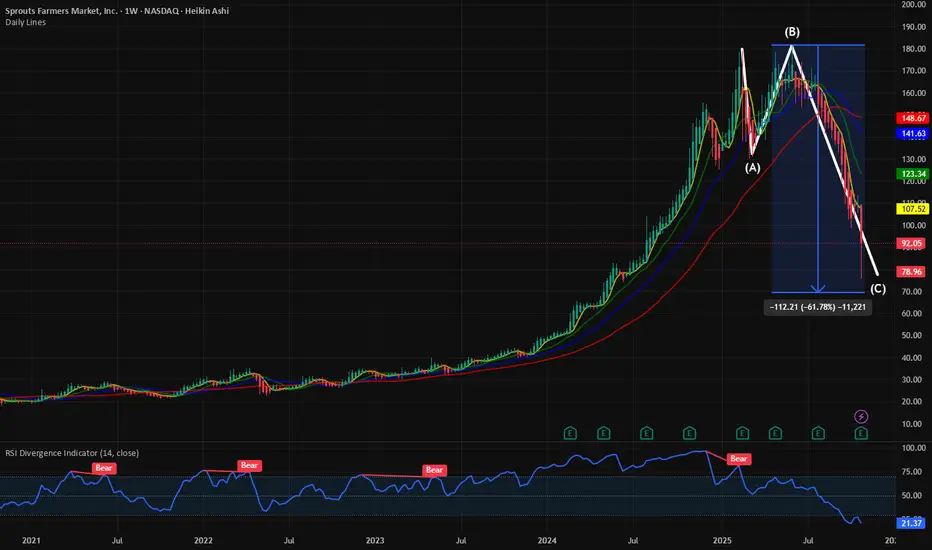
$SFM: Approaching last phase of Eliot Correction patternI have seldom written about one of my favorite stocks within the retails sector. NASDAQ:SFM has been a great momentum stock but on Aug 12th I highlighted that the stock is loosing momentum.
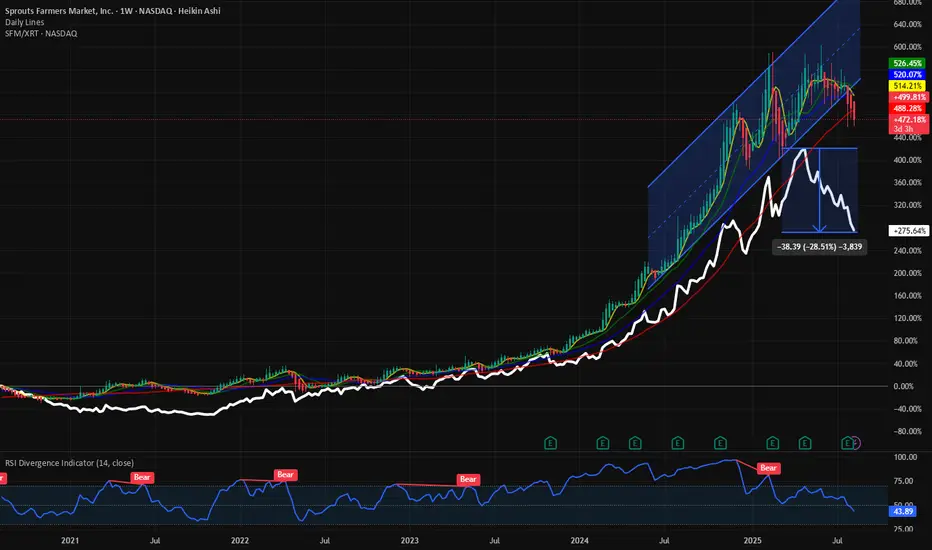
NASDAQ:SFM vs XRT: SFM losses momentum. Underperforming XRT. for NASDAQ:SFM by RabishankarBiswal — TradingView
Since my last blog when the RSI was above 40, the stock has lost 50% of the value. Crrently the RSI is @ 20 and forming a double bottom on the charts. With such heavy correction on such a momentum stock it makes sense to look at the Eliot correction wave. Usually the 3rd wave is the longest in such corrective patterns. With the stock hovering around 75 $ it has almost corrected 60 %. The 0.618 Fib retracement level from the 52 week high is at 70 $. NASDAQ:SFM has usually outperformed the AMEX:XRT and AMEX:SPY over the last 5 years and still holding its outperformance.
Trade set up : NASDAQ:SFM is in an accumulation pattern. Eliot correction pattern is nearing completion. Stock to bottom @ 70 $. Double bottom in RSI is bullish.
XRT
$SFM vs XRT: SFM losses momentum. Underperforming XRT. Within the SPDR Select Sector Retail ETF AMEX:XRT there are very few stocks which consistently outperform the ETF itself let alone the $SPX. We have time and again focused on the momentum name Sprout Farmers within the ETF. NASDAQ:SFM being a momentum stock tend to outperform the SP:SPX and AMEX:XRT on a long-term basis. But recent tariff related issues have created an air pocket for the stock. The stock is already below its 20, 50, 100 and 200-Day SMA. This has been typically countercyclical bullish indicator for the buyers of the stock. This is exactly what happened in 2021 and since then the stock already has provided a 700% return from the lows of 21 $.
But with recent poor price action the stock will have a death cross in a few weeks if this continues. The ratio of NASDAQ:SFM / AMEX:XRT is a bullish chart with higher highs and higher lows. Recently the ratio chart has fallen by 30%. So NASDAQ:SFM has underperformed the AMEX:XRT by 30%. The reasons can be multi-faceted from consumers pulling back to squeezed margins due to tariffs. But with RSI still above 40 we are still not in oversold territory. In my opinion the stock will have some more tough days, and we cannot rule out a minor pullback before we hit the historical low in RSI of 25 before we can hit the buy button.
Verdict: NASDAQ:SFM chart is bearish. Lost momentum. Price can go below 100 $ and RSI to 25 before the washout is complete.
Opening (IRA): XRT April 17th 70/Sept 19th 50 LCD*... for a 17.57 debit.
Comments: And back into XRT, which is at/near 52 week lows with a long call diagaonl/Poor Man's Covered Call, buying the back month 90 and selling the front month that pays for all the extrinsic in the long.
Metrics:
Buying Power Effect: 17.57
Break Even: 67.57
Max Profit: 2.43
ROC at Max: 13.83%
50% Max: 1.22
ROC at 50% Max: 6.92%
Will generally look to take profit on the setup as a unit at 50% max and/or roll out the short call when it is at 50% max.

Opening (IRA): XRT April 17th -71C/Sept 19th 50C LCD*... for a 17.91 debit.
Comments: At or near 52 week lows. Buying the back month 90 delta and selling the front month such that it pays for all the extrinsic in the long, with a resulting break even that is at or below where the underlying is currently trading. The Sept 19th 50C is shown at the 65 strike so that it appears on the chart.
Metrics:
Buying Power Effect: 17.91
Break Even: 67.91
Max Profit: 2.09
ROC at Max: 11.67%
50% Max: 1.05
ROC at 50% Max: 5.83%
Will generally look to take profit at 50% max, roll short call out and/or down and out at 50% max.
* -- Long call diagonal a/k/a a Poor Man's Covered Call.

Macys an american institution is in a fight for it's life....if it takes out that neckline.
"Macy's founded in 1858.
It is the largest department store company by retail sales in the United States as of 2015.
Macy's operates with over 700 stores in the United States. Its flagship store is located at Herald Square in the New York City borough of Manhattan.
The company had 130,000 employees and earned annual revenue of $24.8 billion as of 2017. ". - wikpedia
#M

Bullish Earning play oct 1Bullish earnings play for nike, as over 7000 $100 Oct 4 calls were bought on Sep 27 for .40 cents each
over 1500 volume in the Oct 4 $95 and 97 calls too
The implied move for ER is $6 / or 7-8%
There is a gap fill to $93 from the june earnings gap down.
For a hedge, you could buy the $80 put

Lululemon & Nike : Trade OpportunityLululemon is gapping down on earnings despite a double beat.
Nike is gapping down on earnings.
A trend is showing weakness in these consumer discretionary based stocks.
There will be many sympathy plays in the retail space.
Watch XRT tomorrow.

$XRT - 15M Bullish ContinuationBased off points given on the chart I am expecting a breakout to occur once it gets to the MA.
No targets as this is a long term hold.
However, I wanted to show my reasoning for why I believe the trend continues

XRT: Ringing the Register on Retail StocksSmall caps have surged to fresh highs dating back to the first quarter of 2022. The Russell 2000 ETF (IWM) has suddenly become a darling among sellside strategists and even buyside macro portfolio managers. Recall it was just two months ago when the group traded around 12 times next year’s earnings estimates. Jump ahead to today, and a 25% rally since October 27 leaves ‘the smalls’ closer to 15 times forward EPS forecasts. Is that a bargain? Maybe not quite as much.
Let’s focus on one key piece of the small-cap story. Retailers. Pull up a chart of the SPDR S&P Retail ETF (XRT), and you will see that the pattern since late 2020 appears remarkably similar to IWM's technical profile. The equal-weight basket of consumer equities peaked above $104 in Q4 2021 before plunging to support about 50% lower. Indeed, the mid- FWB:50S has proven to be support several times in the past 15 months. While XRT holds many large-cap names, its equal-weight construction methodology means it will act like a small or mid-cap ETF.
On the chart, I see clear resistance near the $75 mark. A breakout above that would portend a potential measured move price objective to the low to mid-$90s – just under its all-time high. For now, I am cautious on the fund since it has yet to break through the $75 line in the sand. I noticed, though, that in the fund's 18-year history, January has actually been a positive month, averaging a 2.2% total return with more tempered gains in February. March and April are the two best back-to-back months on the calendar.
Price comes first, however. So, I would like to see XRT jump above the $75 level. For now, ringing the register on retail stocks appears as the prudent play heading into 2024.

GameStop: Remains In A Position to Break Bullishly From Its ZoneGME has been getting sold off with the macro for quite some time and it continues to push deeper and deeper into dangerous territory. At this point in time, it has pushed slightly below the 0.382/0.886 Confluence Zone and is now at the 200 SMA, but with that, we can see that the Local Bullish Shark can extend into a 1.618 Extension, so the Breakout watch is far from over on GME though we are getting towards levels where one may leave it alone. I would say that if GME breaks below $11.50, there would be a very distinct chance of it dumping down to $9.5, but if it instead holds above $11.5 and pushes back above $14.00, then we could instead see GME make a rapid move up to $18.00, which would be just high enough to test the supply line of our Channel/Falling Wedge. From there we could possibly break out of it and go for the measured move, but for now, I'd say one would probably want to have a short-term position to take profits on at $18.00 and a separate longer-term position to hold strong until GME gets the big measured move breakout to $74 - $134

Nordstrom Head and Shoulder'sJWN has a trailing twelve month Price to Earnings (PE) ratio of 73.69 which places it above the histroical average of roughly 15.
Another expensive retail name
#JWN has alot of stores in #California
Obviously not a great place to be a retailer, given the rampant crime spree going on in that state!
well The chart action clearly foretells further woes ahead ..

If Love The Gap. You will love it under a $1Let's look at some household retail names
starting off with The GAP #GPS
It's ATH was over Twenty years ago
Is this Head and Shoulders signalling a Bankruptcy event during the next recession?

The future of RetailThe Monthly Consolidation on XRT is almost done and I suspect the next move down will be quite large. EMTY is an etf which is a 1x leverage against XRT. My view is EMTY can double from here.
Good luck!

MT technical Breakdown on watchIf retail earnings come in negative this stock could see further weakness.
A head & shoulders pattern has triggered which means we have to be aware of continued weakness to the downside.
A close above the neckline negates the pattern but being below key moving averages does not display signs of strength.

Home Depot earnings tomorrow!Home Depot reports earnings tomorrow. This could be telling for retail stocks.
If HD earnings come in negative this would drag XRT down and likely the market leading Home builders.
With the weakness in Lumber, Copper & steel weak earnings could be very likely.


QQQ New highs! What's next?The Nasdaq made a new 52 week high.
can we officially say we entered a new bull market?

XRT short - below .618 Fib levelRejecting down trendline, below 50 DMA and the option flow ratio for March 17th is 4:1 puts.
Very strong numbers from economy today, which means the FED will have to raise rates again at some point this year.
I have been following the FOMC for 6 years, take every meeting cautiously. We also have CPI numbers on the 14th.
I am holding MArch 24th 61 puts at $1.15
GL!

Academy Sports (ASO) I bought some of this near the IPO back around $15 a share. I cashed out around $28 a share. I wished I had held, it is now near $63 a share.
Small cap sports retailer out of Katy, TX with superb financials and growth plans. 0.47 PEG, ROE of 41.71%. Solidly increasing free cash flow and margins. Solid and steady accumulation.
$67.13 is 1.618 extension on monthly. $67.83 on weekly
2.142 extended on daily right now, so I am hoping for a pullback to the $57.74 on daily 23% extension, which is in the range of the thin vol profile on weekly down to volume expansion at $58.41
$51.66 mo. & weekly 23% fib retrace; thin vol profile on weekly down to $58.01
$51.51 prior swing high on weekly
$58.41 23% fib on daily; thin volume profile from $61.89 down to $58.41 fib
I don't chase, I always wait for a pullback to buy, so I am setting an entry target of $58.56 in hopes of a pullback to higher volume profile off that 2.142 extension.

#XRT - Retailers ETF consolidating for a breakout?Keep an eye on Retailers in the US. Fundamentally it doesn't feel right but technically its telling a different story. Nice consolidation off the 200 weekly ma since may Last year. Level is clear here. A convincing weekly break above $66.50 should see this move higher to at least a target of $77.50

$XRT - One more leg down...Not looking good... there could be another leg down for XRT which would drag stocks like GME to $16.4
An imminent market crash could support this move...


SHORT | XRTAMEX:XRT
Possible Scenario: SHORT
Evidence: Money-Flow, Price Action
PT: 58$
* I opened a short position by PUTS for 10/21/2022, strike 58$, 2.167$ each contract.
