SSE (Shanghai stocks index ) probably “bottomed”. 28/Oct/22SSE ( Shanghai Stocks Exchange ) index probably now as “leading indicators” for world’s economic not US anymore..As its index “crashed / bottomed” much “earlier than US markets like its individuals stocks e.g BABA, Tencent, Xiaomi, NIO etc..
Xyz3dtrading

Gold. watch out 1645 +/-. 27/Oct/22 Gold probably forming a running flat pattern in Wave b (green circled) where Price might hold @ around 1645 right before/after today US Advance GDP.

KLCI probably bull out / bear in. 25/Oct/22KLCI future Index aka FKLIi probably resuming its bearish trend anytime soon.


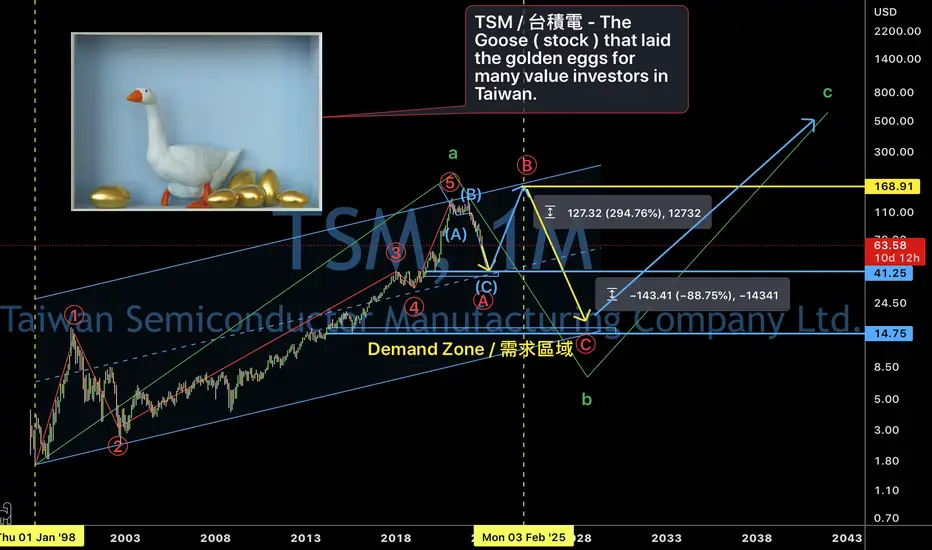
TSM ( Taiwan Semiconductor ) analysis. 21/Oct/22TSM ( Taiwan Semiconductor Manufacturing). The world largest semiconductor foundry. TSM .The Goose ( stock ) that laid the golden eggs for many value investors in Taiwan probably only found its base @ around 41.25
SMH ETF (Global Semiconductor’s trend”..20/Oct/22VanEck ETF which “tracking /invest” on 25 global major semiconductors stocks. Probably found its “base” @ around 148.90 - P/s. Probably the “next recession” might be caused by “geopolitical tensions” cause by 2 big brothers..A kinds of “wars e.g chips war, trade war, or “actual war”....” Probably an “Imposed /sanctioned by” a “freedom democracy/free trade” country toward “a so called not a democracy country”..

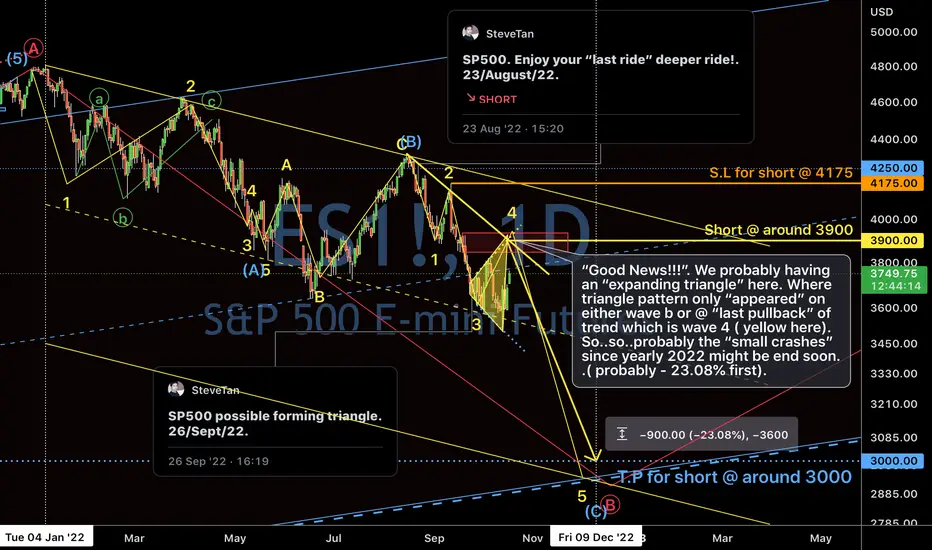
SP500’s GoodNews! probably forming expanding triangle.18/Oct/22.Not just ES1 having “Good News!!!”. We probably having an “expanding triangle” here. Where triangle pattern only “appeared” on either wave b or @ “last pullback” of trend which is wave 4 ( yellow here). So..so..probably the “small crashes” since yearly 2022 might be end soon..( probably - 23.08% first).
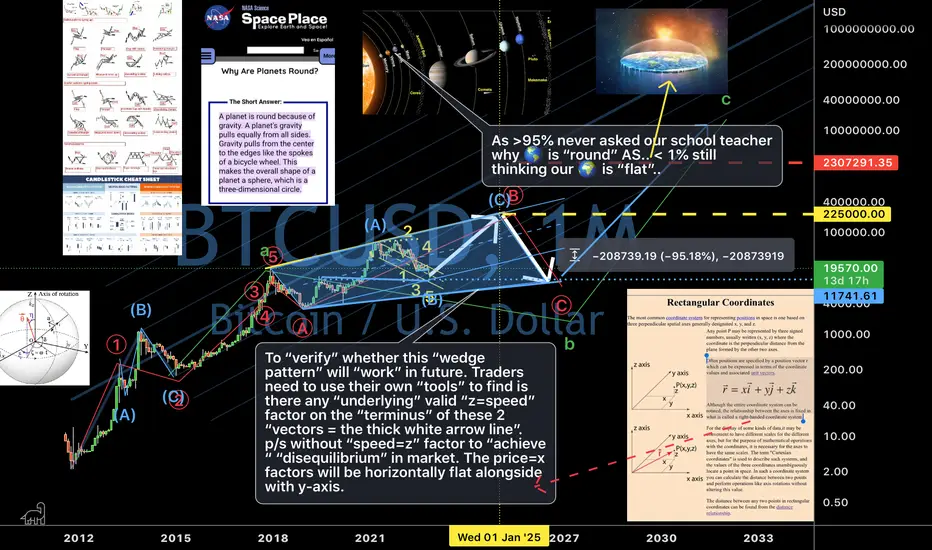
BITCOIN. Why chart pattern work?! (Not all) 18/Oct/22.Bitcoin. Why “chart pattern” works? Or we may asked why “pattern” exist.? As market are “mass participation” with “repeating “ of “fear/greed” emotions.. Anything “repeating in rhythm” there will be a “patterns”. .To “verify” whether any “pattern” will “work” in future in charts. Traders need to use their own “tools” to find is there any “underlying/energy/force”. A valid “z=speed” factor on the “terminus” of connected 2 “vectors”. E.g . The gravity force which made all planet “round shape” “pattern”.. P/s without “speeds=z” factor to “achieve “ “disequilibrium” in market. The price=x factors will be horizontally flat alongside with y-axis.
BJCORP possible forming cup’s bottom. 13/Oct/22.BJCORP with “new young talents/ directors / restructuring” after a “big rally” on 2021, possible forming a consolidated “base” which is a “cup/spoon” pattern for few years..

KLCI possible “bottom” @ around 1320 by end 2022. 13/Oct/22FMBKLCI’s “seem” like forming a triangle pattern in supercycle wave (b) (yellow). Price seem like contracting before “exploring” to upside “ONLY” after 2027..P/s.. it seem like most Index. E.g US, Asian point to year 2025, 2035..

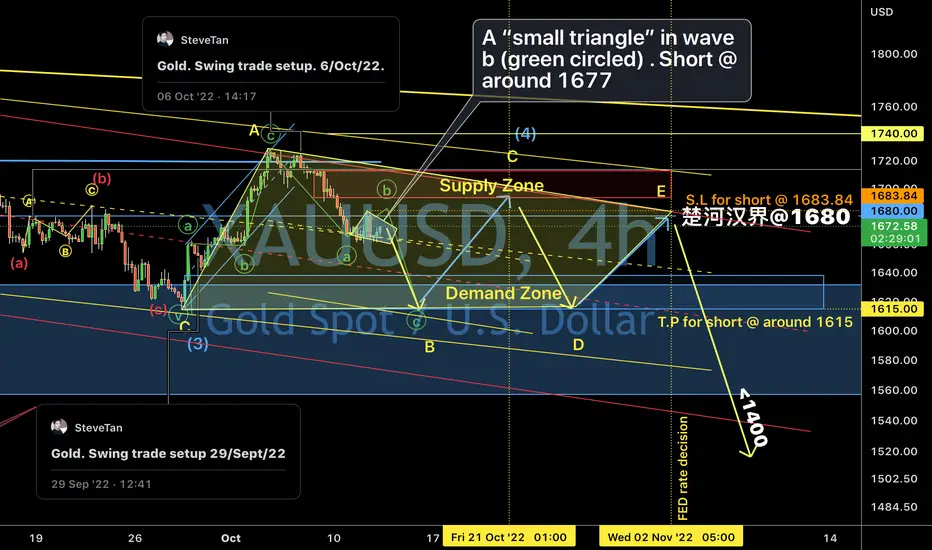
Gold. Probably “done” wave A (yellow) of triangle. 12/Oct/22Gold possible completed wave A ( yellow) of triangle in wave (4) (Cyan). Price now at subwave b ( green circled) of wave B ( yellow) of triangle where price could reach @ around 1615.
Tenaga. How “low” it could “go”? 11/Oct/22Tenaga. “Monopolized” electricity ..its price probably may only found its “base” at within RM7.250 ( Demand Zone + lower channel of pitchfork ) and RM 6.839 ( POC of volume Profile)..

SP500. The worst (>-70%) is yet to come by 2025. 11/Oct/22..SP500 probably will break ATH ( All Time high again ) by 2025 as we’re probably @ the sub wave B ( Red Circled) of the second leg of expanding flat pattern abc (green) which is wave b (green)..Based on the “pattern + cycle”..There is a “possibility” that SP500 will crash more than 70% toward around 2000 level. By end of 2024/ early 2025! So..”Prepare for the worst!”..

SPX elliottwave updated 9/Oct/22SPX probably still moving up to wave c ( cyan ) of triangle pattern in wave (iv)(Red)..

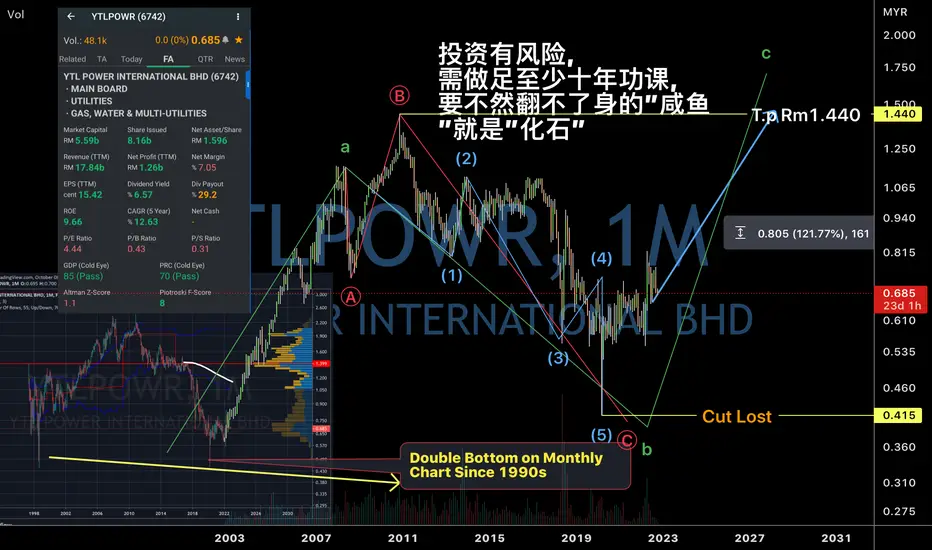
YTLPOWER. Slow and steady? 8/Oct/22YTLPOWER. A energy’s related stock which give Average dividend of 6% for past few years. Price possible found its long term “base” with monthly hammer candlestick / pin bar pattern on major support a double bottom pattern
Gold. Possible “stop hunting” on both sides. 7/Oct/22Gold possible forming an expanding flat pattern (a)(b)(c) (Red) in wave b (green circled). Where price could have “big swing “ after FOMC which might hit “stop lost” eventually for breakout traders at The “top” or “bottom” ..

Gold possible forming triangle. 7/Oct/22Gold possible forming a bullish triangle while waiting for breakout to the upside after FOMC. Price has kept above 1700..As POC has shifted to the “upside” It seem like institutional buyers are holding gold price above 1700.

Gold. Swing trade setup. 6/Oct/22.Gold may only resume its uptrend right before/after coming this Friday NFP @ around 1675.. tips. Gold “tend to” move around $100 on any “big swings” so from 1675 to 1775 is around $100 usd . 1775 not just the 1)anchored VWAP 2)long term down trend line BUT ALSO 3)200 daily moving average ( the openly written benchmark between bull/bear)..line which turned to very strong resistance.

Gold. How to intraday & swing trade. 5/Oct/22.Gold probably completed wave a ( green circled) now trending down to wave b (green circled)..before moving up to wave c (green circled) where it will complete wave A ( yellow) of a triangle ABCDE ( yellow) pattern.

Gold expecting choppy market ahead of next FOMC. 4/Oct/22Gold as US equities index, bitcoin etc might be a entering “a slaughterhouse “ where traders/investors will be “chopped piece by piece by riding roller coaster wheels “ on Oct while waiting for FOMC November’s “judgement” .

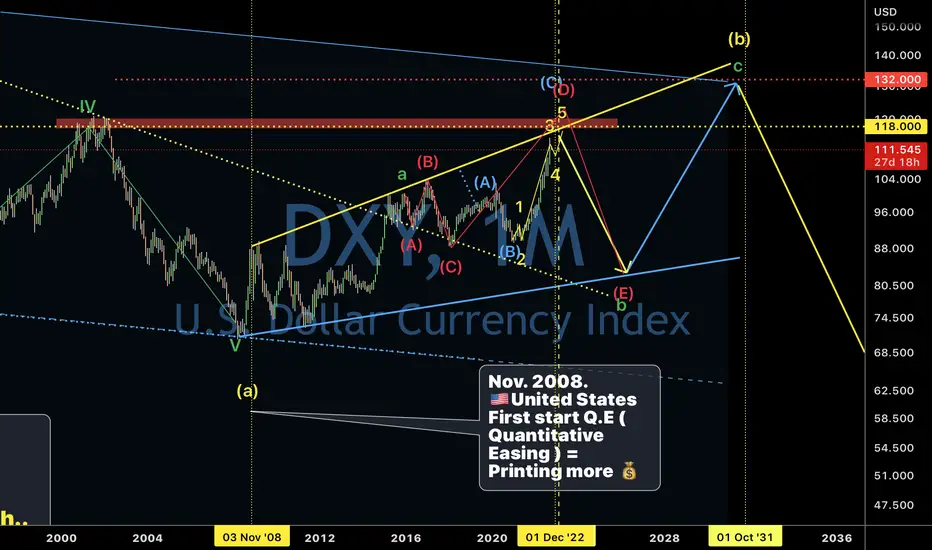
US dollar. How “high” it can go? 4/Oct/22Ray Dalio just said he “change” his..how about you..it’s a “tr..”?... The only King of the cash now/ The US dollar probably will “retain” its “crown” until 117-118 by end of 2022. p/s possible an expanding triangle (A)(B)(C)(D)(E) in wave b (green).
Glove’s Index volume info graphic comprised of 4kings. 3/Oct/22This chart shown the average price ( index) of 4 major gloves manufacturers in the world which are Topglove, Hartalega, Kossan and Supermx where they “contribute “ almost half of the world’s gloves market. As said trend is our friends but without “volume” in stock market there is no trend. The “shifting” polarity of bull trend to bear trend all cause by “panic” buying ( climax)/ selling Climax probably due to FOMO ( fear of missing out) in uptrend and “fear of losing” ..due “borrowed money” which cause “margin call” in downtrend..

Topglove. JP Morgan’s TP May “failed” this time. 1/Oct/22Topglove. JP Morgan’s Projection of RM0.45 probably “failed” this time. As other 3 major player already posing a bullish reversal setup based on Elliott wave and cycle. Just waiting for “confirmation” signal. Topglove price has just broken RM0.605 a “confirmation signal “ +++ Price of weekly Topglove, kossan and monthly Harta has formed a hammer candle/ pin bar bullish pattern possible market “price in” A.S.P ( Average Selling Price) increment lead by Topglove as “catalyst” of the beginning of long term bull trend after long term “correction “ since August/Oct 2020..
