United Postal Service | UPS | Long at $92.00The United Postal Service NYSE:UPS finally closed out the last remaining price gap on the daily chart (since 2020) and entered my "crash" simple moving average zone. With a P/E of 15x, earnings forecast growth of 8.12% per year, and a dividend over 6%, NYSE:UPS "may" be a good buy and hold through these tumultuous economic/trade war times. I wouldn't place a continued price drop near $75-$85 out of the question, but I'm not in the game of calling bottoms.
At $92.00, NYSE:UPS is in a personal buy zone. Word of caution: if this stock really tanks due to trade issues and massive recession, $50s...
Targets:
$108.00
$120.00
$133.00
Z-VALUE

B&G Foods | BGS | Long at $4.45B&G Foods NYSE:BGS , owner of over 50 food brands including Green Giant, Ortega, Cream of Wheat, Mrs. Dash, and Crisco, has dropped nearly 92% in price since its high in 2021. Currently trading at $4.43 and with a book value of $6.43, NYSE:BGS may have some running room in the next 1-2 years for a forward P/E of 10x (currently negative, so there is anticipated growth, though small). This is another company that would greatly benefit from lowered interest rates due to its high debt-to-equity (4x).
So, while debt and consumer spending declines may pose a threat to NYSE:BGS , I believe it is currently undervalued. If the stock drops due to poor earnings (which could drop to under $2.00), I will be entering another position unless fundamental / outlook truly change.
Thus, at $4.45, NYSE:BGS is in a personal buy zone.
Targets into 2027:
$5.25
$6.25

China Pays $50.5B in Dividends Liquidity Shock Before Lunar YearChinese listed companies have already paid out a historic amount of dividends of 50.5 billion in advance of the Lunar New Year. The dividend is 348.8 billion yuan, the highest amount in the history of the company. The surge is an drastic increase of more than 20 percent unlike in the past years. Timing also matters. This was capital that was emitted by companies on the eve of the largest spending season in China. Consequently, there has been a tremendous increase in liquidity both at household and market levels.
Push of Regulations is the Surge
The regulation was also a significant factor behind the scenes. The China Securities Regulatory Commission (CSRC) has been aggressively applying force to the listed companies to enhance returns to shareholders. In particular, the CSRC desires better capital discipline and equity markets of better quality. The consistency in dividend has become a major measure. Thus, this forced businesses to increase pre-holiday payouts.
Good Earnings Are in Favor of the Move
Notably, these dividends are not innocuous at all. They are indicative of sound corporate earnings, especially in the technology, manufacturing, and export based sectors. Most firms recorded stable cash flows despite the macro challenges that are still in operation. That stability enabled management teams to reward the shareholders with confidence. Thus, the dividends also portend the confidence in the recovery story of the Chinese economy.
Lunar New Year is traditionally a stimuli of increased consumer consumption and asset reallocation. The additional cash is likely to be invested in travel, consumption and investments. This year is strange in the scale though. Tens of billions of dollars into circulation simultaneously can have a significant impact on asset prices. Therefore, there can be temporary stabilizing or reviving inflows in A-share markets.
China Cryptocurrency Markets
To crypto investors, the dividend wave is more than it seems. Traditionally, surplus liquidity is prone to yield search. Capital is likely to be redirected to other investments when the traditional markets appear questionable. Such rotations are often advantageous to Bitcoin. Past cycles indicated that similar liquidity events were accompanied by more BTC trading volume and risk-on behaviour.
Although dividends are not known to cause the bull markets all by themselves, they tend to serve as catalysts in many cases. They improve sentiment. They relax the financial standards. And they decrease short-term downside strain. Together with the global expectations of easing, this development contributes another puzzle to the liquidity. To the point, money is flowing – and markets are listening.

Siemens EnergyThis was my highest from last year.
600%.
I believe it will go up to 200EUR.
Right now I don't see clear indication, but this is my felling.

DOW Inc | DOW | Long at $27.59NYSE:DOW Inc is a strong company with good fundamentals currently trading at a good value (it just may take time for the value to truly show).
P/E = 18x
Dividend Yield = 7.74%
Price/Cahs Flow = 6.9x
Debt/Equity = 0.94x
Price/Book = 1.14x
Insiders buying and awarded options
Thus, at $27.59, NYSE:DOW is in a personal buy zone.
Targets:
$34.00
$40.00
$44.00

Massive Head and Shoulders on OKLO - Are you prepared?Things are about to get ugly for OKLO as the companies largest shareholders dump on retail at every pump and the weekly candle is currently back testing the neckline of this massive head and shoulders as resistance.
Is this company nothing but hot air and about to go negative?

ZM - One of the best setupNASDAQ:ZM - one of the best setups in the market. It is breaking multiyear stage 1 base entering to Stage 2. Expecting 30% upside from current price with in next 3 months.

PARAMOUNT - EPS Beat 12 out of 17 Q's can we extract potential?Hi guys we are going to take a look into Paramount and see if we can extract some potential from this stock!
Fundamentals&Technicals below -
As of February 15, 2025, Paramount Global's Class B stock (ticker: PARA) is trading at $11.30 per share, reflecting a 4.5% increase from the previous close. This marks the fourth consecutive day of gains, though the stock remains 22.3% below its 52-week high of $14.54 achieved on May 3, 2024.
In the third quarter of 2024, Paramount reported net income of $1 million, a significant decline from $295 million in the same period the previous year. Earnings per share reached breakeven, missing analyst expectations of 24 cents. Total revenue decreased to $6.731 billion from $7.133 billion, influenced by a 6% drop in TV media revenue and a 34% decline in filmed entertainment revenue.Despite these challenges, the company's streaming segment showed resilience. Paramount+ added 3.5 million subscribers in the third quarter, bringing the total to 72 million. The streaming service reported an adjusted operating income of $49 million, defying analysts' predictions of a $160.1 million loss.
In 2024, Paramount undertook significant restructuring efforts, including a $6 billion write-down of its cable-TV business and the elimination of approximately 2,000 jobs, representing about 15% of its U.S. workforce. These measures aim to achieve $500 million in cost savings and address challenges in the traditional TV sector.
Looking ahead, Paramount is set to merge with Skydance Media, with the merger expected to complete in early 2025. This strategic move is anticipated to inject significant capital into Paramount, aiding in debt reduction and enabling investments in new content and technologies.
Entry: on market open
Target: 17.00 just below the weak resistance.
SL: 7.50
P.S. We are sitting on a very key support area which has been overviewd long term which is around the 9.00 and 11.00 area, so this gives us additional confidence in the stock increasing.Hopefully the positive earnings report will have another beat in EPS, and would yield great value.

BHP - Leading power in the Copper business!Overview of our analysis for BHP!
BHP Group Limited (BHP) is one of the world’s leading diversified natural resources companies, with operations in minerals, oil, and gas. Headquartered in Australia, BHP is a dominant player in the global commodities market, particularly in iron ore, copper, and coal.
Strong Financial Performance
Revenue Growth: BHP has consistently delivered strong revenue growth, supported by rising commodity prices and operational efficiencies.
Robust Profit Margins: The company's disciplined capital allocation and cost management strategies have enabled it to maintain high profit margins.
Dividend Yield: BHP offers an attractive dividend yield, making it a preferred choice for income-focused investors.
Copper Market Leadership
Strategic Copper Operations: BHP’s Escondida mine in Chile is the world’s largest copper-producing mine, providing significant leverage to the rising demand for copper.
Green Energy Transition: Copper plays a vital role in renewable energy infrastructure and electric vehicles, positioning BHP to benefit from the global energy transition.
Investment in Growth: BHP is actively investing in expanding its copper production, further solidifying its leadership in this critical sector.
Diversified Portfolio and Resilience
Balanced Commodity Exposure: BHP's diversified commodity mix, including iron ore, copper, and metallurgical coal, reduces reliance on any single market, providing stability in volatile conditions.
Long-Term Contracts: The company maintains long-term contracts with key customers, ensuring stable revenue streams.
Operational Excellence: Continuous investments in technology and automation have enhanced operational efficiency and safety.
Sustainability and ESG Commitment
Net Zero Commitment: BHP has set ambitious targets to achieve net-zero operational emissions by 2050.
Sustainable Mining Practices: The company implements innovative technologies to reduce its carbon footprint and water usage.
Community Engagement: BHP is actively involved in community development programs, strengthening its social license to operate.
Entry: 49.63
Target: 73.01
SL: 36.30 - We are currently sitting on strong support zone for the company , which gives us a good heads up for a strong uptrend ahead, the SL is set up on the previous low if we see a huge cooldown in the overall commodity market, but at the current low supply of Copper we beleive that this is just deffensive point to protect the trade.

USGD – Asset-backed copper upsideAt ~C$0.255 (~C$56M cap), USGD holds ~13.9M shares of Vizsla Copper (VCU), worth ~C$25.7M at C$1.85 — ~46% of its market cap backed by liquid equity.
Madison (Montana) is a past-producing high-grade copper system, now drilling skarn/CRD targets with upcoming copper porphyry tests as the main catalyst. Project is already permitted (surface + underground).
Asymmetry: partial downside protection via VCU stake + cash, with upside driven by copper drilling success and upcoming spin-out. Execution from here matters.
Do your own research, please!

FCX - We had a great month, can we continue with the uptrend?FCX
Looking for a potential buy!
🔍 Technical Context:
FCX had a tremendous up-beat with 24% increase in the stock just in march!
MACD Bullish Crossover: A clear bullish cross on the MACD confirmed upward momentum.
RSI Strength: The RSI remains in bullish territory, signaling further upside potential.
Favorable Risk-Reward Setup: The stock maintains support above breakout levels, offering an attractive trade opportunity.
📰 Fundamentals
Analyst Upgrades: J.P. Morgan and Scotiabank both issued upgrades and increased their price targets, reflecting confidence in FCX’s future performance.
Tariff Advantage: Potential U.S. tariffs on imported copper could benefit domestic producers like Freeport-McMoRan, increasing their advantage.
Strategic Policy Support: FCX is advocating for copper to be classified as a critical mineral, which could unlock tax credits and boost annual profits by up to $500 million.
📌 Trade Plan
📈 Entry: 41.90
✅ Target: 58.30
❌ SL: 23.90
💡 Looking for a potential 35% increase!

Google - Last earnings call before tariffs affect revenue?Hi guys please find below the analysis we did for Google (ALPHABET)
Alphabet Inc. (NASDAQ: GOOG) is poised to deliver a robust Q1 2025 earnings report, with analysts projecting revenue of $89.22 billion—an 11% year-over-year increase—and net income of $24.71 billion ($2.01 per share), up from $23.66 billion ($1.89 per share) a year ago . This anticipated growth is largely driven by Alphabet's strategic investments in artificial intelligence (AI) and cloud computing, which have bolstered its core businesses, including Google Search and YouTube .
Resilience Amid Tariff Concerns
While recent U.S. tariffs have disrupted global supply chains, particularly affecting hardware-dependent sectors, Alphabet's business model is predominantly digital and service-oriented. Its primary revenue streams—digital advertising, cloud services, and AI-driven platforms—are less susceptible to such trade tensions. Analysts from Citi and Morgan Stanley have expressed confidence in Alphabet's ability to navigate macroeconomic challenges, citing the company's AI-driven innovations as key growth drivers.
General analyst Confidence and Stock Performance
Despite a 20% decline in Alphabet's stock value earlier in 2025, the company's strong fundamentals have led to bullish sentiments among analysts. Price targets have been set as high as $195, suggesting a potential upside of up to 29% from recent levels . The company's continued focus on AI and cloud services positions it well for sustained growth, even amidst global economic uncertainties. In summary, Alphabet's upcoming earnings call is expected to highlight the company's robust performance and resilience, underscoring its ability to thrive despite external economic pressures.
📌 Trade Plan
📈 Entry: 155.41
✅ Target: 181.30
❌ SL: 121
We are looking for +-20% increase in the upcoming days/weeks!

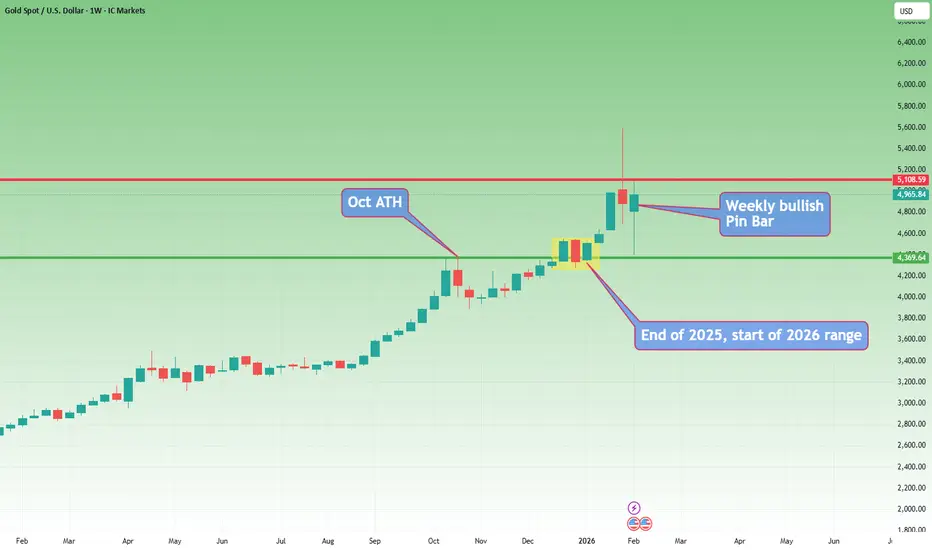
Gold- From weekly to 15m chart. Where are the trades?These days, everyone has an opinion on Gold.
Most of them are bullish.
And to be fair — so am I.
But here is what many traders either don’t understand or simply ignore:
There is a huge difference between having an opinion and having a tradable opinion.
A tradable opinion is one that can actually be executed in the market, with leverage, risk control, and realistic stops — not just a direction on a chart.
This analysis is not about saying “Gold is bullish, it will go to 6k or 7k, I’m a genius if it does.”
It’s about giving traders something they can actually work with.
🔎 Weekly Chart — Big Picture Reality
Three things stand out immediately:
1️⃣ The 5600 → 4400 drop
Yes, it was massive:
- ~12,000 pips
- large in percentage terms
- emotionally shocking
But in long-term trend terms?
👉 Just a correction.
Even if we measure only the 2025 rally, the drop didn’t even reach a 50% retracement.
2️⃣ Technical respect of structure
The decline stopped almost exactly at the October 2025 ATH, which acted as support.
Markets remember levels.
This is not random.
3️⃣ Alignment with congestion
The drop also aligned with:
- the late-December congestion zone
- the starting price of 2026
The first prices of the year often act as major S/R zones.
This is classic market behavior.
✅ Conclusion from Weekly:
Trend is bullish. No debate here.
❌ But tradable?
Not really.
Why?
Because a correct structural stop would be ~8,000 pips away.
With leverage, that’s not trading — that’s praying.
🔎 Daily Chart — Still Bullish, Still Not Tradable
On the daily:
- clean reversal from support
- first impulsive leg up
- pullback forming a higher low
- recent Piercing Line bullish pattern
Again:
✅ Bullish structure
❌ Not tradable structure
A proper stop still sits ~4,000 pips away.
That’s not risk management.
🔎 15-Minute Chart — Where Trading Actually Happens for me lately
Given current volatility, this is what matters these days
Here’s what we see:
- initial rally in a rising wedge
- rejection from resistance
- drop from 5100 → 4650 contained within a bullish flag relative to the impulse
- breakout above flag resistance
- continuation toward 5k
- NY close near highs
Structurally?
👉 Still bullish.
But even here:
❌ Buying blindly at 4965 makes no sense.
We need a dip.
We need structure.
We need asymmetric risk.
📌 The Two Buy Zones That Make Sense
If price offers them:
✅ 4900
✅ 4800
Those are the zones where risk/reward becomes logical.
⚠️ The Reality Most Traders Don’t Want to Hear
Even on a 15M chart:
- stops of 300–500 pips are normal
- targets should be well above 1,000 pips
Let’s be honest:
Bragging about a 100-pip Gold target these days is like bragging about a 2-pip win on a EURUSD trade.
simply not trading...
✅ Final Conclusion
✔️ Gold is bullish
✔️ I will look to buy dips
✔️ But only with structure and discipline
Because in this environment:
- volatility is extreme
- emotions are expensive
- precision matters more than bias
A trader’s job is not to be right.
A trader’s job is to make money.
And those are two very different things. 🚀
P.S.
And yes — if I see a clear reversal structure on the 15-minute chart, I can take a short trade, even if my overall bias on Gold remains bullish.
This does not contradict my opinion.
It simply reflects the reality that:
You can be bullish on the bigger picture and still trade short-term corrections.
Have a nice Saturday!
Mihai Iacob
BUY $FIGStarted buying today.
Happy to buy any levels below 30 for a long-term hold.
I like the CEO and like the future prospects here.
GL!

Software Repricing in the AI EraSummary thesis:
Software isn’t collapsing — it’s being repriced.
For much of the past decade, software outperformed on the back of SaaS models, seat-based expansion, and expanding valuation multiples. AI is now disrupting the monetization unit faster than it clarifies the new one. That uncertainty is driving terminal-value repricing, not a cyclical growth scare.
What the chart is saying:
IGV has broken its long-term trend and failed to reclaim it. That behavior is consistent with a valuation reset, even as company-level execution remains largely intact.
About the recent sell-off:
The last week showed panic-like selling (volatility spike, fear gauges moving sharply). Panic in a structural repricing typically produces relief rallies, not durable trend reversals.
Prediction:
Near term: high probability of a reflexive bounce off panic conditions.
Medium term: rallies are likely to fail below broken resistance as repricing continues.
Base-case path: continued digestion / underperformance with price discovery toward a 65–70 zone before a durable base can form.
Invalidation:
This view changes if IGV reclaims and holds its long-term trend on a weekly basis and relative strength vs broader tech stabilizes.
Bottom line:
This is not a crash. It’s a reset.
In the AI era, growth alone no longer guarantees multiple expansion — defensibility does.

Silver, Hope you like the game Ping Pong.Silver… welp, we all knew this day would come.
Silver is sentimental for a lot of investors—it’s the gateway metal. The first shiny thing people buy before wandering into the jungle of equities, options, and futures. But the story isn’t nearly as black‑and‑white as the r/Silver crowd likes to paint it.
Back in the 1890s, countries had to pick their monetary “starter Pokémon”: gold or silver. Most of Europe and the U.S. went gold. Meanwhile, countries like Spain, China, India, Iran, and much of South America ran on silver. And then you had a third group—countries that didn’t back their currency with any metal at all, instead pegging themselves to other nations’ currencies. That was common across Africa and parts of Asia.
And here’s the pattern:
- Gold‑backed countries became the “first world.”
- Silver‑backed countries became “developing” or “second world.”
- Countries pegged to others’ currencies became “third world.”
This isn’t a coincidence. It’s the foundation for why U.S. banks and firms (we won’t name names, but you know the usual suspects) spent decades suppressing silver’s price.
Why suppress silver? Three reasons:
1. Stunting silver‑rich nations.
Many second‑world countries hold massive silver reserves. Keep silver cheap, and you keep their development throttled. That forces them to rely on U.S. markets, the World Bank, and the regulatory/sanctions machinery that comes with it.
2. Masking inflation at home.
If silver were allowed to appreciate naturally, Americans would have a much clearer view of what inflation has done to the dollar’s purchasing power. Can’t have that.
3. Profit. Obviously.
Paper silver, futures contracts, leveraged plays—Wall Street has made a fortune gaming the spread between physical and paper markets.
So where are we now?
We’re spectators. Peasants in the cheap seats watching global superpowers volley the price of silver like a geopolitical ping‑pong ball.
China is the heavyweight at these price levels. Some of the U.S. banks that historically pushed silver around simply don’t have the capital to dominate the game anymore. China, however, *does*—and they absolutely do not want silver dropping below \$35, because that’s where Wall Street regains control.
China’s also carrying a mountain of new debt. Their real estate sector imploded, they took on Venezuela’s debt in exchange for oil access, and then the U.S. stepped in and said, “Cute deal you’ve got there—shame if someone… took it.” Now China’s holding liabilities that weren’t even theirs to begin with.
This isn’t just about metal. It’s about **superpower status**.
Measured by nominal GDP, China is roughly \$10 trillion behind the U.S. If that gap closes, history tells us something uncomfortable: when two nations reach similar economic size while competing for global dominance, the probability of conflict approaches 100%. Not my opinion—just historical pattern.
So yes, the world stage is now fighting over silver’s price. The U.S. doesn’t want China’s silver stockpile appreciating too much. China needs it to appreciate to service debt—or face default and humiliation.
Where does that leave silver?
It’ll likely rise, but in a slow, controlled, heavily‑managed fashion. Not the explosive catch‑up move we just saw after decades of suppression. More like a supervised climb with both superpowers tugging on the rope.
And for us?
We’re just the spectators. The peasants. Watching the ball go back and forth.
Hope you enjoy ping‑pong.

Full Reset before Full SendWhy March 2025 Could See New Highs
What's Happening Right Now?
Everyone is freaking out right now, but this is actually creating one of the best buying opportunities we've seen. Bitcoin is trading around $95,600 after dropping about 24% from its peak of $126,000 in October.
The Fear & Greed Index is at 10 (Extreme Fear) – and you know what they say? Be greedy when others are fearful. But, also, be patient and set limits.
The thing is, most people don't understand the economics behind Bitcoin or how liquidity actually works in crypto markets. We're playing a completely different game than stocks here.
The Real Cost to Mine Bitcoin (And Why It Matters)
Here's where it gets interesting. The big mining operations are producing Bitcoin for around $26,000-$28,000 per coin, while less efficient miners saw costs spike to $114,842 in October 2025... That's a massive range, and it tells you everything about where the floor is.
After the April 2024 halving, it now takes 854,400 kilowatt-hours to mine just one Bitcoin – that's about 81 years of electricity for an average home, just for one coin. That's a fun fact.
No smart miner is going to sell at a loss when they're paying that much for electricity and equipment (GPUs, etc). They'll just hold and wait. This creates natural supply constraints.
The Liquidity Trap
Right now, the market is in what I call a liquidity trap. As Bitcoin crashed from $126K down to where we are now, all the leveraged traders got wiped out. We saw $870 million in Bitcoin ETF outflows in a single day – that's both panic selling and intelligent, planned shorting, not fundamental weakness.
Here's what most people are missing: if Bitcoin drops to around $75K, it's going to unlock massive amounts of liquidity – I'm talking hundreds of millions, possibly billions of dollars that's currently locked up in long positions (Futures).
When those long get liquidated, the shorts will likely reverse their positions, that money floods back into the market and creates a supply shock. Basic economics: limited supply + sudden demand increase = price explosion.
Price Targets & When to Buy
I think we'll see $89K very soon – possibly this week between Monday and Wednesday (November 17-19, 2025). But here's my recommended strategy instead of trying to catch the exact bottom:
First Buy: $89K
Put in about 30% of what you're planning to invest. This is still a good entry even though it's not the absolute bottom.
Second Buy: $80K
Another 35% here. This is where things get really interesting from a risk/reward perspective.
Third Buy: $75K
The final 35%. This is the sweet spot where all that trapped liquidity gets released. Remember, demand increases as the price drops, and miners won't sell below cost. That's your supply shock waiting to happen.
What About MicroStrategy?
MSTR has crashed about 40% and is now trading at only 1.06 times its Bitcoin holdings, down from 2.7 times. The stock is around $200-$237 now, way down from its November 2024 high of $543.
My prediction: MSTR will probably hit the $140-$150 range, maybe even drop to $100-$120 (which is where it found strong support from March to September 2024). If we do see those lower prices, I'm going all-in on
MSTX
shares, not
MSTR
– the 2x leverage structure is better.
The Macro Picture
Fed rate cut expectations dropped from 90% to about 40%, which is why everything's selling off. But this is temporary sentiment, not permanent damage. The infrastructure is still being built, institutions are still coming in, and the fundamentals haven't changed.
Bottom Line
Be patient. Wait for the dips. Bitcoin will likely hit $89K this week, and from there we could see further drops to $80K and $75K. Each level is a buying opportunity. By March 2025, I expect we'll be making new all-time highs.
The key is understanding that crypto operates on different rules than stocks. Liquidity and supply dynamics matter more than anything else right now.
Good luck,
Terrapins

SMCI (Super Micro Computer) - Buy The Dip!!!!!!! 🚨 SMCI – Potential Golden Opportunity at Extreme Value Levels 🚨
SMCI just delivered strong earnings, yet the stock is trading at levels that historically represent deep value zones.
On my chart, we’re seeing three major signals align:
• Price sitting right on the 300-day moving average, a level institutions often defend.
• Oscillators flashing extreme oversold conditions, meaning selling pressure may be exhausted.
• Fundamentals still strong, and SMCI remains a key infrastructure player in the AI boom, supplying hardware powering data centers and AI expansion worldwide.
In my view, this isn’t just another tech stock, it’s one of the backbone companies enabling AI growth, and markets often overcorrect before reversing.
When strong companies get oversold, patient investors tend to get rewarded.
Now, this doesn’t mean price instantly rockets higher. Volatility is normal. But risk-reward looks increasingly attractive at these levels, especially for those thinking beyond short-term noise.
⚠️ As always, this is just my personal analysis and opinion, not financial advice. Do your own research, read your chart and manage your risk responsibly.
But from where I sit… this chart is currently screaming: "Buy The Dip!!!!"

$AMD — Post-Earnings | Decision zone, not an impulse buyAMD (Advanced Micro Devices) saw a huge earnings fade (~-17%) that just flushed out most of the recent gains. Such a move isn’t noise. It’s a repricing.
From a daily perspective:
🔹 $200 is an important support (was a respected one) 🔹 Huge rejection from the ATH (~264) 🔹 Price is below all key value areas (be careful) 🔹 Post-earnings volatility is high (emotional trap zone)
⚠️ Important: Buying because “it already fell a lot” is a common mistake. Avoid!
📌 What I’m looking for:
Price equilibrium
End of selling force
Price above VWAP (or key MA)
A higher low or trend line break Structural confirmation
🎯 Summary
❌ Existing price action is not an impulse entry.
⏳ It’s a decision zone.
✅ Predicting is a mistake. It’s about patience and reaction.
Remember, the market will always provide an opportunity — It’s when you force one that will get you in trouble.
Not financial advice. Risk management above all.

Gold (XAUUSD) — Pullback Before Continuation?After a strong sell-off, gold has entered a consolidation phase, where oversold signals appeared on higher timeframes.
This corrective structure allowed price to rebound, and gold is now pausing around the 5000$ zone.
🧠 Technical Perspective
• Higher timeframes showed oversold conditions, suggesting selling pressure was exhausted
• Price reacted upward and is now consolidating after the impulse move
• On the 1H timeframe, a bullish convergence is forming, signaling weakening bearish momentum
📉 Expected Scenario
I expect one more pullback toward the 48xx$ area before price continues higher.
This zone stands out as a potential demand area, where price is likely to find support.
Why?
🔍 Volume Insight
• Historical trading volume around the 48xx$ zone is relatively low
• Markets often reverse in low-interest areas, where liquidity is thin and sellers lose conviction
• This makes the zone a strong candidate for price rejection, rather than continuation lower
📌 Trading Idea
At current levels, price offers an opportunity to accumulate small buy positions, rather than entering aggressively.
This is a positioning zone, not a FOMO entry.
🎯 Key Takeaway
Gold often reverses where the market pays the least attention.
By combining:
• Higher timeframe oversold conditions
• Volume behavior
• Lower timeframe convergence
This pullback appears to be a healthy correction within a larger bullish structure, not a trend reversal.
⚠️ Always manage risk properly and wait for confirmation.

Morpher long-term: Bearish Full Analysis!
CRYPTO:MPHMUSD
💡Hello Traders!💡
🏹This analysis is for all those traders who don't know what to trade. Or are confused like several others for hearing people say trade this; trade that but don't explain to you why and normally have a dangerous risk for your investment. I only trade after research and until I'm confident that the risk is minimum.
📉🎯Market Structure
Recently, Morpher has devalued like crazy. Once worth more than $0.02 per MPH now it is worth around $0.0072 and will continue to go down. I have been trading for more than a year this crypto and understand this crypto. It no longer is the crypto that kept its investor motivated and are lacking communication with investors and updates.
🐻💰Bear Market Is Obvious
The picture of the trend is now very clear. Because it leads to a sell-of which takes it to the point it it now. The only way this crypto can go up is if there is a crypto rally. Otherwise this is now a dead crypto; which makes it an ideal crypto to short.
NOTE : ⚠ Every trader should do their own research to be able to trade with confidence. This information has worked for me and wanted to share. That´s why I love TradingView theme "LOOK FIRST / THEN LEAP".
👍Thanks for your attention!👊
👇Feel free to comment below!👇

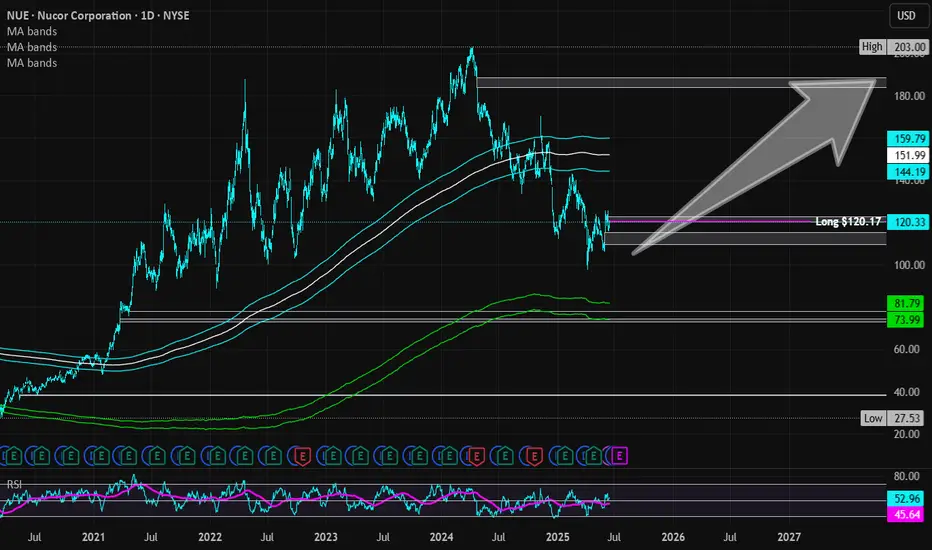
Nucor | NUE | Long at $120.17Nucor NYSE:NUE , a US manufacture of steel and steel products, will likely capitalize on reduced foreign competition as tariffs become reality. The CEO also recently stated that the steelmaker's order backlog is the largest in its history and is increasing prices. So, while there is a potential for short-term downside as tariff "unknowns" are negotiated, the longer-term upside may be there for those who are patient... but time will tell.
Basic Fundamentals:
Current P/E: 21x
Forward P/E: 15-16x
Earnings are forecast to grow 29.6% per year
Projected Revenue in 2025: $32.3 billion
[*} Projected Revenue in 2028: $39.4 billion
Debt-to-Equity: 0.4x (healthy)
Dividend Yield: 1.8%
Technical Analysis:
Riding below the historical simple moving average and there is risk the daily price gap near $109 will close before moving higher. If there is a "crash" in price, $70s is absolutely possible which will be a "steel" if fundamentals do not change.
Targets in 2027:
$142.00 (+18.2%)
$187.00 (+55.6%)
TGT: All levels of interestTGT (Target), consumer defensive play crashing on bad earnings and inflation concerns....
Weekly chart.
Now oversold. Can we go lower?
Here are the levels I'm watching to enter:
- 139.30: I'll be buying if we reach that level. If it holds it will be a long term investment for me. If it just bounces and drops, I'll be selling and looking for the next level.
- 90-82: is the second zone of interest I'm watching. If we reach this zone I'll buy stocks as a long term investment.
Trade safe.
