ZB: 30 Year Treasuries Face a Defining Data Week The Long Bond and the Shifting Inflation Narrative
The ZB thirty year Treasury futures contract represents the long end of the United States Treasury yield curve and is primarily driven by expectations around inflation, growth, fiscal policy, and long term interest rate risk. Because of its long duration, ZB is the most sensitive Treasury product to changes in inflation expectations and shifts in term premium. When markets become concerned about persistent inflation or increased Treasury issuance, ZB tends to underperform. When growth risks rise or inflation pressures ease, ZB often attracts defensive demand.
Within the Treasury complex, ZB sits at the far end of the curve, while ZT two year, ZF five year, and ZN ten year futures reflect progressively shorter duration exposures. ZT is most reactive to Federal Reserve policy expectations, ZN tends to balance policy and growth considerations, and ZB expresses longer term confidence or concern about economic stability and inflation control. Over the past few months, sentiment in ZB has improved as inflation has moderated from prior highs and recession risks have remained present but not fully realized. The narrative since late spring has centered on easing tariff fears, slower but resilient growth, and a market that is gradually reassessing how restrictive policy needs to remain over the long run.
This week, macro data will be a major driver. CPI on January 13th, followed by PPI and retail sales on January 14th, will shape near term direction. A miss in CPI or PPI, particularly on core measures, would likely support ZB as it reinforces the idea that long term inflation pressures are cooling, allowing yields to drift lower. A beat in inflation or strong retail sales would pressure ZB lower, as it would revive concerns that growth and pricing power remain too firm for comfort at the long end of the curve.
What the Market has done
• Since bottoming out at the 109'14 area in May 2025 after tariff fears were alleviated, bids have stepped up and the market has steadily reclaimed the April Trump liberation tariff selloff.
• In September 2025, buyers were able to overcome sellers at 116’00, which was daily level 2 and a four month resistance level where sellers had previously defended.
• Subsequently, buyers were able to defend this level until the end of November, when bids slipped and sellers were able to offer prices down through the September 5, 2025 low value area and single print at 115'20 to 114'20.
• Since December, the market has been consolidating sideways within this zone, filling in and repairing the LVA as balance has developed.
What to expect in the coming week
The key level to watch is 115'25 to 116'00, which represents the previous week’s close, the current consolidation block high, and the over-under zone of daily level 2.
Neutral scenario
• Expect the market to continue consolidating in a tight range, potentially between 115'25 and 115'05, as participants wait for clarity from CPI on January 13th and PPI and retail sales on January 14th.
• In this scenario, rotational and mean reverting behavior should dominate, with responsive buyers and sellers active at range extremes.
Bearish scenario
• If the market is unable to accept above 116'00, expect a rotation back down through the consolidation block toward 114'18, which aligns with the range low and weekly one standard deviation low.
• This bearish scenario is likely to be very choppy and difficult to trade, as the market remains in balance within the broader 116 to 114'20 range.
Bullish scenario
• If the market is able to accept above 116'00, price could move up through offer block 1 toward 117'00, which represents the high of offer block 1 and the weekly one standard deviation high.
• In our opinion, this is the cleaner trade opportunity, as the market would be imbalancing out of the current balanced and composite value area, opening the door for directional follow through.
Conclusion
ZB sits at a critical decision point, balancing between a well repaired value area below and a clearly defined acceptance zone above. With CPI scheduled for January 13th, followed by PPI and retail sales on January 14th, the market is likely to remain patient until these releases provide clarity on inflation persistence and demand strength. A softer inflation print or weaker consumption data would support acceptance higher and reinforce the bullish imbalance scenario, while firmer data could keep ZB capped and pressure price back through the current consolidation. In our opinion, traders should focus on how price responds at 116'00 and 115'25 following the releases, as acceptance or rejection at these levels will likely define the next directional opportunity.
If you found this analysis useful, feel free to give a boost, comment, or share your own levels and scenarios below.
Disclaimer: This is not financial advice. Analysis is for educational purposes only; trade your own plan and manage risk.
Acronyms:
w - Weekly
VAH - Value Area High
VAL - Value Area Low
VPOC - Volume Point of Control
LVN - Low Value Node
HVN - High Value Node
LVA - Low Value Area
SP - Single print
ZB1!

3 Indicators To Watch For 2026Since 2022, I have been using these three markets to track the direction of the US indices.
As long as US bonds are not in a downtrend, the yield curve is not inverted, and inflation is not making a comeback, US indices should remain resilient.
However, although US indices closed higher in 2025, their performance has lost its shine compared with a much smaller market such as the Singapore Straits Times Index.
Why? Because US bonds remain in a downtrend, inflation is at a crossroads, failing to move closer to the 2% target, and although the yield curve is no longer inverted, borrowing costs remain significantly higher than in the post-COVID period of 2022.
U.S. Treasury Bond Futures & Options
Ticker: ZB
Minimum fluctuation:
1/32 of one point (0.03125) = $31.25
Disclaimer:
• What presented here is not a recommendation, please consult your licensed broker.
• Our mission is to create lateral thinking skills for every investor and trader, knowing when to take a calculated risk with market uncertainty and a bolder risk when opportunity arises.
CME Real-time Market Data help identify trading set-ups in real-time and express my market views. If you have futures in your trading portfolio, you can check out on CME Group data plans available that suit your trading needs www.tradingview.com
#Microfutures

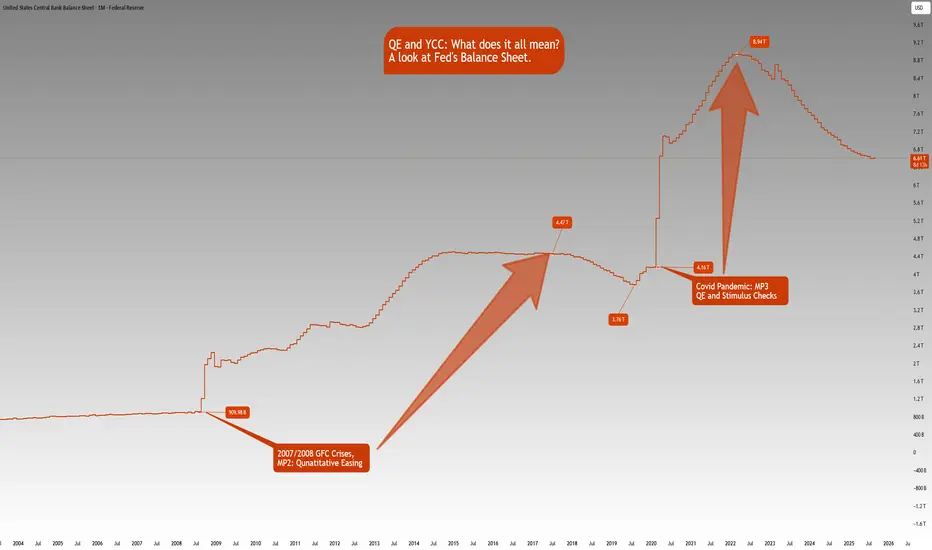
QE and YCC: What does it all mean?ECONOMICS:USCBBS
CBOT:ZB1! CBOT:ZN1! CME_MINI:NQ1!
There is growing market speculation that the Fed may tolerate inflation above 2% for longer, consistent with its Average Inflation Targeting (AIT) framework introduced in 2020.
This also implies that real rates i.e., nominal rates minus inflation are likely to fall significantly. Given this, we anticipate gold to continue trending higher as the U.S. dollar's purchasing power erodes with mounting debt, persistently higher inflation, and falling real yields.
What is QE?
Quantitative Easing (QE) refers to the Fed injecting liquidity into financial markets by purchasing large quantities of assets such as Mortgage-Backed Securities (MBS) and U.S. Treasuries, especially during periods of economic stress like the Global Financial Crisis (2007–2008) and the COVID-19 downturn.
How Does QE Work?
Asset Purchases: The Fed buys large volumes of Treasuries and MBS from financial institutions.
Balance Sheet Expansion: These purchases expand the Fed's balance sheet (now hovering near $6.6 trillion, per FRED).
Increased Liquidity: Banks receive excess reserves in exchange, increasing system-wide liquidity.
Lower Interest Rates: Demand for bonds pushes prices higher and yields lower.
Economic Stimulus: Lower borrowing costs promote credit creation, investment, and consumer spending.
However, a key drawback of QE is asset price inflation. As seen between the GFC and the COVID-19 pandemic, low rates and excess liquidity drove significant appreciation in equities, housing, and other financial assets, even while consumer inflation remained near target.
QE vs. Stimulus Checks
If traditional interest rate policy is Monetary Policy 1 (MP1), then QE is MP2. Stimulus checks, or government handouts, fall under MP, a fusion of monetary and fiscal policy.
While QE primarily injects liquidity into financial institutions, stimulus checks inject purchasing power directly into households. This approach where the Treasury issues debt and the Fed purchases that debt, stimulates demand for real goods and services. We saw this during the post-COVID recovery, which brought a sharp rebound in consumer activity but also a surge in inflation, reaching a peak of 9.1% in June 2022 (CPI YoY).
QE impacts Asset Price Inflation
Stimulus Checks impact Goods & Services Inflation
What is YCC? (Yield Curve Control)
Yield Curve Control (YCC) is a policy whereby the central bank buys government debt across various maturities to control yields not just at the short end (via rates), but across the entire yield curve.
A prime example is the Bank of Japan, which has used YCC since 2016 to anchor 10-year JGB yields near zero. The Fed has not formally adopted YCC, but market participants believe it may lean in that direction in the future especially during crises where long-end rates rise undesirably. Mounting US debt and rising long end yields may prompt the Fed to step in and adopt YCC like BoJ has done previously.
Front-End Control: Managed via policy rates
Long-End Control: Central bank buys 5Y, 10Y, 20Y, 30Y Treasuries to anchor yields
Potential Risks of YCC:
Credibility Risk: If inflation rises while the central bank suppresses yields, it may lose market trust.
Currency Pressure: Artificially low yields may trigger speculative pressure on the currency (as seen with the yen under BoJ YCC).
We’ve kept this concise and digestible for now, but there’s more to unpack—especially on the long-term implications of coordinated monetary-fiscal policy (MP3), debt sustainability, and central bank credibility.
The Fed’s balance sheet chart shows how Fed’s balance sheet has increased:
Aug 1, 2008: $909.98B
Jul 1, 2017: $4.47T
Aug 1, 2019: $3.76T
Feb 1, 2020: $4.16T
Mar 1, 2022: $8.94T
Aug 1, 2025: $6.61T
Note that this is not just a US phenomenon. It is a world wide phenomena looking at many of the developed and emerging markets. The Debt to GDP ratios are increasing, Central Banks balance sheets are rising in tandem with rising government debt.
With the rate cutting cycle starting, it is a matter of time that we also see QE restarting.
If you’d like us to dive deeper into any of these topics in future educational blogs, let us know. We're happy to build on this foundation with more insights.
ZB/MOVE Strategy📚 Bond Market Volatility & MOVE Index Strategy
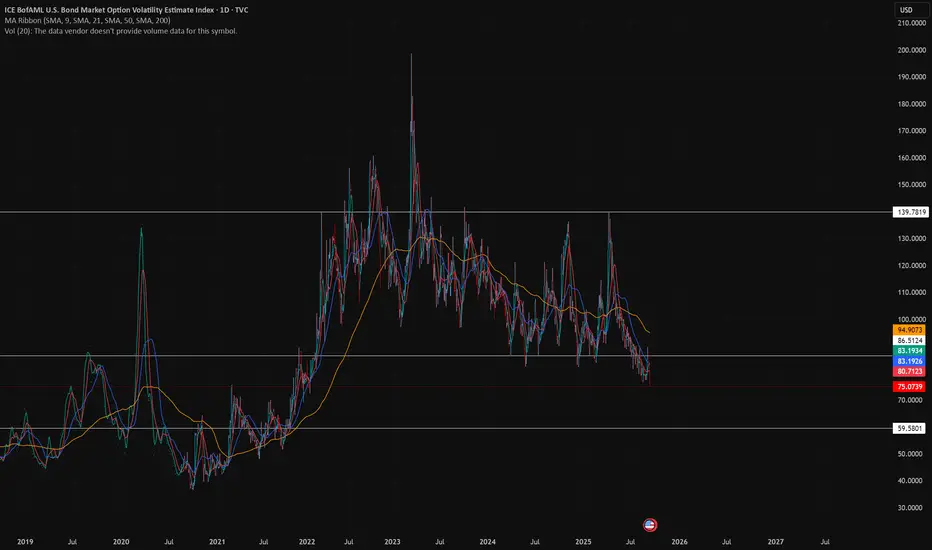
1. What is the MOVE Index?
MOVE = Merrill Option Volatility Estimate (created 1998 by Merrill Lynch, now ICE).
It measures implied volatility in U.S. Treasury options (1-month maturities across 2y, 5y, 10y, 30y).
Known as the “VIX of the bond market”.
Normal range = 55–130.
Below 60 → calm bond market.
Above 120 → extreme stress.
Historical extremes:
2008 Financial Crisis → 264.
March 2023 Banking Crisis → near 200.
2. Why It Matters for Trading
Bonds are normally “safe” assets, but when MOVE spikes:
Rates swing wildly → Treasury ETFs (TLT, IEF) become volatile.
Correlations with stocks shift (sometimes both down).
Like the VIX, MOVE can be used as:
A fear gauge (risk-on/risk-off sentiment).
A timing tool for tactical entries/exits in long-term Treasuries.
3. Typical Bond Behavior vs MOVE
High MOVE (panic):
Bonds often sell off hard (yields spike).
After panic, Treasuries may rebound sharply as flight-to-safety resumes.
Low MOVE (calm):
Bond yields drift slowly.
Carry trades (borrowing short-term, buying long-term) work better.
4. MOVE–TLT Strategy Example (Conceptual Backtest)
Rules:
Buy TLT (20+ Year Treasury ETF): when MOVE > 150 (panic zone).
Exit to Cash: when MOVE < 100 (calm zone).
Why It Works:
Extreme MOVE spikes = fear washouts → bonds oversold.
Exiting at calm levels avoids long drawdowns when yields grind higher.
Enhancements:
Filter by trend: Only take BUY if TLT is above its 200-day MA.
Inverse play: Short TLT (or long TBX, TBT) when MOVE climbs from calm → stress zone.
5. Strategy Pros & Cons
✅ Pros
Rules-based, objective, avoids “gut calls” on rates.
Catches panic-driven rebounds.
Reduces exposure during long bond bear markets (like 2022).
❌ Cons
MOVE is not directly tradable (only as a signal).
Timing lags → by the time MOVE spikes, drawdown in ZB/TLT may already be deep.
False signals during policy-driven markets (e.g., QE, yield curve control).
6. Practical Trading Tools
ETF Plays:
Long Bonds: TLT, IEF, ZROZ.
Short Bonds: TBT, TMV, TBX.
Futures:
ZB (30Y Treasuries), ZN (10Y), ZF (5Y).
Options:
MOVE itself = implied vol proxy.
TLT options → hedge with straddles when MOVE spikes.
7. Educational Takeaway
MOVE is a macro volatility barometer.
It can provide contrarian buy signals for Treasuries when extreme.
Works best when paired with trend confirmation (MAs) and macro awareness (Fed policy, inflation prints, banking stress).
✅ In one line:
The MOVE index, the “VIX for bonds,” is a powerful sentiment gauge — traders can use its extreme spikes as buy signals for long bonds (TLT) or fade them when calm, turning bond volatility into a structured timing strategy.
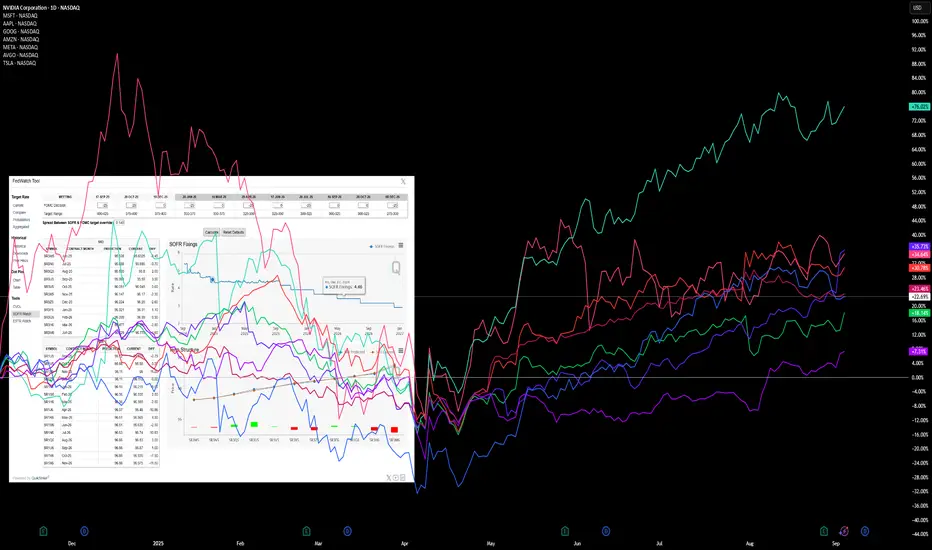
Labor Market vs. Inflation Risks: What Traders Should WatchCME_MINI:NQ1! CME_MINI:ES1! CME_MINI:MNQ1! CME_MINI:MES1! CBOT_MINI:YM1! CBOT:ZN1! CBOT:ZB1! ECONOMICS:USNFP
The stock market is currently holding near all-time highs. Today, the BLS (Bureau of Labor Statistics) report, which includes the NFP (non-farm payrolls), will be released at 7:30 am CT.
Market participants are closely watching the non-farm payrolls, with the forecast at 75K, as well as any prior revisions to earlier NFP numbers. The unemployment rate is expected at 4.3%, a slight increase of 0.1%.
Looking ahead, upcoming key events include inflation data and the September FOMC rate decision:
• Aug PPI (Sep 10): A gauge of upstream price pressures. Hot numbers would signal renewed inflation risks.
• Aug CPI & Core CPI (Sep 11): Critical headline data. A softer print would support the dovish case.
• Fed Decision (Sep 17): This meeting comes after the Aug NFP data release (Sep 5).
While there is broad optimism and euphoria in the market, we remain cautious based on our analysis of major futures indexes. Traders should be mindful of signals that could point to a pullback.
Our reasoning:
Markets are currently pricing in two 25 bps cuts for the September and October FOMC meetings, which would bring the target rate down to 3.75%–4.00%.
Additionally, markets are now pricing in four 25 bps cuts in 2026. Prior to the Jackson Hole meeting and recent Fed-related developments, expectations were for three cuts in 2025 and two cuts in 2026.
Does this imply that the effective tariff rate is benign? Is inflation expected to fall, or does this suggest that the Fed is willing to tolerate average inflation in the 2.5%–3.0% range?
The upcoming Fed meeting is likely to emphasize risks to the labor market, while downplaying inflation risks, highlighting the tradeoff within the Fed’s dual mandate.
Other considerations:
Seasonal and cyclical flows also suggest that equity indexes tend to underperform in September and October on average.
Risk-Monitoring Framework: Signs of a Pullback
Given the deteriorating macro backdrop, further steepening of the yield curve, persistently high long-end yields, and the heavy concentration of stock market capitalization in the Mag 9 stocks, it is critical to monitor:
1. Rates & Yield Curve
• 2s10s & 5s30s steepening: Excess steepening with long-end yields above 4.5% would tighten financial conditions.
• SOFR futures spreads: Divergence vs. FOMC guidance can signal rate-path misalignment.
2. Labor Market Signals
• NFP revisions: Downward revisions of >50K would reinforce labor weakness.
• Unemployment rate: Sustained above 4.3% could mark a turning point for the Fed’s labor mandate.
3. Inflation Data
• PPI upside surprises: A risk that supply-side shocks re-ignite inflationary pressures.
• CPI/Core CPI stickiness: Core >3.1% YoY would challenge the market’s dovish pricing.
4. Equity Market Internals
• Mag 9 leadership: Watch for relative weakness in NVDA, AAPL, MSFT, AMZN, META, TSLA, GOOG, AVGO, and BRK.A.
• Breadth indicators: Advance/decline line and % of S&P 500 above 200-day MA. Narrowing breadth = fragility.
• Volatility (VIX): A spike above 20 would indicate stress returning to equity risk sentiment.
5. Cross-Asset Indicators
• Credit spreads (IG & HY): Widening signals stress in funding markets.
• USD & Commodities: Rising USD and higher energy prices would tighten global liquidity.
Conclusion
While optimism remains strong, we caution that macro deterioration, yield curve dynamics, and concentrated equity leadership create fragility. Pullback risks rise if:
• NFP disappoints sharply,
• inflation re-accelerates, or
• outperformance in the Mag 9 begins to roll over.
Traders should monitor these risk indicators closely, as they often precede market drawdowns in September–October.
Long Idea on USDHUFBased on :
-Negative Correlation with ZB1!
- Vwap support
- Demand zone
- Volume profile analysis

Buy Idea on Us Dollar Index (Dxy)Based on :
- Demand zone
- Pin bar Reversal
- Changing of correlation between dxy and zb1!
- cot report

Macro Outlook: Trade War Jitters, Deficit, NFP FridayAlthough there is a headline fatigue and markets have been stabilizing with the worst of trade war story behind us, the fact is that uncertainty still looms. President Trump announced over the weekend that he will double down on US steel and aluminum tariffs from 25% to 50% effective June 4th.
Highlight this week is US Jobs data this Friday. A key point to determine the resilience of the US labor market. With FED Chair Powell speaking today and FED speakers scheduled throughout the week, it will be key to watch how they shape markets' probability of rate cuts?
As we previously explained, ongoing uncertainty and dragging trade concerns present more risks until resolved. Here are some key points to consider:
It remains to be seen whether the trade deficit will continue to worsen or begin to reverse. April trade data, along with any policy shifts such as a reversal on reciprocal tariffs, will be important to monitor. These indicators will provide insight into how businesses are interpreting ongoing trade uncertainty. The key question is whether they will continue front-loading inventory in anticipation of future disruptions, or if the focus will shift toward restructuring supply chains and reining in spending as part of a longer-term strategic adjustment.
At the same time, consumer spending remains resilient, supporting overall demand. However, pressure may be building on business balance sheets, particularly businesses with poor cash flow to manage front loading inventory spending as the trade environment remains volatile. If consumer spending begins to weaken, businesses may be forced to cut costs, scale back investment, or offer steep discounts to clear excess inventory. This could lead to a cycle of margin compression, especially if firms attempt to pass higher costs onto price-sensitive consumers, potentially suppressing demand further.
Conversely, if businesses choose to absorb rising costs to maintain competitive pricing, they face deteriorating margins but may be betting on continued strength in consumer credit, household savings buffers as evident. Consumer confidence, despite being low, is not an accurate indicator in times of uncertainty. Here, we should watch what consumers do and not the sentiment.
In this scenario, firms may delay cost-cutting in the hope that continued strength in consumer spending will support revenues through the rest of the year.
A central tension remains: businesses must navigate a delicate balance between protecting margins and preserving demand. Meanwhile, persistent trade uncertainty and tighter financial conditions may slow capital investment and hiring, further complicating the outlook. Whether firms shift from defensive postures like front-loading toward long-term structural changes in supply chains will hinge on how durable current consumer strength proves to be and how responsive trade policy becomes in the months ahead.
Ongoing front-loading has caused ripples as the trade deficit has further widened. Will this reverse as businesses focus on sales and revenue instead of front-loading inventory?
In our analysis, trade imports, trade balance, consumer spending and corporate profits will be key to monitor despite being lagging indicators.
On the other hand, equally important to watch and monitor goods exports, durable goods to assess and evaluate the other side of the equation.
However, our focus is on imports as manufacturing jobs are at their lowest in US history.
Once the dust has settled and trade deals are locked in, it will be important to note if Exports by Country experience any significant shifts.
What does all this mean for the stock market and futures? In simple terms, the yearly pivot and last month’s high is a major resistance area for index futures. Until this is cleared, we may see a range bound market and two way trade. There is a lot of weak structure to revisit lower. Markets may perhaps retest this before resuming higher. What we would want to see is, last month’s low holding support and this month’s price action trading inside previous month’s range or resuming higher.
If we revisit May Monthly Lows, we may see increased selling pressure come in.

T Bond Futures Quarterly chart targets the LOWSDebt levels are increasing
There is insufficient demand to soak issuance.
Interest rates need to increase.
The value of bonds is expected to decline down to the bear flag target.

Divergence Since 2020 - What Happens When Bonds Continue?When Stocks & Bond Move Opposite Direction what does it mean?
We have observed a divergence between the stock and bond markets since 2020. While U.S. Treasury bonds entered a bear zone, the stock markets continued their upward climb. What are the implications of this decoupling?
Will the stock market resume its uptrend and hit new highs? Or is this merely a retracement before further downward pressure?
A healthy, three-way interdependent relationship occurs when the economy, bonds, and stocks move in the same direction. When investors have confidence in the U.S. economy, they tend to invest in long-term bonds, which it usually will benefits the stock market.
This alignment was evident between 2000 and 2020, during which bonds and stocks moved largely in tandem.
However, from 2020 onward, bonds began declining—signaling a loss of investor confidence in the economy. Technically, this should exert downward pressure on stocks as well.
Yet, we are witnessing a divergence: Where U.S. Treasury bonds have fallen while stocks have continued to rise.
When such a divergence surfaces, it signals the need for caution in our approach in the stock markets.
What could be the other reasons why US T-bond has peaked in 2020 and depreciated by 44% since then?
Micro E-mini Nasdaq Futures and Options
Ticker: MNQ
Minimum fluctuation:
0.25 index points = $0.50
Disclaimer:
• What presented here is not a recommendation, please consult your licensed broker.
• Our mission is to create lateral thinking skills for every investor and trader, knowing when to take a calculated risk with market uncertainty and a bolder risk when opportunity arises.
CME Real-time Market Data help identify trading set-ups in real-time and express my market views. If you have futures in your trading portfolio, you can check out on CME Group data plans available that suit your trading needs www.tradingview.com
Trading the Micro: www.cmegroup.com

US10 YR Yield Weekly Chart Analysis: NFAUpdate: May 15, 2025
-As per my last update(April 5, 2025) about the gap between March 24th candle and March 31st candle that any candle body close above that gap will invert that gap from resistance to support and Upside target will be Jan 13, 2025 candle High
- We had a candle body close above that gap and now its acting like support.
-Now i am expecting the bullish trend to continue and long term upside target is Jan 13, 2025 candle High and Short term upside target is April 7, 2025 candle high

US Bond Slide Began in 2020 — Not Tariff-Driven. Why?The downward pressure did not start with the Liberation Day tariffs on 2nd April.
Based on the 30-year long-term bond price chart, the market peaked in 2020, then broke below a major support line—established since the 1980s—in 2022.
Since that break, US bonds have been on a downward trajectory.
So, what happened in 2020 and 2022 that set the bond market on shaky ground?
In 2020, the massive Covid QE signaled a tipping point in the debt issue that had been discussed for decades. By June 2022, inflation reached 9%, the highest in four decades. Investors grew concerned about the US's dependence on debt as the bond bubble appeared to burst.
Why is the recent tariff shock just a continuation of developments that began back then?
And where are bond prices heading next?
This goes beyond investors offloading its US Treasury holdings after 2nd April.
U.S. Treasury Futures & Options
Ticker: ZB
Minimum fluctuation:
1/32 of one point (0.03125) = $31.25
Disclaimer:
• What presented here is not a recommendation, please consult your licensed broker.
• Our mission is to create lateral thinking skills for every investor and trader, knowing when to take a calculated risk with market uncertainty and a bolder risk when opportunity arises.
CME Real-time Market Data help identify trading set-ups in real-time and express my market views. If you have futures in your trading portfolio, you can check out on CME Group data plans available that suit your trading needs tradingview.com/cme/
Trading the Micro: cmegroup.com/markets/microsuite.html

Why Is the T Bond Heading Down?The downward pressure did not start with the Liberation Day tariffs on 2nd April.
Based on the 30-year long-term bond price chart, the market peaked in 2020, then broke below a major support line—established since the 1980s—in 2022.
Since that break, US bonds have been on a downward trajectory.
So, what happened in 2020 and 2022 that set the bond market on shaky ground?
Why is the recent tariff shock just a continuation of developments that began back then?
And where are bond prices heading next?
This goes beyond investors offloading its US Treasury holdings after 2nd April.
U.S. Treasury Futures & Options
Ticker: ZB
Minimum fluctuation:
1/32 of one point (0.03125) = $31.25
Disclaimer:
• What presented here is not a recommendation, please consult your licensed broker.
• Our mission is to create lateral thinking skills for every investor and trader, knowing when to take a calculated risk with market uncertainty and a bolder risk when opportunity arises.
CME Real-time Market Data help identify trading set-ups in real-time and express my market views. If you have futures in your trading portfolio, you can check out on CME Group data plans available that suit your trading needs www.tradingview.com
Trading the Micro: www.cmegroup.com

t-bonds x alt season.t-bonds are primed for lift-off.
we just witnessed the largest decline in the history of the treasury. since march 2020, t-bonds have looked like they’re in a correction. most are calling it five waves down, signaling a deeper bear market. but they’re seeing the surface, not the structure.
i'm building a case that says otherwise.
the five-wave drop from all-time highs? that wasn’t the start of the bear market.
it was the end of wave c in an expanded flat that began in 2016.
most think the t-bond bear market started in 2020.
i’m saying it started in 2016,,,
and if i’m right, it just ended.
---
as the market prices-in future interest rate cuts, fueled by artificial suppression of gas prices and inflation stabilisation, t-bond values will climb throughout this next year.
normally, stocks and bonds move inverse to each other.
not this time.
this time, they move together. 1:1.
why? because the us dollar is about to get wrecked.
quantitative easing is coming back.
liquidity will expand.
the global liquidity index will rise.
the way we make that happen is by crushing the dxy.
---
tldr;
- rate cuts incoming
- making t-bonds go up
- quantitative easing
- nukes the dxy
- making stocks go up
- risk-on environment returns
- risk assets go parabolic
- alt season is triggered.
🌙

Powerful Signal for Buy On ZB1As you can see from the chart, the price right now is in a strong support zone, with a Red squeeze candle (spring box). And we are likely to see a significant explosion in price to the 119 levels.

Downside Ahead For T Bonds - COT Strategy ShortDISCLAIMER: This is not trade advice. This is for educational purposes only to demonstrate how I am looking to participate in this market. There is significant risk involved in trading, do your own homework and due diligence.
COT Strategy
SHORT
T Bonds (ZB)
My COT strategy has me on alert for short trades in ZB if we get a confirmed bearish change of trend on the Daily timeframe.
COT Commercial Index: Sell Signal
Extreme Positioning: Commercials most short they have been in last 3 years = bearish. Small Specs most long they have been in 3 years = bearish.
OI Analysis: Extreme high in OI. Generally, extremely high OI found at market tops.
True Seasonal: Strong seasonal tendency for t bonds to go down into October
COT Small Spec Index: Sell Signal
Supplementary Indicators: Acc/Dist & POIV Sell Signals
Remember, this is not a "Short Now" idea. These indicators are not timing tools. They simply tell us that this market could have a move of some significance to the downside, which we will participate in with a confirmed Daily trend change to the downside.
Good luck & good trading.

Fundamentally Setup Markets For This WeekI have identified the following markets are "set-up" for moves of some significance.
This video goes into the fundamental reasons for these trade ideas.
NOTE: I am not looking to go long/short these markets immediately. I will wait for a change in trend on the Daily to get involved with these markets. The tools used to identify these trade setups are not timing tools. The tools do give us an idea of how market participants with significant size and intelligence (commercials) are positioning themselves. The tools also give us an idea of sentiment, valuation, seasonality, and also an idea of what the (usually wrong) public/small traders are doing.
LONGS:
HEATING OIL (HO)
GASOLINE (RBOB)
MEXICAN PESO (6M)
SOYBEANS (ZS)
COTTON (CT)
SUGAR (SB)
SHORTS:
EURO CURRENY (6E)
JAPANESE YEN (6J)
SWISS FRANC (6S)
GOLD (GC)
30 YEAR TREASURIES (ZB)
Good Luck & Good Trading.

ZB Bonds 30YrThe market continues to step out the final leg of this interim B-wave up that's interceding for now before the true decline of note as we head into 2025+.
US Bonds, despite the analysis and weakness projected, remain a more viable unit than does Japan and Europe as we move forward.

ZB1 weekly analysis
ZB1 continues to trend lower, with a brief respite after finding support liquidity on Tue 03 Sep '13. This occurred alongside a favorable market environment following a drop in inflation. However, after Q1, the Fed announced that interest rates would remain fixed until 2025. This has led to a continuous decline in ZB1, targeting lower lows and aiming for short-term support liquidity around 107'05. The subsequent target, if the price continues to drop, would be 103'22.
In technical analysis, we observe the market absorbing liquidity before rallying to reach the order block for a liquidity purge.

ZBZ3Shorted in Sept shorting in Oct.
Another 30 year T-bond short most effective day to open over the last 15 yrs is 10/2 missed it but opening today. Will want to hold this open until the 24th of October. Look at the December Contract as the front running contract for this trade. Futures = Calender spread back date the long side to the March contract. Options... I am torn safe bet is to sell for the premium like a credit spread. But if your willing to chance it and pay the premium a debit spread could be worth it.
"Take a wild guess what im shorting in Nov. you'll never guess it." - KewlKat

Sell 3T Bonds at Markethello trader
Sell point 108.18 TARGET 104.22
Expecting the sell-side targets to be reached sooner or later, this would cause a rise in Interest rates and the prices of commodities and Dollar Index

Bonds showing signs of a serious risk off scenarioThe rapid decent of Bonds from 129 was telling. Yet while most think that we have reached the bottom there are indications that this is not the case.
WE are currently here:
ZB is making a retracement, I think we can see a price rebalancing up to 120'22
The potential Highs at 121'31 will lure Buyers, yet a rejection of these levels will have serious indication that investors are in for a rough patch, yields will be higher on the bright side. 🤷🏻♂️

ZBBonds are gross and so is this trade....
Short Trade (Naked no Spread)
Entry Sept 3rd, exit Sept 15
Tick Size: 32nds of a point ($31.25/ contract) rounded up to the nearest cent per contract.
Margin Maintance:4290/3900
Contract Size:$100,000
Have fun with this one................................................
"Wait until the kids get a load of this......... and their college fund is gone."
-KewlKat
