GOLD → Consolidation before reaching ATH FX:XAUUSD has been rising for the fifth consecutive day amid a weakening dollar and expectations of a dovish Fed policy. The market is testing intermediate resistance before reaching ATH.
The Fed cut rates by 25 basis points, but the market expects two cuts in 2026, not one, as stated in the regulator's forecasts. The possible appointment of a new “dovish” Fed chair is putting pressure on the dollar. The increase in US unemployment claims (to 236K) confirms fears of a slowdown in the labor market.
Tomorrow, US employment (NFP) and retail sales data will be released, followed by inflation (CPI) data on Thursday. Friday: Bank of Japan decision.
The results could significantly adjust expectations for interest rates.
The upward trend in gold continues, but its stability will be tested by macro data. Weak employment and inflation figures will support growth, while strong data could trigger a correction.
Resistance levels: 4353, 4380, 4400
Support levels: 4329, 4305
The market may consolidate before breaking through the nearest resistance. Locally - 4333, 4329, 4318. The bullish trend may continue afterwards.
Best regards, R. Linda!
Zigzag

GBPUSD - Consolidation above uptrend support FX:GBPUSD is consolidating above the support of the uptrend. Growth is facilitated by the decline in interest rates in the US.
The dollar has broken the trend and is falling under pressure from falling interest rates. GBPUSD is in an uptrend and testing key support. A long squeeze could trigger growth
The trend is upward, after updating the maximum to 1.3438, a correction is forming, within which MM is testing the break-even and interest zone of 1.3355. If the bulls hold their defense above key support, this action will support the growth of the trend.
Resistance levels: 1.3438
Support levels: 1.3355
Focus on the mirror support zone of 1.3355, which plays a fairly important role in the current uptrend. Consolidation above this zone and local confirmation of the end of the correction could trigger further growth.
Best regards, R. Linda!

GOLD - Distribution phase. Target - ATH (4380), 4400...FX:XAUUSD is rallying after breaking through consolidation resistance. The fundamental background is positive, with the train heading for an all-time high.
Expectations of a soft Fed policy remain, with the market pricing in two rate cuts in 2026. India's pension fund regulator has allowed investments in gold and silver ETFs. An increase in US unemployment claims (+44,000) has heightened fears of a slowdown in the labor market.
A reversal in the Bank of Japan's policy (rate hike) and a pause by the ECB are boosting the appeal of gold.
Any correction is likely to be short-term and will be met with support from buyers. The baseline scenario remains bullish amid soft monetary policy and a weakening dollar.
Technically, it is dangerous to sell in the current market; it is worth looking for buying opportunities after corrections or pullbacks...
Resistance levels: 4325, 4335, 4380
Support levels: 4300, 4285, 4265
The rally phase is quite aggressive due to the long period of consolidation that the market has been in. All possible factors are supporting growth. In such a market, one can only buy on pullbacks. I expect a pullback from the indicated zone, within which growth to ATH can be considered.
Sincerely, R. Linda!

BITCOIN → Downward trend pressure. 86K - 84K?BINANCE:BTCUSDT.P sold off all the gains associated with Tuesday and Wednesday's news. Technically, a false breakout of resistance is forming against the backdrop of a downtrend. There is no fundamental support.
Bitcoin failed to consolidate above 91800 - 94200, a false breakout was formed, and the price returned to the range. There is an imbalance zone on the chart, which the price may test before falling (weak technical and fundamental background).
The trend is downward in the medium term. A countertrend correction is forming, within which the market is facing pressure in the 94K - 95K zone. Zone of interest is 91850. I expect a retest, liquidity capture, and another phase of selling down to 88K - 86K.
Resistance levels: 91850, 92500
Support levels: 89550, 87980, 86260
The price is in the trading range of 84K - 94K. Resistance has been tested, and a double top reversal pattern has formed. Currently, a distribution phase is forming relative to the specified pattern and consolidation at 91850 - 94200. A retest of the nearest resistance could trigger a rebound and cause the price to fall further to the next zone of interest.
Best regards, R. Linda!

GOLD → Positive fundamental background. Focus on 4200 FX:XAUUSD is testing the $4,250 level amid news momentum related to interest rate cuts. The fundamental backdrop is improving, with the dollar entering a downward trend...
The Fed cut rates by 25 basis points to 3.75%, as expected. Powell's tone was cautious rather than hawkish, which weakened the dollar and Treasury yields. The market expects two rate cuts next year, compared to one in the Fed's forecasts
- Focus has shifted to US employment data (jobless claims). The next key risk will be next week's NFP data.
The Fed's decision provided support for gold, but for growth above $4250, confirmation of a weakening labor market in upcoming reports will be needed. Technically, the focus is on the 4200-4220 zone.
Resistance levels: 4220, 4250, 4260
Support levels: 4200, 4180, 4175
Consolidation above 4200 will confirm the bullish sentiment, while a breakout and consolidation above 4220 will open up a new chance for growth towards the resistance of the range.
I do not rule out the possibility of a retest the support of the range at 4181 before moving up (the price is still in a sideways trend).
Best regards, R. Linda!

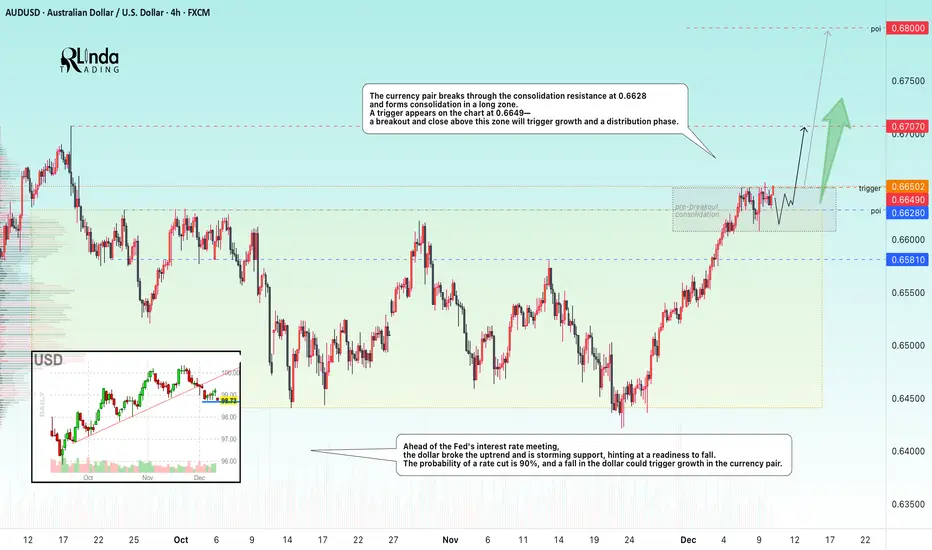
AUDUSD → Readiness for distribution within the uptrend FX:AUDUSD breaks through the resistance of a wide trading range (consolidation) and is preparing for growth. Important news ahead...
Ahead of the Fed's interest rate meeting, the dollar broke its upward trend and is storming support, hinting at a readiness to fall. The probability of a rate cut is 90%, and a fall in the dollar could trigger growth in the currency pair.
The currency pair is breaking through the consolidation resistance at 0.6628 and forming consolidation in a long zone. A trigger of 0.6649 appears on the chart - a breakout and close above this zone will trigger growth and a distribution phase.
Resistance levels: 0.6649, 0.67, 0.68
Support levels: 0.6628, 0.6581
Before rising, the price may test support (the previously broken trading range boundary). However, a breakout and close above 0.6649 could trigger a distribution phase towards 0.67-0.68, especially against the backdrop of a weak dollar...
Best regards, R. Linda!
Fed Just Opened the Door — USDJPY Could Bleed Hard!!Hey Traders, in today’s session we are monitoring USDJPY for a selling opportunity around the 156.300 zone. The pair continues to trade within a broader downtrend, and price is now retracing toward a key trend + S/R confluence at 156.300 — an area that has consistently acted as a supply zone for sellers.
Technical Structure
USDJPY remains in a bearish market structure (lower highs / lower lows).
Current pullback is approaching the 156.300 correction zone, where downside continuation becomes highly probable.
Dollar Macro Backdrop: Perfect Storm for USD Weakness
On the other side, DXY broke below its uptrend and is now pulling back toward the 98.800 retracement zone, confirming a broader shift in momentum.
The fundamentals are even more compelling:
1. The Fed did cut yesterday — 25bps.
This reinforces a clear dovish turn, and historically the USD underperforms aggressively in the weeks following the first cut of a new cycle.
2. The Fed's balance sheet is expanding again.
An expanding balance sheet = USD bearish liquidity environment.
3. The January FOMC is currently NOT priced for a cut — and that’s the opportunity.
The market is underpricing the risk of back-to-back cuts.
Now labor market data becomes the main catalyst.
And the reality is:
If we get any sign of further labor market weakness — which is increasingly likely — the market will start pricing in a January cut very fast.
And that leaves MUCH more room for USD weakness across the board.
Trade Focus
Monitoring price reaction at 156.300 for a bearish continuation setup.
If DXY resumes weakness out of 98.800 and labor data disappoints, USDJPY could accelerate aggressively to the downside.
Trade safe,
Joe.

GOLD → Consolidation ahead of the Fed's interest rate decision FX:XAUUSD is rebounding from resistance at the local range of 4220 and heading towards support at the liquidity zone of 4175. Ahead is the Fed meeting on interest rates, where rates are likely to be lowered. What to expect?
The probability of a 25 bp rate cut today is ≈90%. JOLTS job vacancy data reduced the chances of easing in January to ≈20%. Attention is shifting to the Fed's rate forecasts for 2026 and the tone of Powell's comments — the balance of votes in the FOMC (the ratio of “hawks” to “doves”) will determine the further course.
In the current case, it is worth looking not only at the fact of the rate cut, which is most likely already priced in. What is important to us are the regulator's comments and political stance. If they say that the pace of rate cuts will slow down in the future, the dollar may fly up and gold down.
If they support further rate cuts, the dollar will go down and gold up.
Resistance levels: 4220, 4266
Support levels: 4200, 4175, 4165
It would be a shock to the market if rates were cut by 50 points; the chances are slim, but they exist. In this case, gold would soar. However, the most likely scenario is described above.
Technically, I expect a retest of the trading range support; in the worst case, gold may fall to 4140 - 4120 - 4100 before rising. High volatility is possible in the evening!
Best regards, R. Linda!

BITCOIN → False breakout of resistance on a downtrend BINANCE:BTCUSDT is consolidating in the range of 86K - 92K, bears are holding resistance amid a global downtrend, traders lack drivers...
Fundamentally, sentiment in the crypto market is weak, and there is increasing talk of a crypto winter, especially among companies that previously actively bought cryptocurrencies for their balance sheets. There is no bullish driver at the moment.
Bitcoin is in a neutral state, with the market holding the price below 93K. The fundamental background is unstable, and technically, the market is in a downtrend. A reversal pattern is forming relative to 92K, and a retest and false breakout of the zone of interest could trigger a decline to the support range.
Locally, we are seeing an upward channel, but this is a correction against the backdrop of the global trend. If the bears keep the price below 92K, the decline may continue. However, a breakout of 94K and a close above that level could trigger an upward momentum...
Resistance levels: 91850, 92700, 93700
Support levels: 88000, 86300
A false breakout and price consolidation in the short zone could cause further sell-offs towards the areas of interest located at the bottom of the trading range.
Best regards, R. Linda!

GOLD → Price within range ahead of Fed meeting FX:XAUUSD is consolidating within a wide range amid expectations of the Fed's interest rate meeting. The fact that interest rates will be lowered has most likely already been factored in by the market. There is a possibility of a long squeeze...
New threats of tariffs by Trump (on fertilizers from Canada and against Mexico) are weakening the dollar and supporting gold.
As for interest rates, the Fed is expected to cut rates by 25 basis points, but the market has most likely already priced in the cut. Accordingly, there may be countertrend movements (MM traps) to accumulate liquidity before further advances.
Today's JOLTS data on job vacancies may cause increased volatility. According to statistics, before and after interest rate cuts, gold forms a swing correction, within which it may test the support of the range against the backdrop of a bullish trend...
Resistance levels: 4219.5, 4256
Support levels: 4200, 4180, 4163
Ahead is a strong liquidity zone at 4220, and the retest may end in a decline. MM may continue to accumulate liquidity before further advancement. I expect a retest of the range support with the aim of retesting the liquidity pool at 4175-4165 before a possible rise.
Best regards, R. Linda!

GOLD → Retest of upward trend support. Focus on 4200FX:XAUUSD is trading near $4,200, remaining cautious at the start of the week ahead of the Fed's decision. The trend is bullish, with the dollar stagnating. A long squeeze of support could trigger a rebound...
The Fed is expected to cut rates by 25 bps (probability ≈90%). Weak US data supports dovish expectations
Attention is shifting to the Fed meeting and its forecasts for 2026. The lack of important US data today shifts the focus to geopolitics and general market sentiment.
There is not much news this week, but from a geopolitical point of view, attention is focused on Japan-China and Russia-Ukraine-US relations.
Gold is awaiting signals from the Fed. The decision on rates and geopolitical news will determine the direction of the breakout from the current range.
Resistance levels: 4220, 4256
Support levels: 4200, 4195, 4180
The dollar previously broke through the support of the uptrend, but has been stagnating for the past few days. A break below 99.0 could trigger a decline in the index, which could support the price of gold.
Gold is testing the support of the trading range within the uptrend. Focus on the 4200-4195 zone. A long squeeze could trigger growth amid a weak dollar...
Best regards, R. Linda!

USDJPY → Attempt to return to the bullish trend from correctionFX:USDJPY may exit the correction phase and continue its upward movement within the trend. The global target has not yet been reached.
The dollar is consolidating after breaking the bullish trend structure. The market is trying to keep the price above 99.0. Growth and a retest of 99.5 are possible. This move may support the growth of the currency pair.
The correction may end. The main trend is bullish, and the market continues to follow the trend lines despite the weak dollar.
A breakout of the correction boundary and maintaining the price above 155.4 may trigger a distribution of 157.8.
Resistance levels: 155.4, 157.15
Support levels: 154.45
Local and global trends are bullish. The correction may end as the price continues to storm the resistance of the local bearish pattern. A breakout of 155.4 and consolidation above this zone may support further growth.
Best regards, R. Linda!

ADAUSDT → Correction (hunt for liquidity) before the fall BINANCE:ADAUSDT is pausing in the 0.41 area and entering a correction phase, during which it may test the zone of interest in a bearish market.
Bitcoin failed to overcome resistance at 92K, with economic data intensifying bearish pressure, resulting in another decline. The market is stagnant within the trading range, and any correction could quickly turn into a sharp decline...
ADA is forming a halt in the 0.41 zone and is entering a phase of local correction. The zone of interest is 0.426 - 0.434 (the area of local trend support breakdown). A retest of resistance may end in a false breakout...
Resistance levels: 0.421, 0.426, 0.434
Support levels: 0.409, 0.392
A false breakout of the resistance zone or a retest of the previously broken support of the uptrend may end in pressure from the bears. The correction may be followed by a continuation of the downtrend and the zone of 0.421 - 0.434
Best regards, R. Linda!

DOGEUSDT → Lack of bullish potential BINANCE:DOGEUSDT.P failed to break the trend. Under pressure from resistance and a global downtrend, the coin is reversing and may decline...
Bitcoin is pausing after a news rally based on rumors. The trend remains bearish. Pressure on the crypto market is present...
DOGE faced pressure in the 0.1477 - 0.155 zone. A rebound from 0.1533 is forming and the price is closing below 0.1477, forming a pre-breakout base of 0.1464. The reaction to support is weakening, confirming the weakness of the buyer. A close below 0.1464 could trigger a further decline within the range.
Resistance levels: 0.1477, 0.15337
Support levels: 0.1464, 0.1366
A breakdown of support, closing below the level, and consolidation in the short zone will once again confirm buyer weakness, which in turn may trigger a further decline.
Best regards, R. Linda!

GOLD → Consolidation above 4220. Bullish structureFX:XAUUSD is trading in a narrow range around $4,200, maintaining sideways momentum ahead of US inflation data. The market confirms a bullish structure...
The probability of a Fed rate cut in December remains at ≈90%.
Mixed US employment data:
– Jobless claims fell to their lowest level since September 2022.
– Layoffs in November reached a two-year high.
The key benchmark today is the PCE index for September (data delayed due to the government shutdown).
Gold is awaiting new signals on inflation. Range trading is likely until the release of PCE data, which may set the direction of movement ahead of the Fed's decision.
Resistance levels: 4238, 4262
Support levels: 4220, 4183
If the bulls hold their ground above local support at 4220, we will have a chance to break through 4238 and retest 4262. However, a breakout of the trading range resistance could trigger a continuation of the rally towards the ATH.
Best regards, R. Linda!

GOLD → Retest of consolidation support on uptrend FX:XAUUSD is trading in a sideways range around $4,200, awaiting new labor market data to determine the Fed's policy trajectory after December's rate cut.
Weak US data (a 32K decline in ADP employment and a slight increase in ISM services to 52.6) did not change market expectations. The probability of a 25 bp Fed rate cut on December 11 is around 90%. Attention has shifted to the trajectory of policy easing in early 2026. Key factors will be data on unemployment claims and sentiment on Wall Street.
The fundamental background is relatively positive, and the dollar has entered a correction phase due to expectations of lower rates, which may support the gold price...
Resistance levels: 4238, 4262
Support levels: 4185, 4175
Gold is testing the support levels of the key trading range. If the bulls keep the price above 4185 and form a bullish reversal pattern, then in the short and medium term, we can expect growth to intermediate highs.
Best regards, R. Linda!

ETHEREUM → The emergence of a positive driver?BINANCE:ETHUSDT is soaring amid a news rally and testing resistance at 3230. The daily increase was almost 20%. If growth is expected, then after a slight correction...
Fundamental background: the market reacted to rumors of the replacement of the Fed chairman with Kevin Hassett, who is more “dovish” and loyal to cryptocurrencies. The market broke the local structure and updated the interim maximum from 3070 to 3230. A false breakout of resistance is forming relative to the key resistance level, and the market is entering a correction/stagnation phase.
Bitcoin, the main driver of the cryptocurrency market, faced strong resistance at 95K. The global market trend is downward, and a change in trend will require time and more confirmation...
There is a struggle for resistance in the market, and several scenarios are possible: consolidation and a breakout of resistance, or growth after correction...
Resistance levels: 3230, 3370
Support levels: 3172 (local), 3057
High probability: a false breakout of 3230 will trigger a correction to 3050 (before the news). If the bulls keep the price above 3050, growth may continue as part of the change in the fundamental background.
BUT! If buyers keep the price without correction, then the focus will be on 3230. Consolidation above this level could trigger growth to 3370 - 3620.
Best regards, R. Linda!

GOLD → The battle for zone 4200. Bullish trend FX:XAUUSD is forming a local trading range of 4180-4230, trying to stay above 4200 after yesterday's correction ahead of important US employment and services data.
The dollar is weakening amid expectations of a Fed rate cut on December 11. News concerning Powell, namely Fed chair candidate Kevin Hassett (a well-known “dove”), is supporting gold. Geopolitical risks (stagnation in Russia-Ukraine negotiations) are increasing demand for safe-haven assets.
• In focus today: ADP employment data and ISM Services PMI.
• Weak indicators will strengthen bets on Fed policy easing and support gold.
Gold retains its upside potential. The release of US data could either accelerate growth to $4300 or trigger a correction in the event of strong indicators.
Resistance levels: 4230, 4260
Support levels: 4185, 4175
Gold is testing 4200 for strong support. Local trading range 4180 - 4230. A false breakout of support amid a bullish trend and a weak dollar could support gold's growth.
Best regards, R. Linda!

EURUSD → Consolidation above downtrend resistance FX:EURUSD is attempting to reverse the trend amid expectations of interest rate cuts in the US. Important resistance at 1.165...
The dollar is breaking the support of the bullish trend amid expectations of interest rate cuts and news related to Powell. A decline in the index will support the euro exchange rate.
EURUSD is breaking the resistance of the downtrend, followed by bulls trying to keep the currency pair above 1.160, a psychological level. Against the backdrop of the dollar's decline, there is a chance of a breakout above 1.165 and growth
Resistance levels: 1.165 - 1.1656
Support levels: 1.159, 1.155
Before breaking through resistance, the market may consolidate or retest support. However, a breakout of 1.165 - 1.1656 and a close above this zone could trigger a distribution towards 1.173 - 1.182
Best regards, R. Linda!

GOLD → Correction to support amid a bullish trend FX:XAUUSD retreated from the $4,245 level reached on Monday. A countertrend correction is forming ahead of the news. But buyers are not sleeping...
Weak US economic data has heightened expectations of an imminent Fed rate cut. The PMI index in the US manufacturing sector continued to contract. The market estimates the probability of the Fed easing policy next week at 87%.
However, rising US Treasury yields and fears that the Fed may send cautious signals after its December decision are limiting gold's growth.
Market attention is shifting to ADP employment data and the US services business activity index (ISM Services PMI), which will be released on Wednesday. They will provide new signals about the health of the US economy.
The correction in gold appears to be under control amid continuing macroeconomic uncertainty. The 4200, 4193-4173 level remains an important area of struggle between bulls and bears.
Resistance levels: 4211, 4245
Support levels: 4193, 4173
A false breakdown and the bulls holding the market above the above support zone could trigger growth within the trend.
Best regards, R. Linda!

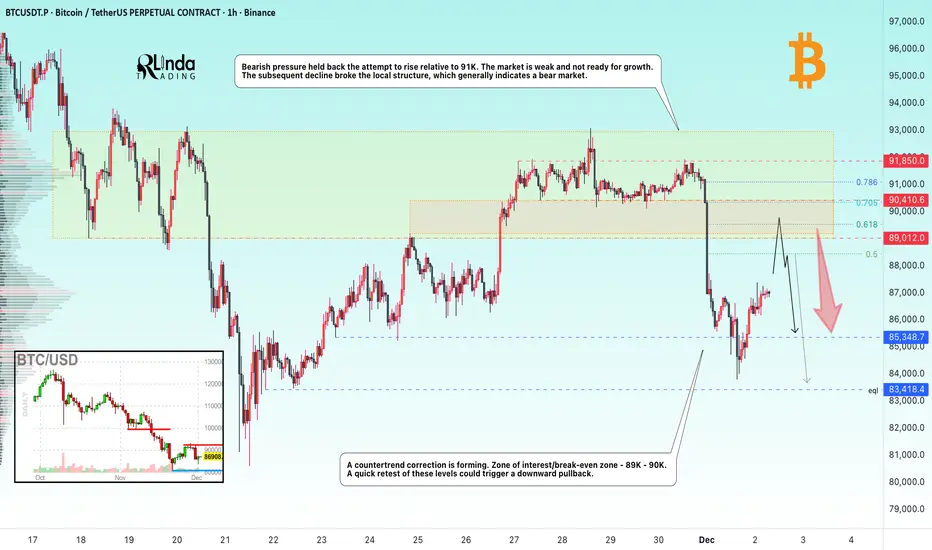
BITCOIN → The hunt for liquidity before the fallBINANCE:BTCUSDT.P continues to update lows within the global downtrend. The retest of 91K confirmed the dominance of bears...
The downtrend continues. The technical and fundamental situation for the crypto market is neutral to weak.
Bearish pressure held back the attempt to rise relative to 91K. The market is weak and not ready for growth. The subsequent decline broke the local structure, which generally indicates a bear market, but after updating the local minimum to 83700, a countertrend correction is forming. Zone of interest/break-even zone - 89K - 90K. A quick retest of these levels could trigger a downward pullback.
Resistance levels: 89K, 90K
Support levels: 85,400, 83,400
A retest of the range boundary and zone of interest could trigger a liquidity squeeze and a further decline if the bears keep the price below these boundaries.
Best regards, R. Linda!
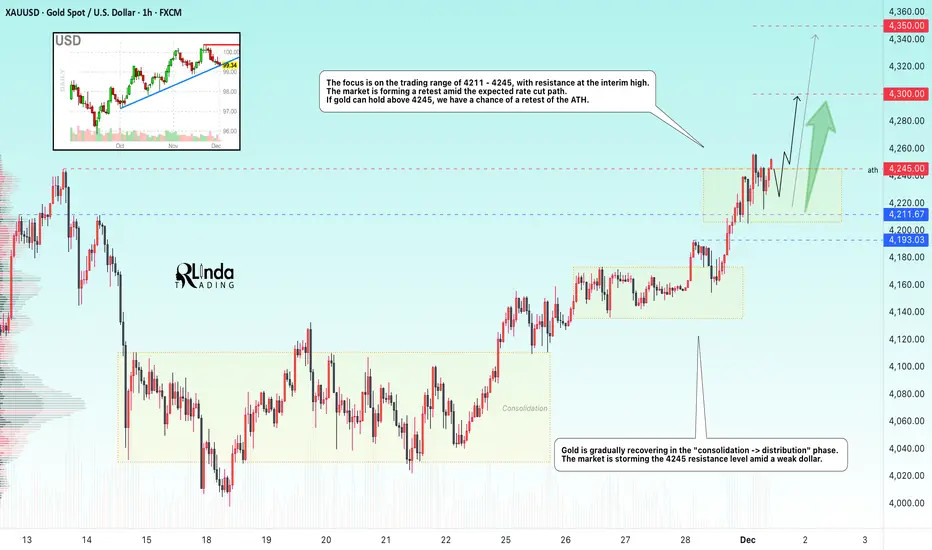
GOLD → The bullish trend continues. Retest of 4250FX:XAUUSD is trading at six-week highs near $4,250, supported by a weaker dollar and expectations of a Fed rate cut. The market is storming key resistance...
The probability of a December rate cut is 87%. The dollar is posting its worst week in four months after failing to consolidate above 100.0. A break in local trend support could trigger a decline in the index, which would support gold.
Today's focus is on the ISM Manufacturing PMI (forecast: 48.6). Weakness in the data could increase pressure on the dollar and support gold.
Gold maintains its upward trend, supported by loose monetary policy. Key data this week could boost momentum ahead of the Fed meeting.
Resistance levels: 4245, 4300
Support levels: 4211, 4193
A retest of 4245 could end with a pullback within the current consolidation at 4211 - 4245. Two scenarios: If the bulls hold the price above 4245, a rally to 4300 is expected. Otherwise, the market could retest 4215 - 4211 with the aim of a long squeeze before rallying. The trend is bullish, and the fundamental background is relatively positive.
Sincerely, R. Linda!
GBPUSD → Attempt to change the trendFX:GBPUSD is attempting a trend reversal. The likelihood of an interest rate cut is quite high, which could support the pound's rise.
The dollar is attacking the uptrend support level, failing to consolidate above 100.0. Ahead of the interest rate meeting, another rate cut could weaken the dollar, which in turn would support the pound sterling.
The currency pair is breaking downtrend resistance, and bulls are attempting to hold the price above 1.3191. A prolonged squeeze could shift the imbalance toward buyers, which in turn could trigger a rally.
Support levels: 1.3191, 1.3124
Resistance levels: 1.337, 1.353
The price has entered the trading range of 1.3191 - 1.3370. Consolidation is forming above key support, but the market may test this area of interest before continuing its rise at the European session's opening. A false breakdown and price holding above 1.3191 could support further growth.
Best regards, R. Linda!
