EURUSD 4H – Testing Major Holding Zone FX:EURUSD
Price has followed a clean descending channel, rejecting from the top resistance zone.
Current candles are reacting inside the yellow holding zone, which aligns with previous accumulation structure.
A potential W-formation could build here if bulls defend this level — otherwise, the next demand layer waits lower.
Market Overview
EURUSD has reached a critical zone after an extended bearish leg. Liquidity beneath equal lows has been swept, suggesting smart-money absorption before a possible reversal. If the market holds above the 1.15 region, buyers could step in for a corrective rally toward mid-channel levels. However, if the zone fails, price may dip toward the deeper support box before a larger bullish correction begins.
Key Scenarios
✅ Bullish Case 🚀 → 🎯 Target 1: 1.1620 | 🎯 Target 2: 1.1720 | 🎯 Target 3: 1.1860
❌ Bearish Case 📉 → 🎯 Target 1: 1.1490 | 🎯 Target 2: 1.1420 (deeper support zone)
Current Levels to Watch
Resistance 🔴: 1.1620 – 1.1720
Support 🟢: 1.1500 – 1.1420
⚠️ Disclaimer: This analysis is for educational purposes only. It is not financial advice.
Zone

BTCUSD 30-MIN – Watching Demand Box Reaction BITSTAMP:BTCUSD
🧭
Structure | Trend | Key Reaction Zones
BTC rejected the supply rejection zone and broke short-term structure to the downside.
Price tapped into the strong demand box, where liquidity below previous lows got swept.
Current structure shows a potential accumulation for a bullish reversal — or one more leg down to the deeper yellow strong support.
Market Overview
After multiple liquidity grabs on top, BTC dumped hard into the demand zone, fulfilling the downside liquidity objective. The market is now coiling around the demand base — an ideal zone for smart-money re-accumulation. If buyers confirm from here, a strong impulse toward 121.8 → 123.2 may unfold. However, a break below 120.0 opens the door toward the final accumulation zone near 119.0 – 118.8 before a new bullish leg forms.
Key Scenarios
✅ Bullish Case 🚀 → 🎯 Target 1: 121.8 🎯 Target 2: 123.2 🎯 Target 3: 125.7
❌ Bearish Case 📉 → 🎯 Target 1: 120.0 🎯 Target 2: 118.8 (final demand zone)
Current Levels to Watch
Resistance 🔴: 121.8 – 123.2
Support 🟢: 120.0 – 118.8
⚠️ Disclaimer: This analysis is for educational purposes only. It is not financial advice.

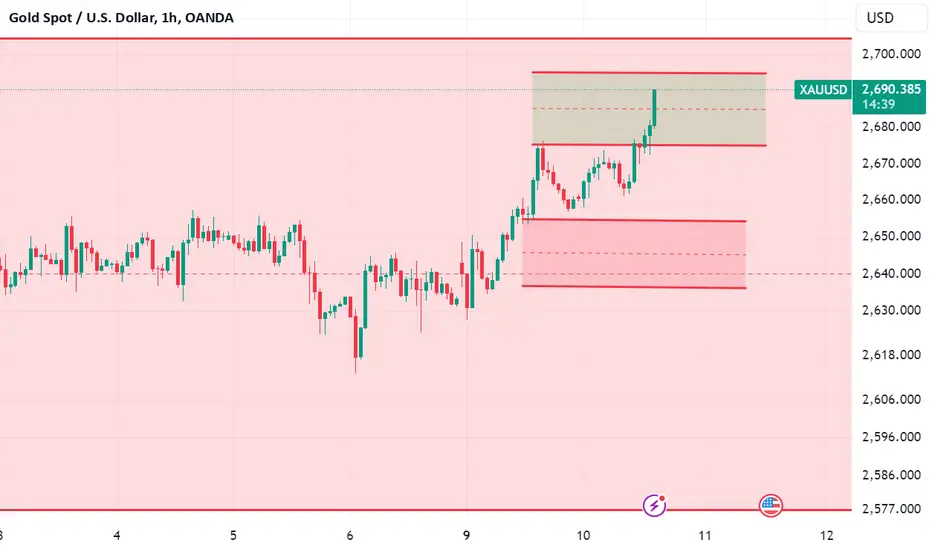
GOLD (XAUUSD) 30-MIN – Crucial Retest at Support ZoneTVC:GOLD
Market Overview
The market has tapped into a previous demand area after a deep correction from the top. Liquidity from both sides is cleared, leaving room for a clean directional move. If bulls manage to defend the current yellow zone, we could see a short-term recovery phase toward the mid-structure. However, a clean break below this block may lead to another sharp bearish leg into the lower OB near 3,910 — completing a full retracement before buyers return stronger.
Key Scenarios
✅ Bullish Case 🚀 → 🎯 Target 1: 3,989 mid-zone | 🎯 Target 2: 4,020 | 🎯 Target 3: 4,058 top rejection retest
❌ Bearish Case 📉 → 🎯 Target 1: 3,940 | 🎯 Target 2: 3,910 deeper OB zone
Current Levels to Watch
Resistance 🔴: 3,989 – 4,058
Support 🟢: 3,950 – 3,910
⚠️ Disclaimer: This analysis is for educational purposes only. It is not financial advice

ETHUSD 30-MIN – Holding Zone Reaction Ahead BITSTAMP:ETHUSD
Market Overview
After sweeping liquidity from the upper rejection zone, ETH experienced a controlled sell-off, reaching into the strong blue holding zone. The current structure shows early signs of absorption and a potential W-shaped reversal forming. If buyers defend this area, we could see a breakout toward the 4 535 and 4 672 reaction zones. Otherwise, failure to hold this block could drive price deeper toward the yellow demand base for the next bullish reload.
Key Scenarios
✅ Bullish Case 🚀 → 🎯 Target 1 : 4 435 | 🎯 Target 2 : 4 535 | 🎯 Target 3 : 4 672
❌ Bearish Case 📉 → 🎯 Target 1 : 4 250 | 🎯 Target 2 : 4 100 (deeper demand)
Current Levels to Watch
Resistance 🔴 : 4 435 – 4 672
Support 🟢 : 4 280 – 4 100
⚠️ Disclaimer: This analysis is for educational purposes only. It is not financial advice.

USDCAD 15M – Bearish Correction Setup 📉 OANDA:USDCAD
Structure | Trend | Key Reaction Zones
Price is respecting a descending trendline, rejecting multiple times near 1.3960–1.3965, showing exhaustion after minor pullbacks. The structure remains bearish with lower highs forming consistently.
Market Overview
USDCAD is currently consolidating below resistance, forming a corrective pattern within the descending structure. A clean break below 1.3949 would confirm downside momentum targeting the 1.3920–1.3930 demand zone, where strong buyers may appear for short-term reversals.
Key Scenarios
✅ Bearish Case 📉 → 🎯 Target 1: 1.3942 | 🎯 Target 2: 1.3920
❌ Bullish Case 🚀 → Break and close above 1.3965 could invalidate the setup and push toward 1.3971 resistance.
Current Levels to Watch
Resistance 🔴: 1.3965 – 1.3971
Support 🟢: 1.3942 – 1.3920
⚠️ Disclaimer: This analysis is for educational purposes only. Not financial advice.

GBPUSD 4H – Preparing for a Strong Reversal Move FX:GBPUSD
Market Overview
GBPUSD has been consolidating near a demand zone after repeated rejections from the upper descending trendline. Bulls may soon step in once liquidity below 1.3340 is grabbed. A confirmed break of the descending structure could open a clean upside push toward 1.3499 and 1.3666.
Key Scenarios
✅ Bullish Case 🚀 → Reversal from 1.3340 → 🎯 Target 1.3499 → 🎯 Target 1.3666
❌ Bearish Case 📉 → Break below 1.3300 → 🎯 Downside Target 1.3250
Current Levels to Watch
Resistance 🔴: 1.3499 / 1.3666
Support 🟢: 1.3340 / 1.3300
⚠️ Disclaimer: This analysis is for educational purposes only. Not financial advice.

SILVER (XAGUSD) – 15M | Strong Support Holding, Bullish ContinuTVC:SILVER
Market Overview
Silver took a quick rejection from the 48.70 resistance zone and corrected downward into the major support.
Price is now consolidating around 47.50, a key level that previously sparked bullish impulses.
If this level holds, momentum may shift again toward the upper range — signaling a potential bullish continuation phase.
Key Scenarios
✅ Bullish Case 🚀 →
🎯 Target 1: 47.80
🎯 Target 2: 48.23
🎯 Target 3: 48.70 (resistance retest)
❌ Bearish Case 📉 →
Invalidation if price closes below 47.30 (support breakdown).
Current Levels to Watch
Resistance 🔴: 48.23 / 48.70
Support 🟢: 47.40 / 47.50
⚠️ Disclaimer: This analysis is for educational purposes only. Not financial advice.

EURUSD – 1H | Rejection from Support Zone, Bullish Correction FX:EURUSD
Market Overview
EURUSD is currently reacting strongly from a well-defined demand/support base, following an extended downside leg.
The lower trendline and psychological support are holding firm, indicating potential for a corrective bullish leg towards the mid-range resistance zone if price sustains above 1.1650.
Key Scenarios
✅ Bullish Case 🚀 →
🎯 Target 1: 1.1683
🎯 Target 2: 1.1713
🎯 Target 3: 1.1778 (major rejection zone retest)
❌ Bearish Case 📉 →
Invalidation below 1.1640 (clean break under support).
Current Levels to Watch
Resistance 🔴: 1.1713 / 1.1778
Support 🟢: 1.1645 / 1.1660
⚠️ Disclaimer: This analysis is for educational purposes only. Not financial advice.

BTCUSD – 30M | Bullish Continuation Expected BITSTAMP:BTCUSD
Structure | Trend | Key Reaction Zones
Market recently tapped into strong demand zone (120,400–120,800) after a clean supply rejection.
Clear liquidity grab above highs followed by a deep correction to retest demand base — structure still bullish overall.
Market Overview
BTC has completed its corrective phase and is now reacting strongly from the demand box, suggesting potential continuation towards 123,000–125,000 if buyers sustain momentum. Price respecting the structure beautifully — accumulation signs visible again.
Key Scenarios
✅ Bullish Case 🚀 →
🎯 Target 1: 123,400
🎯 Target 2: 124,800
🎯 Target 3: 125,700 (supply zone retest)
❌ Bearish Case 📉 →
Invalidation below 120,000 (strong demand break).
Current Levels to Watch
Support 🟢: 120,400–120,800
Resistance 🔴: 123,400 / 125,700
⚠️ Disclaimer: This analysis is for educational purposes only. Not financial advice.

IMX ABOUT TO BREAK MAIN LEVEL ON WAY - UPDATE 27-09-2025📊IMX/USDT Update
IMX has successfully moved above the low time frame zone, showing early signs of strength.
Price is now approaching the main trend level (around 0.708 – 0.715). This is the critical zone where confirmation could trigger the next bigger move.
Key levels:
0.708 – 0.715 → main trend resistance. Breakout here would confirm strength.
0.654 → cycle support. As long as this level holds, the bullish structure remains valid.
0.969 – 1.00 → breakout target zone.
Upside scenario:
If IMX clears the main trend zone, probability increases for a breakout rally toward $0.95 – $1.00.
Downside risk:
If IMX fails to break the main trend and falls back below 0.708, sideways consolidation could continue, with 0.654 as the must-hold support.
📌 Summary
IMX is above the low time frame zone → momentum is improving.
Main trend breakout above 0.715 = increased probability of rally.
Target: $0.95 – $1.00 if breakout is confirmed.
Support: $0.654 remains the cycle base.

#GOLD #NEW_forcast #XAUUSD#XAUUSD pulled back hitting the 3790 resistance but continues to respect the upward trend line and channel structure.

EURUSD Technical Analysis & Trading Strategy 📊 EURUSD Technical Analysis & Trading Strategy | Week of Sept 6th, 2025
Asset: EURUSD CFD | Spot Price: 1.17208 (as of Sept 6th, 2025, 12:54 AM UTC+4) | Timeframe: Intraday & Swing
🎯 Executive Summary (TL;DR)
EURUSD is at a critical 🔄 juncture! Our multi-indicator analysis reveals a market in consolidation following a recent bearish impulse. Key 🎯 harmonic and Gann-based support converges near 1.16800. A break below could trigger a sell-off towards 1.1600, while a hold could spark a bullish correction towards 1.1800. This week is pivotal for direction! ⚔️
📈 Detailed Technical Breakdown
1. Chart Pattern & Theory Analysis
📉 Elliott Wave Theory: The price action from the August high suggests we are in a corrective wave (likely Wave 4 or a bearish Wave C). The structure is complex, indicating potential exhaustion of the current move.
🦀 Harmonic Patterns: A potential Bullish Bat Pattern 🦇 is completing near the 1.1680-1.1700 zone. This is a key PRZ (Potential Reversal Zone) with a high probability of a bullish reversal.
🧮 W.D. Gann Analysis: Applying the Square of 9 and Gann angles, the price is testing a vital support angle. A daily close below 1.1700 would be a strong bearish signal according to Gann time-price theory, opening the path downward.
⛰️ Head and Shoulders: A smaller, intraday Head and Shoulders pattern is forming on the 4H chart. A break below the neckline (approx. 1.1700) would confirm this bearish reversal pattern, projecting a target towards 1.1650.
⚖️ Wyckoff Theory: The chart shows signs of a re-distribution phase. We are watching for a Sign of Weakness (SOW) or a Spring (a false breakdown below support) that could indicate the next major move.
2. Key Support & Resistance Levels
🧱 Immediate Resistance: 1.17500 (Previous Support turned Resistance)
🎯 Strong Resistance: 1.18000 (Psychological Level & 50-Day EMA)
🛡️ Immediate Support: 1.17000 (Psychological & Pattern Confluence)
🎯 Strong Support: 1.16800 (Harmonic & Gann Confluence Zone)
🚨 Major Support: 1.16000 (Weekly Swing Low)
3. Indicator & Momentum Outlook
📶 RSI (14): Currently reading 42 on the 4H chart. This indicates a neutral-to-bearish bias with room to move lower before hitting oversold territory (<30).
📊 Bollinger Bands (20): Price is trading in the lower half of the bands, indicating bearish pressure. A squeeze is evident, suggesting a volatility expansion is imminent. A move towards the middle band (20-SMA) is likely on any bounce.
💹 Moving Averages: The 50-EMA (1.1790) and 200-EMA (1.1755) are both above the current price, confirming the short-term bearish trend. A ** bearish cross** (50-EMA crossing below 200-EMA) is not yet in play but is being watched closely.
🏢 VWAP (Volume Weighted Average Price): The price is trading below the daily VWAP, indicating that buyers from this period are at a loss—a bearish sentiment. The Anchored VWAP from the last high shows significant selling pressure.
⏰ Trading Strategy & Forecast
A) Intraday Trading (5M - 1H Charts) 🎯
🔻 Bearish Scenario (Breakdown): A break and close below 1.17000 could signal a short opportunity. Target: 1.16800 (initial), then 1.16500. Stop Loss: just above 1.17250.
🔺 Bullish Scenario (Bounce): A hold above 1.17000 with a bullish reversal candlestick (e.g., Hammer, Engulfing) could signal a long scalp. Target: 1.17500 (resistance). Stop Loss: below 1.16850.
B) Swing Trading (4H - Daily Charts) 📅
🔄 Outlook: The swing bias remains cautiously bearish until price reclaims the 1.1800 level.
Entry (Short) : A retest of 1.1750-1.1780 (failed resistance) could offer a high-probability short entry for a swing down towards 1.1600.
Entry (Long): Aggressive bulls could look for long entries near 1.1680 (harmonic/Gann support) with a tight stop below 1.1660, targeting a move back to 1.1800.
🧘 Risk Management: Always use a stop-loss. Risk no more than 1-2% of your account on any single trade.
🌍 Market Context & Final Thoughts
Globally, all eyes are on ECB vs. Fed policy divergence 🏦. Any hawkish remarks from the Fed or dovish tones from the ECB could fuel further USD strength, pressuring EURUSD lower. This technical setup aligns with a bearish fundamental backdrop.
Conclusion: The 1.1680-1.1700 zone is absolutely critical. 🚨 A break below likely triggers the next leg down. A strong bounce from here could lead to a larger corrective rally. Trade the breakout/breakdown with the confluence of patterns and indicators.
✅ Trade Safe! Remember to always manage your risk.

BTC Analysis 1H - Key Triggers Ahead | Day 32💀 Hey , how's it going ? Come over here — Satoshi got something for you !
⏰ We’re analyzing BTC on the 1-hour timeframe timeframe .
👀 On the 1H timeframe of Bitcoin, we can see that after yesterday’s news BTC moved upward but got rejected at the $112,300 zone. It then found support at the bottom of its ascending channel. Bitcoin is now waiting for tomorrow’s NFP release. The key level that price reacted to is $112,300 — a breakout above this zone could trigger another move to the upside. The current support is around $110,340, and if this level breaks, the next major support lies near $107,500.
⚙️ RSI key zones are at 36 and 70. If momentum breaks through these areas, Bitcoin could start a stronger move.
🕯 The size and volume of the recent red candles indicate selling pressure. However, when price bounced from the channel bottom, the bearish momentum weakened. If selling pressure increases and the support is lost, red candles may grow even larger.
📊 Looking at the 1H Tether dominance (USDT.D), after the recent drop it shows signs of a rebound and is completing its pullback on this timeframe. The key zones to watch are 4.39% and 4.47%. A breakout above these levels could bring significant trading volume into Bitcoin.
🔔 Alert zones for Bitcoin are set at $110,340 and $112,334. A breakout of either zone could provide us with trade opportunities. Keep in mind that the current structure is ranging and compressed, so it’s better to trade with lower risk.
❤️ Disclaimer : This analysis is purely based on my personal opinion and I only trade if the stated triggers are activated .

112K THE POWER RETURN OR THE END OF CYCLE? - BTC now still GREENBTC is currently at a critical point. From a cycle perspective, we are at the bottom of the cycle—a zone where major whales can decide whether to continue the cycle or bring it to an end.
When BTC just slips below 112K it does not directly end the cycle; it need also provides time frame confirmation of at least 4H+ There is high chance BTC can return from 112k zone.
If BTC holds its levels and rises above 112K with confirmation, we could the strong cycle.
If BTC breaks down further below 12K–10K, it would signal the end of the cycle that started around 84K.
At this moment BTC is still long for the cycle
Momentframe by 112K /110K = END CYCLE
Low time frame BTC = RED
High frame time BTC = RED
Cycle frame time BTC = GREEN

The Nature of Zones — Reversals, Continuations, and the FlowWe’ve all heard trading terms like Major Trend and Major Counter-Trend levels. These are zones where price either breaks through and continues (Trend Levels) or sharply reverses (Counter-Trend Levels). In the crypto world, these levels are often separated by enormous gaps, due to the nature of the space — as I’ve mentioned in a previous idea: Crypto Charts Whisper—Are You Listening?
Let’s get one thing clear from the start. These levels are not just thin lines that traders casually draw across a chart. They are zones. So, as a skilled trader, anytime someone mentions support or resistance, keep in mind: interact with these as zones, not levels.
Why? The answer lies in the nature of the candlestick itself. Most support and resistance areas — 99% of the time — are defined by candlesticks such as inverted hammers, shooting stars, etc. For instance, in an uptrend near its peak, you’ll often spot an inverted hammer with a rejection wick that’s at least 25–50% of the candle’s body. The longer the wick, the stronger the rejection. In that sense, the high and the close of that candle form the zone. And what better tool to use for this than the rectangle?
Now, to slowly return to our main point — many of you might’ve noticed that zones often change their nature, especially resistance zones. If you’re experienced, you already know: price tends to go higher by nature. So when a counter-trend zone gets broken and price pushes above it, it shifts — it becomes a trend zone. Later, if price retests it from above, it often turns into support, and with another reversal, it can shift again — becoming a counter-trend zone once more.
But my point goes deeper than what you’ll hear in lessons or YouTube videos. Like I said in another post — A Follow-up to “Adjustments for Better Readings & VSA vs BTC” — if it’s already out there, it’s probably old news.
A skilled trader keeps an open mind — merging everything into one system. And it's part of this oneness mindset that elite traders follow, which I want to share now.
So I ask you:
What if the idea of trend and counter-trend zones didn’t just apply to major levels?
What if this concept applied everywhere on the chart?
For me, this isn’t just a question anymore — it’s a fact. A fact that made me a better trader. I won’t lie — before I got good at this, I failed over and over. But I never quit. That’s not the point though. The point is to expand your vision and train yourself to react just like the elite do.
Take double or triple tops/bottoms — standard or rounded. These formations also act exactly like trend and counter-trend zones. And they stay relevant well into the future. Every level is tested at least twice, from both directions. Maybe not immediately, but eventually — across multiple time frames.
And just like that, a level becomes a major zone for future use — especially if you trade across multiple time frames. So be careful: if you’re only looking at the 1-hour chart, you might miss something important that’s playing out on the 3-minute. And that can trigger psychological discomfort... leading to FOMO — and all the mistakes that come with it.
Also remember — double and triple tops/bottoms are zones, not exact lines. Many traders lose trades by a single tick, just because they forget that rule.
Let’s go a bit deeper now.
Think about all the small highs and lows that appear between those tops and bottoms on a 3-minute chart.
How can they help you trade better? The answer goes back to my previous idea: Location, Location, Location — Consistency and Alignment.
I get it — staying observant 24/7 is hard. That’s why institutions and big players work in teams, in shifts. They’re never alone. You shouldn’t be either.
There’s a lot more that could be said about these levels and zones — how they reveal future trend behavior, a flow! even without indicators or VSA. It has to do with how specific highs and lows behave at certain points in time... but let’s leave that for now.
For the outro, remember this:
The real edge isn’t in indicators.
It’s in your ability to catch the flow of price,
And to read strength or weakness through the simple structures within the zones Big Players create — whether visible or hidden.
A chart isn’t a single truth.
It’s a battlefield of conflicting zones and mixed signals.
If this mindset resonates with you and you want to go deeper — whether it’s building confidence or spotting hidden signals early — I work with a small circle of traders, sharing TA privately every day. Feel free to reach out.
Until next time, be well and trade wisely.
EGX30 Neutral Zone AnalysisEGX30 stock is currently in a neutral zone, between the 31,970 resistance line and 31,424.07 support line, reflecting the buyers' and sellers' wait and taking their time for market analysis, especially with the investment atmosphere that is full of unaligned points of view. In case of taking an upward trend, it is expected not to breach the resistance line at 32,464.493 points, but in case of falling, it's expected not to break the support line at 29,989.245.

GBPUSD Week 19 Swing Zone/LevelsHope y'all had a good weekend with your profits.
This week we go into a slight variation of our winning strategy and ask the question:
what if Retracement is not fixed at the Fib levels but dynamic?
And so whilst keeping the zone and primary values of 279/721, we mark 2 levels and the predicted price reaction around them.
As Always price action determines trades

EURUSD - Macro ViewHello TradingView Family / Fellow Traders. This is Richard, also known as theSignalyst.
📈From a macro perspective, EURUSD has been bearish trading within the falling red channel.
Medium-term, EURUSD has been in a correction phase trading within the rising channel in orange.
Moreover, the green zone is a massive monthly resistance.
🏹 Thus, the highlighted red circle is a strong area to look for sell setups as it is the intersection of the upper red and orange trendlines and resistance.
📚 As per my trading style:
As #EURUSD approaches the red circle zone, I will be looking for bearish reversal setups (like a double top pattern, trendline break , and so on...)
📚 Always follow your trading plan regarding entry, risk management, and trade management.
Good luck!
All Strategies Are Good; If Managed Properly!
~Rich
Disclosure: I am part of Trade Nation's Influencer program and receive a monthly fee for using their TradingView charts in my analysis.

AUDUSD Tap Reading/ Trading Math Analysis Reversal Predictions BDear Trader,
Please find attached my analysis of $Subject, which uses mathematical calculations to identify potential reversal times and price levels.
The analysis details projected south and north price targets (horizontal lines on the chart), along with estimated time frames for possible reversals (vertical lines on the chart, accurate to within +/- 1-2 candles). Please note that all times indicated on the chart, including the vertical lines representing potential reversal times, are based on the UTC+4 time zone.
To increase the probability of these analysis, I recommend monitoring the 5-minute and 15-minute charts for the following key reversal candlestick patterns:
Doji’s
Hammer/Inverted Hammer
Double/Triple Bottom/Top
Shooting Star
Morning Star
Hanging Man
I welcome your feedback on this analysis, as it will inform and enhance my future research.
3rd Apr12:05 PM
3rd Apr 4:30 PM
3rd APr 6:10 PM
3rd APr 6:30 PM
3rd Apr 10:25PM
4th Apr 2:10 AM to 2:30 AM
4th 4:30 AM to 5:35 AM
4th 10:30 AM
Regards,
Shunya Trade
⚠️ Disclaimer: This post is educational content and does not constitute investment advice, financial advice, or trading recommendations. The views expressed here are based on technical analysis and are shared solely for informational purposes. The stock market is subject to risks, including capital loss, and readers should exercise due diligence before investing. We do not take responsibility for decisions made based on this content. Consult a certified financial advisor for personalized guidance.

ROSE in Key Accumulation Zone: Reversal on the HorizonLSE:ROSE is trading within a key Accumulation Zone around $0.04, overlapping with a strong demand area that has historically triggered price recoveries.
> $0.035–$0.045 remains a critical demand zone, attracting buyers.
> A bounce from this zone could target resistance levels of $0.07–$0.08.
> RSI is near oversold conditions, hinting at weakening selling pressure.
If ROSE holds above this support, a bullish reversal is likely. A breakdown below could lead to further downside.
DYOR, NFA

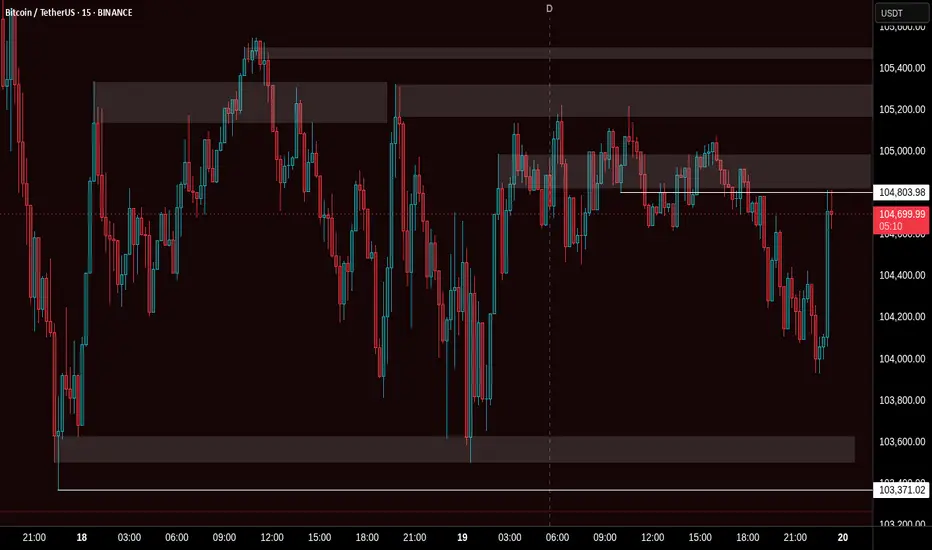
BTCUSDT Fresh Short Setup: Targeting Key Support Zones with SMC Description:
This trade setup presents a Bitcoin short opportunity on the 4H timeframe using the Smart Money Concepts (SMC) framework. After a significant reaction from the supply zone, Bitcoin's price structure aligns with bearish confluences, signaling potential downside. Additionally, external events, such as the recent announcement of China's AI application "DeepSeek," may have amplified market volatility, further supporting the setup.
Trade Setup:
Entry:
Between 103,300 and 104,500
Take-Profit Levels (TP):
101,897
99,825
97,565
95,208
Stop Loss (SL):
Above 105,975
Analysis and Confluences:
Market Structure:
Bitcoin remains in a bearish trend on the 4H timeframe, with consistent lower highs and lower lows.
Supply Zone:
The price is entering the 103.3k–104.5k supply zone, a key resistance area where sellers are expected to dominate.
Fibonacci Confluence:
This zone overlaps with the 0.618–0.786 Fibonacci retracement levels, a high-probability reversal area.
Liquidity Sweeps:
Liquidity above previous highs has been swept, leaving the path clear for potential downside.
Bearish Targets:
The targets align with previous demand zones and liquidity pools at 101,897, 99,825, 97,565, and 95,208.
Trade Plan:
Confirmation: Wait for bearish price action signals or smaller timeframe BOS (Break of Structure) within the supply zone before entering.
Risk Management: Adjust position size to keep risk within acceptable levels. After reaching TP1, move your stop loss to breakeven and secure partial profits.
Final Note: While bearish bias dominates, unexpected macroeconomic events can cause reversals, so use tight risk management.

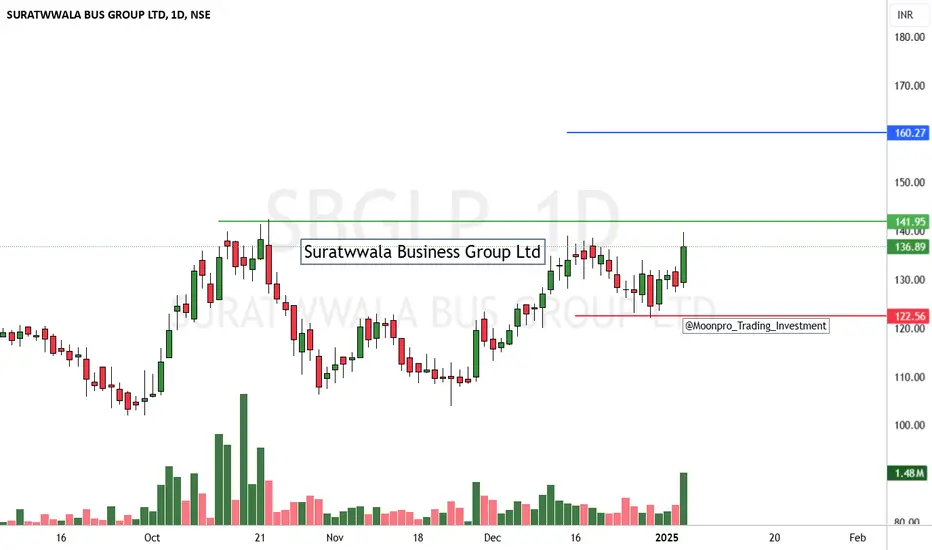
Suratwwala Business Group LtdSuratwwala Business Group Ltd
After the cup, the stock price drifts slightly downward in a consolidation phase (the handle), before breaking out to the upside
stock's price may continue to move in that direction
#XAUUSD STILL IN VAILD ZONE The XAUUSD long zone remains valid as the price holds above a key support level, indicating strong bullish potential. Traders are advised to monitor the price action closely for confirmation signals, ensuring a confident entry into the market for the next potential upward move.