CADJPY - Wait For The Trigger!Hello Kucoin Family / Fellow Traders. This is Richard, as known as theSignalyst.
on DAILY: Left Chart
CADJPY is approaching a supply zone so we will be looking for sell setups.
Knowing that CADJPY can still trade higher till the previous major high.
That's why we don't sell blindly, we always zoom in to lower timeframes and look for the bears to take over.
on H1: Right Chart
CADJPY is forming a wedge pattern in red but the lower trendline is not valid yet.
So we will be waiting for a third swing to form around it to consider it our trigger swing.
Trigger => waiting for that third swing to form and then sell after a momentum candle close below the gray zone.
Meanwhile, until the sell is activated, CADJPY can still trade higher.
Which scenario do you think is more probable and why?
Always follow your trading plan regarding entry, risk management, and trade management.
Good luck!
All Strategies Are Good; If Managed Properly!
~Rich
Zone

EURUSD sell zone Yesterday, we said that the pullback has already started
Today, we will see when is it going to end and the potential sell zone.
What we want to see today is another push higher to 1,0027-1,0101.
Once we see price around those levels, we want to watch out for possible exhaustion in price and that will give us a signal for potential short positions.
Targets will be below 0,9900. Once we see that reversal to the downside, we then will be able to determine specific tp levels.

GBPUSD long, if make double bottomyou can long to this price,if make double bottom.
waiting and relax to make double bottom,then you are going to long position.

Bitcoin close to a crucial long term support zoneBitcoin price hitting a 7 year long daily support zone. I don't see a single day candle closed below it. Maybe this time we break under it and break the trend, or bounce from here and keep the trend.

Long scalp for today at supply zone August-16-2022This is a low risk scalp long opportunity for quick scalpers. Stop loss shall be below green zone area and take profit 1 and 2 shall be at red zonee or 2:1 reward to risk ratio.
Disclaimer: Not a financial advice. Trade responsibly.

Long scalp for today at supply zone August-16-2022This is a low risk scalp long opportunity for quick scalpers. Stop loss shall be below green zone area and take profit 1 and 2 shall be at red zonee or 2:1 reward to risk ratio.
Disclaimer: Not a financial advice. Trade responsibly.

ROSE growth according to the price actionAccording to our setup,ROSE is prone to grow up to the specified area
RLong

CHFJPY - Video Top-Down Analysis!Hello TradingView Family / Fellow Traders. This is Richard, as known as theSignalyst.
Here is a detailed update top-down analysis for CHFJPY.
Which scenario do you think is more likely to happen? and Why?
Always follow your trading plan regarding entry, risk management, and trade management.
Good Luck!.
All Strategies Are Good; If Managed Properly!
~Rich

XRP at the top of the support zone!Hello, we are reviewing the XRP to USDT chart on a 1 day time frame looking at the long term.
It is worth designating two channels, the yellow lines for the uptrend channel and the blue lines for the downtrend channel in which we are currently. A price behavior that moves from the bottom to the top of the channel can be used for short-term licks.
It is worth noting that we are currently in the lower part of the channel and in the support zone. Looking at the price of XRP in the long term, it is worth setting two resistance zones that we must overcome in the future, the first is from $ 0.682 to $ 0.947, while the second is from $ 1.33 to $ 1.62.
Let us pay attention to the CHOP indicator which indicates that on the 1-day interval we are starting to regain energy, and the MACD indicator shows that the blue line has crossed the red one from the bottom, which confirms the local upward trend.

ETH collects a lot of energy on a 1-day intervalHello everyone, let's take a look at the ETH to USDT 1 day chart as we can see price movements in the upward channel denoted by the yellow lines.
It is worth designating two support zones that the price has in the event of a correction, and as you can see, the first zone is $ 1,570 to $ 1,442, but if the next zone is broken, the next zone is $ 1,224 to $ 1,070.
Now let's move on to the resistance that ETH has in front of it. In this case, we can also designate two zones, the first of which is in the range from $ 1,913 to $ 2,235, while the second is in the range of $ 2,564 - $ 3,012.
Note the CHOP indicator, which shows that we still have a lot of energy for the next price move in the 1-day range, and the MACD indicator shows that we are in a local downtrend.

BTCUSD H&S descending triangleBTCUSD formed a H&S pattern and has flowed into a downtrend as expected. This trend has created a descending triangle pattern. Now it has reached the support zone which will be tested. The breaking or respecting of this point will determine the course of action to follow.

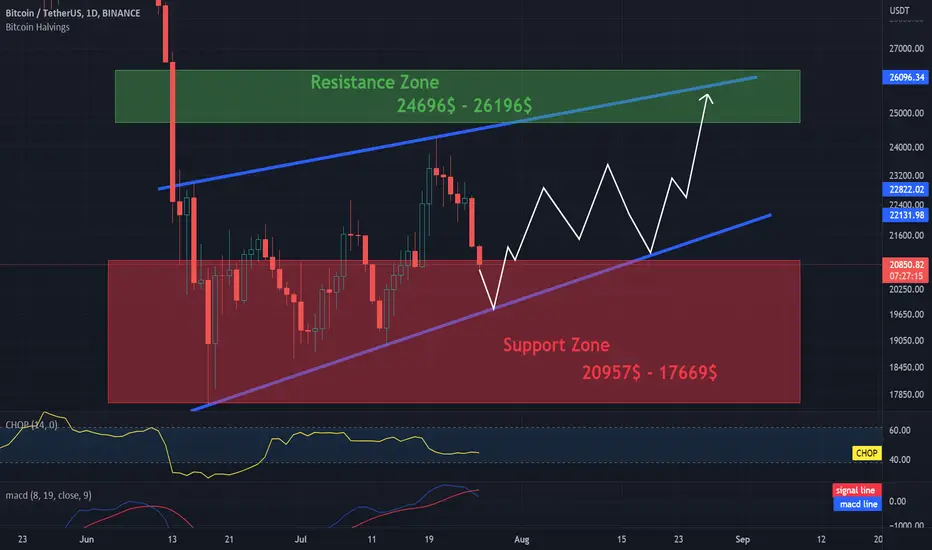
BTC is moving in the channel. Two important zones!Hi everyone.
Today we have marked the channel with blue lines in which the BTC price is currently moving.
Then, with the help of the white arrow, I tried to set the course route for the next few days on which the BTC price may move.
As you can see, we have two important zones:
-the first of them is the support zone which is from $ 20,957 to $ 17,669, if the price drops below the designated zone, we can expect further drops to around $ 12,000.
- the second is the resistance zone, which we have from $ 24,696 to $ 26,196 breaking out of this zone may result in further increases above $ 30,000
Currently, the price is moving nicely sideways on our channel, going down to the top of the channel, which can be potentially used for short-term licks.
It is also worth paying attention to the CHOP indicator, which indicates that energy is slowly running out, and the MACD indicator, which indicates that we have entered a local downward trend.
However, please remember that this is not an investment advice.
GBPJPY UPDATEmulti timeframe price action analysis on GBPJPY, many opportunities lining up to get in some longs on GJ this week.

CADJPY - Potential Bearish Reversal!Hello TradingView Family / Fellow Traders. This is Richard, as known as theSignalyst.
CADJPY is approaching a supply zone in red so we will be looking for sell setups on lower timeframes.
on H1: CADJPY is forming a channel in red but the lower trendline is not valid yet. So we will be waiting for a third swing to form around it to consider it our trigger swing. (projection in purple)
Trigger => Waiting for that third swing low to form then sell after a momentum candle close below it. (gray area)
Meanwhile, until the sell is activated, CADJPY can still trade higher.
Always follow your trading plan regarding entry, risk management, and trade management.
Good luck!
All Strategies Are Good; If Managed Properly!
~Rich

GALAUSDT is going to retest the demand zoneThe price bounced on daily demand zone on 0.05$ and now the price is creating equal lows above it.
The price could reset the demand zone in order to grab new liquidity to reverse the main trade
how to approach it?
The price needs to grab new liquidity and create a breakout from the dynamic and static resistance.
IF the price is going to have a breakout, According to Plancton's strategy , we can set a nice order
–––––
Keep in mind.
🟣 Purple structure -> Monthly structure.
🔴 Red structure -> Weekly structure.
🔵 Blue structure -> Daily structure.
🟡 Yellow structure -> 4h structure.
–––––
Follow the Shrimp 🦐

GBPUSD Short! Trend is Bearish regarding daily analysis.
There is a broken zone around 1.2437
The zone was broken by an engulf which leads to a base and a DBD!
The first shorting chance was around 16th of Jun.
A new SR has been formed there
A minor SR could be find a little lower of around 1.2342 Markets may fill the stop hunt of it.
We see a compression in the bullish move and the zone may work again.
There might be some long option at the green zone nut enter them after a confirmation.
For having a risk managing strategy you need a evaluation of win% and average TP-to-SL, so trade regarding your own knowledge and experience so you can manage your experience and knowledge and use this post like an educational reference !

GBPJPYGBPJPY Asian session trade 3 Confluences from Zone/Resistance, Price Action,Timing.
First target 1:3 Risk to Reward next 1:6

ETC buy zone is hereThis idea is crafted with a bullish mid term mindset, trading spot / 2x leverage with DCA implementation.
I am entirely aware if BTC breaks below 40k, it is likely that alts will be unpredictable. I am not considering this scenario in this idea.
ETC has been consolidating for about 210 days from its 183 ATH in may 2021.
My idea is that these levels marked 1, and 2 on the chart are a good place to accumulate based off BTC showing strength pushing 51k today.
Indicator wise, we have been reaching rock bottom RSI levels and deep momentum waves marked as blue boxes, both today and September 2020 have levels this deep.
You can see this was a relatively safe buy zone as ETC rose 3600% in the coming 200 days.
I have also marked an ABC structure coupled with a FIB from the top of the A wave and bottom of the B wave.
This would give an approximate secure profit level at somewhere around 170-260 USD.
It's entirely possible to retouch level 2 at around $17 if we saw BTC drop to 42k before pushing further upwards.

Major trend change, or fractal like movement?Seems to me were at a turning point. S/L @ $18,500. This would be a likely Wave C completion point imo.

USDCAD - My Trading Plan in a pictureHello TradingView Family / Fellow Traders. This is Richard, as known as theSignalyst.
USDCAD is overall bullish trading inside the brown channel.
As per my trading style/plan;
Here are the two strong zones where I will be looking for high probability buy setups:
I call them War Zones, (highlighted in Purple circles)
Zone 1: (around 1.305)
This highlighted purple circle is a strong area to look for sell setups as it is the intersection of the green supply and upper brown trendline. (acting as non-horizontal resistance)
Zone 2: (around 1.25)
This highlighted purple circle is a strong area to look for buy setups as it is the intersection of the blue support and lower brown trendline. (acting as non-horizontal support)
As per my trading style:
As USDCAD approaches one of the purple circles, I will be looking for reversal setups (like a double bottom /top pattern, trendline break , and so on...)
Always follow your trading plan regarding entry, risk management, and trade management.
Good luck!
All Strategies Are Good; If Managed Properly!
~Rich

OGNUSDT wants the demand zone on 0.15$The price bounced on the daily support on 0.1835 and now the price is testing the dynamic 4h resistance.
The price got the liquidity from the 4h resistance and now wants to retest the demand zone on 0.15$
How to approach it?
IF the price is going to lose the daily support, According to Plancton's strategy , we can set a nice order
–––––
Keep in mind.
🟣 Purple structure -> Monthly structure.
🔴 Red structure -> Weekly structure.
🔵 Blue structure -> Daily structure.
🟡 Yellow structure -> 4h structure.
–––––
Follow the Shrimp 🦐


GRTUSDT is in Demand ZoneThe price is testing the demand zone on 0.14$ and the market is getting new liquidity from this area.
The price is creating a tringle as well.
How to approach it?
the price needs to create a new Higher high above the 4h resistance. IF the price is going to have a breakout, According to Plancton's strategy , we can set a nice order
–––––
Keep in mind.
🟣 Purple structure -> Monthly structure.
🔴 Red structure -> Weekly structure.
🔵 Blue structure -> Daily structure.
🟡 Yellow structure -> 4h structure.
–––––
Follow the Shrimp 🦐
