USDJPY short term LONGUJ is at good S/R zone, although market is kinda crazy right now and dollar is having a rough time, thats why i will risk only 0.5% here cuz i like the setup but its riskier than usual.
⚠️ Disclaimer ⚠️
🛑The ideas I post here are just my vision of the market and not a signal, financial advice or something.
👁️Unfortunately I don't have enough time in front of the the computer to update or post every idea or trade management I do.
Zones

EURAUD LONGBeautiful zone by EURAUD and I'm long from this level here, it miiight go a little lower, but i think i have covered the zone with this SL 😉
⚠️ Disclaimer ⚠️
🛑The ideas I post here are just my vision of the market and not a signal, financial advice or something.
👁️Unfortunately I don't have enough time in front of the the computer to update or post every idea or trade management I do.

GBPNZD BUY GN is so close to a very respected zone of S/R, so I'm buying whenever price gets to my entry level.
⚠️ Disclaimer ⚠️
🛑The ideas I post here are just my vision of the market and not a signal, financial advice or something.
👁️Unfortunately I don't have enough time in front of the the computer to update or post every idea or trade management I do.

AUDUSD shortAUDUSD is very close to a major major zone of S/R that has not been broken pas ~3 years and last time it has been visited is Oct.2024 so I'm most definitely selling when she reach the entry.
⚠️ Disclaimer ⚠️
🛑The ideas I post here are just my vision of the market and not a signal, financial advice or something.
👁️Unfortunately I don't have enough time in front of the the computer to update or post every idea or trade management I do.

EURNZD LONGEN is at beautiful tight 4H S/R zone and I bought from here.
SL is put at next support level so if price goes to there and stops me, I will enter again in a buy position. TP is align with the 1H zones above.

How to Use the Pivot Zones Indicator by StewdamusA brief walk-through on how I use my AI crafted "Pivot Zones" indicator to trade. I will be sampling Google on the daily here with the chart replay.

NZDJPY SHORTSame as AUDJPY, NJ is approaching major zone, you can put pending sell at this level as its not required to wait for confirmation for best entry point and tight SL and TP.

1:11 Trade idea;Nasdaq
A good zone for big trades
Its an instituional level, a lot of agressive buyers

GBPCHF: The Fake Breakout Tale
This is the daily chart!
It is broken below a main level!
but it might be fake!
Most of the CHF start to change their direction after reaching this level.
GBPCHF will by a great probability.
And this is the chart of latest 3M! a bearish channel is obvious here!
Fluctuations are considerable for this pair!
Two Scenarios are clear in it!
We might break the yellow up,
Or we might react to the green

GBPUSD – Breakout Above Supply | Retest & Pullback ScenarioFX:GBPUSD
📈
Structure | Trend | Key Reaction Zones
Price has broken above the key supply zone (1.3360 – 1.3380) with strong bullish momentum.
Structure shows a potential retest scenario, where the market may revisit broken resistance for confirmation before further continuation.
The next major resistance lies near 1.3425 – 1.3460, while supports rest at 1.3380 and 1.3330.
Market Overview
GBPUSD has been consolidating under a descending trendline for several sessions. The clean breakout above the yellow supply zone signals renewed bullish strength.
However, liquidity above recent highs has been tapped, suggesting the market may temporarily correct before continuing its upward trend.
A confirmed retest around 1.3380 would offer fresh long opportunities toward the upper highs.
Key Scenarios
✅ Bullish Case 🚀 → 🎯 Target 1 1.3420 | 🎯 Target 2 1.3460 | 🎯 Target 3 1.3500
❌ Bearish Case 📉 → If price breaks below 1.3330, deeper correction toward 1.3280 (pink zone) is possible
Current Levels to Watch
Resistance 🔴 1.3420 – 1.3460
Support 🟢 1.3380 – 1.3330
⚠️ Disclaimer: This analysis is for educational purposes only. Not financial advice

USDJPY – Demand Zone Retest | Bullish Reversal ExpectedFX:USDJPY
🟢
Structure | Trend | Key Reaction Zones
Price is testing the yellow demand zone (150.700 – 150.400), which aligns perfectly with the ascending channel’s lower boundary.
Structure remains bullish overall — the market is simply correcting after hitting upper-trend resistance.
A strong rejection from this demand area could initiate the next impulse leg toward the 152.600–153.300 zone.
Market Overview
USDJPY has been moving within a large ascending channel structure. After a sustained rally, price began to retrace, retesting the key demand zone that acted as a previous breakout base.
Buyers are expected to defend this region for continuation higher, targeting upper-channel liquidity zones and major resistance levels.
Confirmation will come from bullish engulfing or breakout candles off the yellow zone.
Key Scenarios
✅ Bullish Case 🚀 → 🎯 Target 1 152.050 | 🎯 Target 2 152.600 | 🎯 Target 3 153.300
❌ Bearish Case 📉 → Close below 150.400 may extend downside toward 149.500 support
Current Levels to Watch
Resistance 🔴 152.050 – 152.600
Support 🟢 150.700 – 150.400
⚠️ Disclaimer: This analysis is for educational purposes only. Not financial advice.

GOLD (1H) – Bullish Continuation SetupTVC:GOLD
🚀
Structure | Trend | Key Reaction Zones
Price has perfectly respected previous demand zones and formed higher highs & higher lows 🔼
After reaccumulation near 4100–4120, momentum remains bullish with a clean structure breakout.
Current move is building pressure toward the Top Rejection Zone (4178–4185) where next liquidity lies.
Market Overview
Gold continues to trade within a strong bullish environment. The recent demand zone at 4100–4120 acted as a perfect base for institutional re-entry, fueling fresh upside pressure. As price consolidates above 4150, breakout confirmation above 4166 will open clean traffic toward the 4180–4200 resistance zone. Buyers remain dominant while the structure supports continuation.
Key Scenarios
✅ Bullish Case 🚀 → 🎯 Target 1: 4178 → 🎯 Target 2: 4188 → 🎯 Target 3: 4200
❌ Bearish Case 📉 → Invalidation below 4130
Current Levels to Watch
Resistance 🔴: 4178 – 4188 – 4200
Support 🟢: 4130 – 4100
⚠️ Disclaimer: This analysis is for educational purposes only. Not financial advice.

XAUUSD – 1H Correction From Rejection ZoneOANDA:XAUUSD
Market Trend | Structure | Reaction Zone
Gold remains bullish overall, but after testing the channel top near $3,985–$3,990, price shows clear rejection candles and slowing momentum. A short-term correction is now likely before the next impulse leg.
Market Scenario
📉 If bearish confirmation holds below the rejection zone, expect a corrective pullback toward demand.
This would allow price to retest structure supports before any continuation toward new highs.
Key Targets (Correction Move)
🎯 Target 1: $3,950–$3,945 → Demand retest zone (300–400 pips)
🎯 Target 2: $3,930–$3,925 → Trendline support zone (600–700 pips)
🎯 Target 3: $3,900–$3,895 → Mid-support area (900–1,100 pips)
Invalidation Zone
❌ Close above $3,995–$4,000 cancels correction setup — continuation to new highs likely.
⚠️ Disclaimer: Educational purpose only. Not financial advice.

Nifty supply demand 3rd OctoberNifty supply demand 3rd October
Check the third dated trading plan that uses supply and demand zones drawn from the chart before yesterday

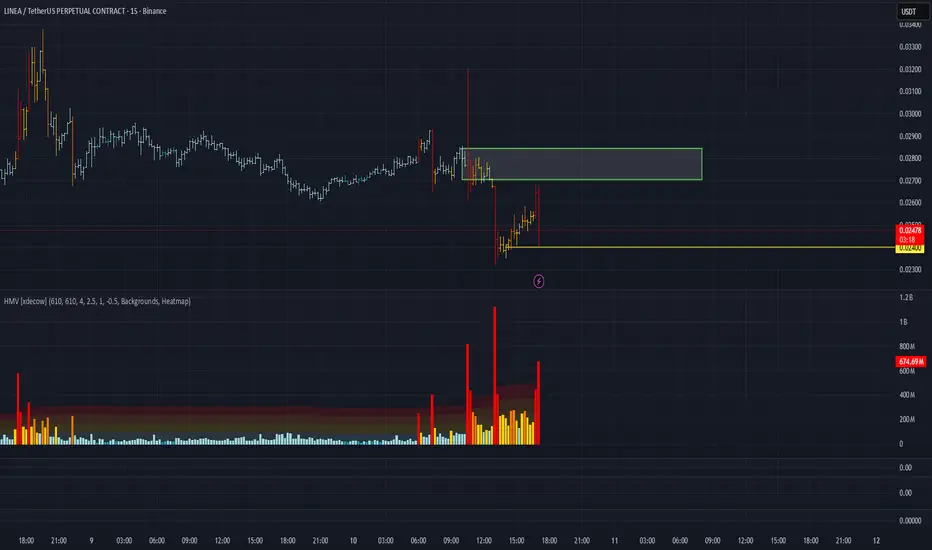
LINEA/USDT Analysis. Decision-Making Zones
Following the listing of the spot pair, volatility on this asset has significantly increased. Currently, we are trading between two key volume zones, where both long and short setups may be considered — provided there is a proper reaction.
Buy Zone: ~$0.024 (cluster anomalies)
Sell Zone: $0.027–$0.0284
This publication does not constitute financial advice.
The Nature of Zones — Reversals, Continuations, and the FlowWe’ve all heard trading terms like Major Trend and Major Counter-Trend levels. These are zones where price either breaks through and continues (Trend Levels) or sharply reverses (Counter-Trend Levels). In the crypto world, these levels are often separated by enormous gaps, due to the nature of the space — as I’ve mentioned in a previous idea: Crypto Charts Whisper—Are You Listening?
Let’s get one thing clear from the start. These levels are not just thin lines that traders casually draw across a chart. They are zones. So, as a skilled trader, anytime someone mentions support or resistance, keep in mind: interact with these as zones, not levels.
Why? The answer lies in the nature of the candlestick itself. Most support and resistance areas — 99% of the time — are defined by candlesticks such as inverted hammers, shooting stars, etc. For instance, in an uptrend near its peak, you’ll often spot an inverted hammer with a rejection wick that’s at least 25–50% of the candle’s body. The longer the wick, the stronger the rejection. In that sense, the high and the close of that candle form the zone. And what better tool to use for this than the rectangle?
Now, to slowly return to our main point — many of you might’ve noticed that zones often change their nature, especially resistance zones. If you’re experienced, you already know: price tends to go higher by nature. So when a counter-trend zone gets broken and price pushes above it, it shifts — it becomes a trend zone. Later, if price retests it from above, it often turns into support, and with another reversal, it can shift again — becoming a counter-trend zone once more.
But my point goes deeper than what you’ll hear in lessons or YouTube videos. Like I said in another post — A Follow-up to “Adjustments for Better Readings & VSA vs BTC” — if it’s already out there, it’s probably old news.
A skilled trader keeps an open mind — merging everything into one system. And it's part of this oneness mindset that elite traders follow, which I want to share now.
So I ask you:
What if the idea of trend and counter-trend zones didn’t just apply to major levels?
What if this concept applied everywhere on the chart?
For me, this isn’t just a question anymore — it’s a fact. A fact that made me a better trader. I won’t lie — before I got good at this, I failed over and over. But I never quit. That’s not the point though. The point is to expand your vision and train yourself to react just like the elite do.
Take double or triple tops/bottoms — standard or rounded. These formations also act exactly like trend and counter-trend zones. And they stay relevant well into the future. Every level is tested at least twice, from both directions. Maybe not immediately, but eventually — across multiple time frames.
And just like that, a level becomes a major zone for future use — especially if you trade across multiple time frames. So be careful: if you’re only looking at the 1-hour chart, you might miss something important that’s playing out on the 3-minute. And that can trigger psychological discomfort... leading to FOMO — and all the mistakes that come with it.
Also remember — double and triple tops/bottoms are zones, not exact lines. Many traders lose trades by a single tick, just because they forget that rule.
Let’s go a bit deeper now.
Think about all the small highs and lows that appear between those tops and bottoms on a 3-minute chart.
How can they help you trade better? The answer goes back to my previous idea: Location, Location, Location — Consistency and Alignment.
I get it — staying observant 24/7 is hard. That’s why institutions and big players work in teams, in shifts. They’re never alone. You shouldn’t be either.
There’s a lot more that could be said about these levels and zones — how they reveal future trend behavior, a flow! even without indicators or VSA. It has to do with how specific highs and lows behave at certain points in time... but let’s leave that for now.
For the outro, remember this:
The real edge isn’t in indicators.
It’s in your ability to catch the flow of price,
And to read strength or weakness through the simple structures within the zones Big Players create — whether visible or hidden.
A chart isn’t a single truth.
It’s a battlefield of conflicting zones and mixed signals.
If this mindset resonates with you and you want to go deeper — whether it’s building confidence or spotting hidden signals early — I work with a small circle of traders, sharing TA privately every day. Feel free to reach out.
Until next time, be well and trade wisely.
GBPJPY: Weekly OverviewHello Traders,
Everything is clear in the chart. the yellow line is a HTF resistance.
********************************************************
The indicated levels are determined based on the most reaction points and the assumption of approximately equal distance between the zones.
Some of these points can also be confirmed by the mathematical intervals of Murray.
You can enter with/without confirmation. IF you want to take confirmation you can use LTF analysis, Spike move confirmation, Trend Strength confirmation and ETC.
SL could be placed below the zone or regarding the LTF swings.
TP is the next zone or the nearest moving S&R, which are median and borders of the drawn channels.
*******************************************************************
Role of different zones:
GREEN: Just long trades allowed on them.
RED: Just Short trades allowed on them.
BLUE: both long and short trades allowed on them.
WHITE: No trades allowed on them! just use them as TP points

$AMD $120 retest then $130 push through. R/R looks incredible..Hello, NASDAQ:AMD Advanced Micro Devices, INC looks TASTY. I'm almost salivating. NASDAQ:NVDA may take a backseat and NASDAQ:AMD could start seeing monster upside. Something in my gut is telling me this name wants to GO. I'm looking at $120c for 6/20 and $130c for 6/20. This thing can launch.. it's hanging on an upside trendline, it may break but this $110 area may represent local support. Earnings report were good and after an abysmal 2024 after having highs and totally wiping them out hitting lows of $80, I think this could be the time for NASDAQ:AMD longs. It has taken the 20 day EMA/SMA over and now could curl to the 200 day EMA/SMA. 200 SMA is $126. This seems like a really good setup especially R/R here. Very cheap calls for a name that can see a 10-15% week.
WSL.

LEAP: GBPUSD Week 17 Swing Zone/LevelsLast week saw a good pinch on market pips. Aim to continue as always.
Price swing levels are set; either a or b, price action directs.
Levels/zones are calculated based on previous week H/L

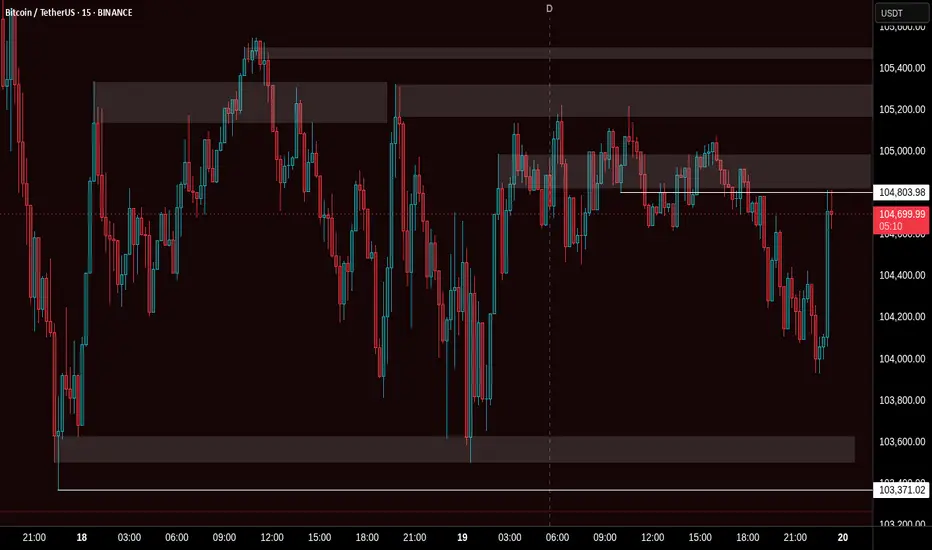
BTC ZonesHere are my simplistic zones that price has been respecting and will most likely follow. Do you think Bitcoin will pull down to the support levels below?
I see price making a slight move towards the support levels then contesting resistance for new highs. Based on history, we know how crypto tends to move in these months. COINBASE:BTCUSD

AMD Daily and Weekly Supply and Demand Zones! Some people are thinking there is a bottom for AMD but I still don't see enough for me to think it's at the bottom. I would love for price to break back to $119.21 and retest it for support to go towards $129.07 and fill those gaps on the Daily. If price breaks that $114.16 zone, seems like price would want to go back to $106.09.

GBPUSD Week 2 Swing Zone & LevelHappy new year pip hunters.
Welcome back to Pinchpips Swing zone and level, SZL.
We start off the new year with SZ has indicated around 933-990, and Levels as marked.
Price action determines trades, so either of a or b could playout.
Entry is based on the 5 min candlesticks pattern with SL @ 10-15 pips from entry.
TP is as price action and momentum determines. However SL is usually moved to Breakeven, BE once entry pinches +20pips.

NOT buying USDCADThe USDCAD price has moved into the Daily sell zone, which suggests the possibility of new sell positions entering the market, potentially driving the price down. In the case that the zone is broken, there is a high likelihood of further price increases (which, in my opinion, is less likely).
For those looking to short, I would recommend looking for a simple breakout pattern on lower timeframes and participating accordingly. BUT make sure to wait until after the NFT news and observe what market will do with price.
Good luck, and stay cautious, don't forget it's Friday!
