Zones

EURUSD outlook for this morningEU was a bit crazy yesterday with reacting off of random levels. We could now start to see it range until NFP. Don’t force anything just let the market show its hand and react.

Ashapuran Mine Starting a new UPTRENDENTRY- CMP
SL- 114 (Conservative)
105 (Agressive)
TGT- 210
Price has come near the Demand zone and has touched it a few time.
The best thing is 2 Monthly zones and 1 Daily zone are colliding (sign of a strong demand zone) which seems to be difficult to be taken out. Also RSI is showing Regular Bullish divergence
Safe ones can wait for Trend Reversal to enter.

ADA Massive Channel!!Money Makers!
ADA has been on a crazy rise the past few weeks. I thought this channel was an interesting perspective and decided to share it. If it fails these levels and BTC decides to correct I can see ADA correcting very aggressively from these levels. I also indicated a couple of S/R zones with the horizontal line to show the next major supports if it decides to correct. A short position here would be a great idea with a very tight stop loss to maximize profits.
Love it or hate it, hit that thumbs up and share your thoughts!
Don't trade with what you're not willing to lose. Safe Trading Calculate Your Risk/Reward & Collect!
This is not financial advice.
Simplicity Wins

XAUUSD August 2nd AnalysisRecent 30 min zones and 4H zones marked. Price broke 30 min zone and created bullish engulfing on 4H rejecting 4h zone. Expecting price to push to 1829.70 but could possibly reverse from one of the 30 min zones.
Left side is 5 min chart and right side is 4H.

Interesting zones for SVMJust for the overview.
Currently bearish in the 3D trend, but with take profit signal. I think we will oscillate between these two zones until there is a break, stood now rather downwards

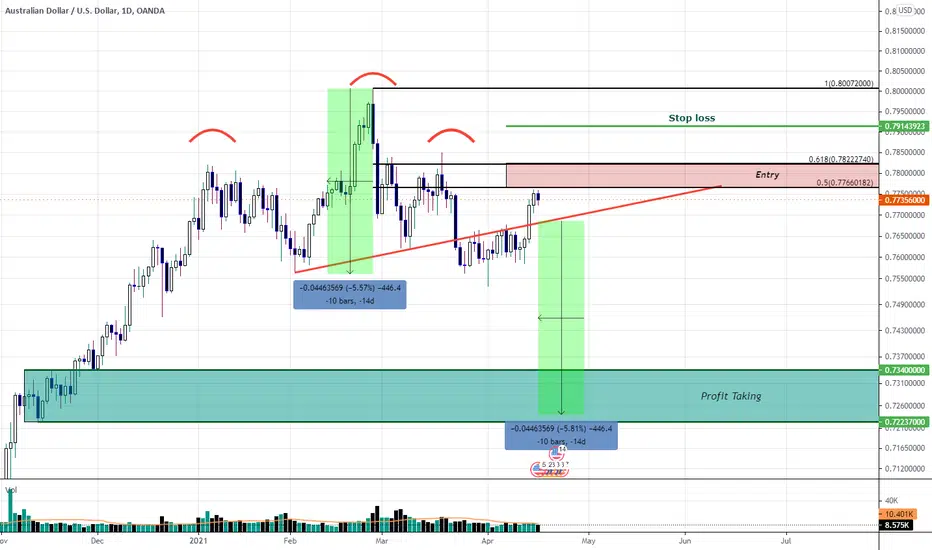
Head and Shoulders on Daily with Entry Levels and TargetsWe have somewhat of a Head and Shoulders pattern at the 50-61.8% Fibonacci Retracement Level.
Upon Market Open I will be entering a Short Position with my stoploss above the highs
$TSLA Zones to look at as we move into next weekStarting to map out some key zones that may come into play for Tesla as we move into next week. With news of FSD availability we may see a move up in price on Monday. More detailed analysis to come.

ETH/USD: Bullish Rising Wedge; update!!!At the moment analyzing Ethereum in my trade, Im in profit around of $1,900 USD that was entry price level to long position, we're ok. Just that today, Etheruem forming a bullish rising wedge, for that, Ethereum could to continue up to $2,400 USD. i'm in profit and I move the SL at $1,827 USD.

GBPNZD, 1hr tf, buy at 61.8% retracement
Price also dropped for GBPNZD yesterday. We dropped until 61.8% retracement of recent rally. At the same time, there is weekly support around this level so we could say this is an area of confluence support.
Also it appears there is a possibility double bottom pattern forming. We could see some rally to the upside if this pattern play out.
Buy GBPNZD 1.9700
Stop loss 1.9630
Take profit 1.9910 (3R)
Use only 1-2% risk
Good luck

SHORT USDCAD DAILY SET UP 4HR ENTRYI have been watching this pair for a while as it has been moving back up to test fib levels and structure. I saw it break through the 61.8% fib level and head towards the 78.6% fib level. As it approached the 71.8% fib level it came to a Daily Zone and a Daily Bearish Trend Line. As I saw a new level of resistance form at the Daily Zone and Daily Bearish Trend Line I Decided To Go Short On This Pair

Anticipated BREAK OUT below the ZONE AREABefore I proceed with my view on this chart, I want to believe as a trader you already know the importance of 200 EMA acting as a Dynamic Resistance and Support, we have seen a break-out below the 200 EMA and a steady consolidation just above the SUPPORT ZONE AREA from January, a rejection at the Dynamic Resistance. We saw that price did range for some days before the BREAK-OUT to the Down-Side and a retest which created a Bearish Engulfing. At this point we are expecting a clear BREAK-OUT below the ZONE AREA and if that's achieved and a possibly we see a retest, a continuation will give a valid entry and a target at 19150.96.
NOTE: As a trader, by now you should already know that consolidation at SUPPORT or RESISTANCE AREA, a strong BREAK-OUT below or above gives a valid entry.

Important zone for bitcoinBitcoin has 7 weeks with (3 Closing price and 4 opening price between 35600$ and 35828$
this zone is very important for bitcoin

Tezos could to forming a bulish rising wedge!!!I see that in Daily timeframe, Tezos it's in this strong support zone. And then, there's a lot chances that Tezos could to continue up to the next resistance of $4.40 USD. For that, will be my perspective in the market for this cryptocurrency.
s3.tradingview.com
And remember, we look a beautiful trend line up, for that Tezos make a lower higher in this trend line since November 2019 from around of $1 dollar. For that, Tezos could to growing up to $4.40 USD in the next resistance zone, this will be my target profit in Tezos.

BTC potential local bottom could be inI have identified a finished zigzag in a long-term wave 4.
Why I think the Zigzag is finished and the higher-degree trend is ready to resume?
We have seen a waves A and C which clearly subdivide in five waves. The wave 5 in wave C appears to be truncated which is very rare, however, given the wave 3 extreme course, I still give high probability to this wave count.
Furthermore, we have seen a sharp reversal from the 31k lows with an impusive nature and a choppy pullback in a channel afterwards. Moreover, morning star candlestick formed on daily timeframe, which is primarly a reversal pattern. Lastly, we have seen a break above 34k zone which now acts as a support. All these factors elevates probability of at least local bottom thus a move at least to 42k. There price will tell us the next course.
This idea is invalidated if price breaks the 31k level and is less probable when we get a close below 33k.

EURUSD SHORTSellers seem to have taken momentum let's see how far they can go.
Big target set at 1.20. Looking to short pullbacks on the way down.
Place your risk accordingly.
Please give me a like if you can!

Short zones Golden pocket + confluences If you are looking to short, those areas are high probability shorts

Check out my analysis for CADJPYPossible setups for next week. There could be a possible double bottom forming in the 1 Hr TF. Price has already respected price 90.500 and could respect it again.
Other possible scenario is that price can drop down to 90.000. It does seem like there was a head and shoulders pattern that formed this week.
Always remember to make time for backtesting. Its so crucial and very beneficial for your forex trading.

EURAUD, daily tf, hanging man candle appearsPrice previously broken above the marked yellow resistance area and go up for 160 pips.
In my opinion we haven't see any retest to this resistance as a support and we might see one soon.
There is going to be RBA meeting soon and it might follow it neighborhood RBNZ stance which send NZD gone up.
Notice also the previous daily candle close looks like hanging man candle indicating sellers could be in control soon.
Sell EURAUD 1.5790
Stop loss 1.5840
Take profit 1.5665 (2.5R)
Use only 1-2% risk
Good luck

DOGE; .75 or .35? (part 2)Going off my previous DOGE idea from May 4th(linked below)
I stated DOGE would either go to .75, or .35
Buyers were so close but ended off a slippery .739 peak
which then dropped us EXACTLY on to the .35 cent mark. (goal reached)
Now with this rebound off .35, DOGE is trying to re-enter the upper zone.
Breaching any zone will cause the market to react and push it back out to around .42
It will be a little shoving battle but everyone is on two of the same wire in a sense.
So, lets see who can maintain their stature.
-quick "maybe" section-
consolidation above .42 maybe
sellers reach 25 cents maybe
buyers regain control in upper zone maybe


Trading Zones after pre-market drop (May the 4th be with you!)These zones were created starting with a daily chart . Previous day and overnight values mapped with colored lines. Pivots (blue lines) were established on the 1H chart with woodie points to confirm strong levels with prior volume profiles. Auto-fib levels were also used to confirm next best trade opportunities.
Morning sell off after Jerome Powell speech yesterday...

why our zones have different colours here at FXG we always place our zones before looking for technical and fundamental trades, these zones start with the monthly (blue) then weekly (yellow) and finally daily (red) then on the lower timeframe those zones we have in green. the reason for the different colours is so we know the significance of that zone. so for example if price has broken its weekly zone to the upside then chances are price is going to break its daily zone as the daily zone has less battle than the weekly zone. this gives us an edge as when we know price is making its way to a significant area of battle then we know to stay out of the trade as we want buyers or sellers to win that battle and once they do we know the direction.
