Surge In Outbreak May Keep This BearishThe outbreak is rapidly spreading in the US with no signs of the slowdown happening yet.
If you haven't been paying attention to this pair lately, it's been making some pretty strong moves each week. I admit that I was even sleeping on this little bit, but not anymore.
This will be one of my top swing trade pairs for the next few weeks or months. I've actually been enjoying is several day rides and I'm going to keep continue to do so. As you may notice, I have bigger targets on despair due to the way it's been moving lately. Here is your TPS:
BULL TPs:
• 0.95716
• 0.96542
• 0.97306
• 0.97942
• 0.98358
• 0.99026
• 0.99673
BEAR TPs:
• 0.94910
• 0.93980
• 0.93476
• 0.92505
• 0.91845
• 0.90554
Zonetrading

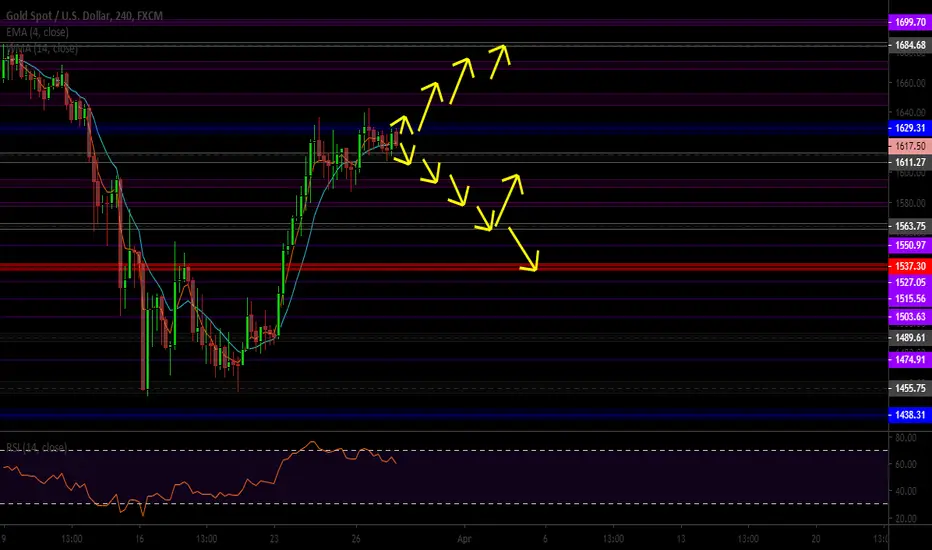
Traders Running To Gold May Keep It BullishTraders are buying GOLD since it's considered the safer currency due to the pandemic causing tons of instability in the markets. This explains the bull run it's doing. Currently, we're looking at a lower high with tech analysis. I would prefer another drop in the market back to the monthly level of 1537.30 zones before making a run back up.
I honestly don't have very much faith in the US market at the moment. It's stronger with some currencies. But I doubt it can overpower this one. but you know me. I don't marry a direction anyway. So here are the TPs I'm going for regardless of what the market does.
BULL TPs:
• 1625.20
• 1644.64
• 1660.80
• 1683.62
BEAR TPs:
• 1606.41
• 1599.92
• 1579.68
• 1565.69
If it can pass the daily SR zone…
• 1550.97
• 1538.72
EURUSD Daily forcastSuppy & demand zones forecast for those who enjoy trading zones. Zones are marked at clear horizontal & also diagonal support levels.

Gold found support.Gold found support on 1455 and pitchfork`s SP line confirms this support. It`s not a signal. It`s an idea. Don`t follow blindly. Thank you.

GOLD analyze updateGold once again tried to break through 1632 support. But seems like it`s failed. In my perspective that big green candle on zone is confirmation candle. It`s not a signal. It`s only an idea. Don t follow blindly. Thank you.

GOLD found support on 1632GOlD shakes on 7 year old zone and I think it is going to pullback. It`s not a signal. It`s only an idea. Don`t follow anyone blindly. It s my first time publishing idea. Sorry for bad English. Thank you.

The Short Looks Like It May Continue...Where price is consolidating at on the 4hr became a very thing doji that retested a bearish engulfing candle. This could indicate another small retest before continuation back down or we're just gonna keep plummeting.
I want to see if we're going to keep going past the daily SR zone for 135.674 to the weekly. Or if the temporary long move does occur, will it stop at the monthly zone of 140.009 or not.
Even though I do see a reverse inverted head neck and shoulder formation happening on the weekly, it'll take a while for it to complete the right shoulder. That is, is price doesn't feel like keeping the bearish momentum in play.
Here are the TPs:
BEAR TPS:
• 135.909
• 132.775
• 131.018
BULL TPS:
• 139.393
• 140.009
• 141.288
• 142.510

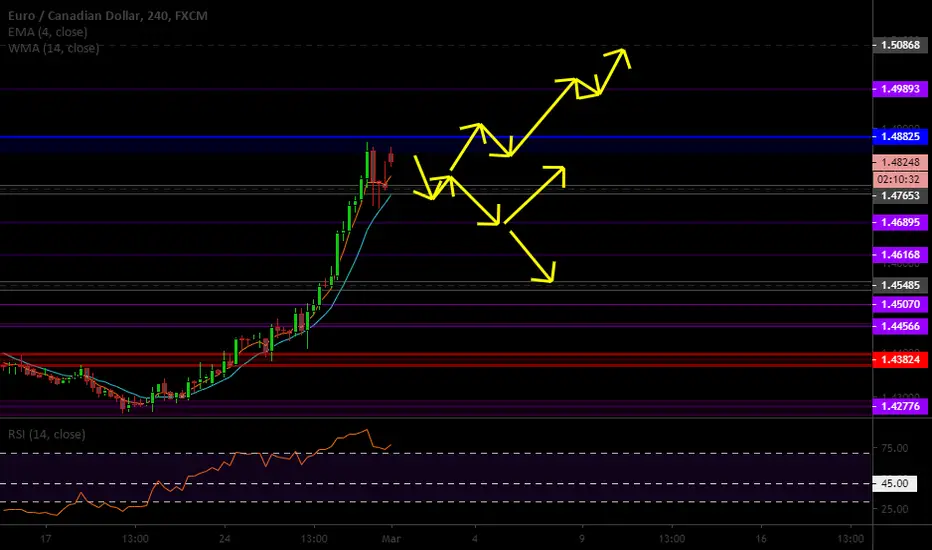
Pullback Possibly Due Because of Weekly FormationAccording to the weekly, last week's super bull run has formed the morning star on the weekly… Or a bullish engulfing… take your pic how you wanna see it. This may be a correction week before it continues on its rally. Here are some possible TPs. Enjoy the ride!
BEAR TPS:
• 1.47773
• 1.47653
• 1.46168
• 1.45578
BULL TPS:
• 1.48825
• 1.49893
• 1.50868
Pullback Due Before ContinuationWell, this is a juicy setup.
We have an ugly wick bounce to end the week so this pair can go up to create a new lower high aka the pullback. I don't see it coming back all the way up yet thanks to the Coronavirus putting China and its economy on a bit of a hiatus. So I wanna see how far up we can go before coming back down.
BULL TPS:
• 1595.92
• 1608.85
• 1629.31
BEAR TPS:
• 1566.50
• 1539.12
• 1527.05

Possible Bearish ContinuationThe bearish trend may continue for this pair. This will be marked up to make it to key levels.
Not much to say but trade to the next zones until it reaches a key level.
BEAR TPS:
• 1.29393
• 1.28824
• 1.28393
• 1.28055
BULL TPS:
• 1.29802
• 1.30550

Consolidation May Lead To A PullbackThis looks like a higher low is due before continuing up. So this may begin as a pullback before continuing up. Let's see how the markets play out. When it resumes the long, taking it to the weekly at 85.691.
BEAR TPS:
• 83.956
• 83.624
• 83.136
BULL TPS:
• 84.478
• 84.889
• 85.691

Currently In the Mist of A PullbackIf you weren't paying attention to this pair, you missed one heck of a drop! We are currently in pullback mode, but it won't last for too much longer since this pair actually broke out of multiple weeks long range.
So we'll be trading this pair until the pullback is complete or, if you want, when the continuation begins.
BEAR TPS:
• 1.42917
• 1.41912
• 1.40732
BULL TPS:
• 1.43824
• 1.44566


Major Key Level Reached For Strong SetupThis pair will be important to look at this week because of the weekly SR it made to… it hasn't been there since 2010. So that means this is a major setup forming.
This key level has delivered strong respect off support the last time it was hit. Let's see will it do it again. If not, I have one short TP that I'm aiming for… that is, if it can breakthrough.
BULL TPS:
• 0.88893
• 0.89372
• 0.89801
BEAR TPS:
• 0.86927

AUDCAD Explained Analysis!Sorry for the poor speaking quality, this was my first ever video analysis, so don't expect to much.
Anyway, the AUDCAD is in a perfect zones parallel channel, so please wait for a confirmation before buying this.

EURUSD LONGEURUSD to hit demand zone and retest back up to supply aiming 20 pip tp and swing for 1.1117
COMMENT YOU'RE THOUGHTS BELOW

Looks Like a Pullback Due For ContinuationNot much to look at with this pair. Still has the legs to keep moving up. Looks overbought on the RSI, so could do a pullback before continuing, or make a run for the short.
So, with this pair waiting on a pullback to confirm the continuation or reversal.
BULL TPS:
• 110.784
• 111.164
• 112.193
BEAR TPS:
• 109.776
• 109.127
• 108.420

Bull Still StrongCADJPY is in the middle of a strong bull run so we're just gonna follow the trend until it shows signs that it's turning around or committing a pullback.
BULL TPS:
• 84.088
• 84.407
• 84.818
• 84.889
BEAR TPS:
• 83.598
• 83.320
• 82.895

Strong Doji on Weekly Can Possibly Signal The Bull MoveAUDCAD looking like a buffet with that super-strong doji on the weekly. The strong bearish move was unphased last week and barely made a juke at all. It did a rejection at the daily and it looks to be forming a pullback on the 4hr.
The weekly shows a large rejection like the downward move has come to a screeching halt. But one way to know for sure is to see how the market plays out. Trade well this week. This may be the one I keep an eye on this week.
BULL TPS:
• 0.90314
• 0.90955
• 0.91256
BEAR TPS
• 0.89873
• 0.89467
• 0.89025

Trade Idea: EURUSD — Zone TradingMarket Structure: Day. Uptrend
Strategy: Zone
Trade Action: Buy. Trend Trading
RSI: Bullish Divergence
Entry Trigger: Doji + Confirmation

EURAUD touching support-zone!EA bounced once of the support, and now its looking to retest. This could go either way, but i will be having my eyes open for a long entry here:)

AU ZONE PLAY! AU is hitting strong resistance, and i think this is a good short setup. I will be keeping a close watch though, as this might be a zone-break followed by a retest on the upper side of the resistance, creating support.

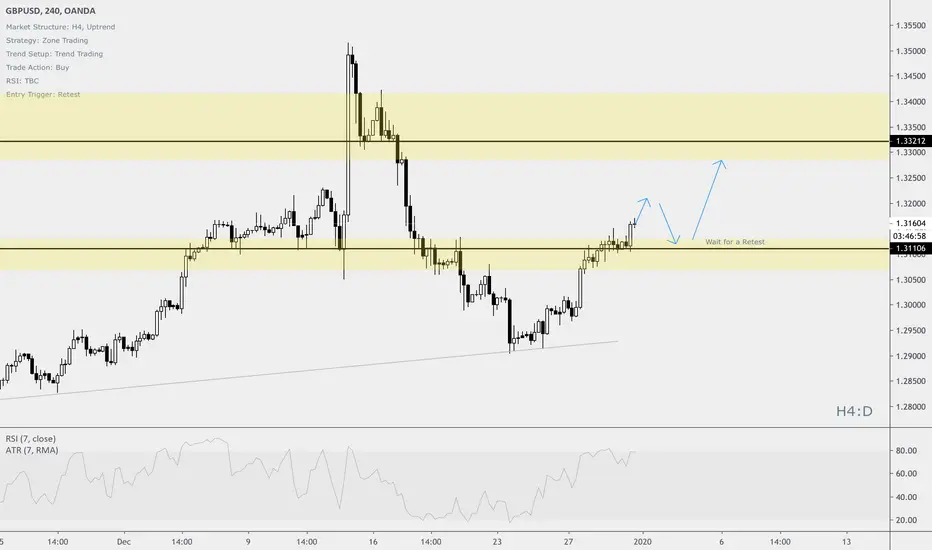
Trade Idea: GBPUSD — Zone TradingMarket Structure: H4, Uptrend
Strategy: Zone Trading
Trend Setup: Trend Trading
Trade Action: Buy
RSI: TBC
Entry Trigger: Retest