Gold- From weekly to 15m chart. Where are the trades?These days, everyone has an opinion on Gold.
Most of them are bullish.
And to be fair — so am I.
But here is what many traders either don’t understand or simply ignore:
There is a huge difference between having an opinion and having a tradable opinion.
A tradable opinion is one that can actually be executed in the market, with leverage, risk control, and realistic stops — not just a direction on a chart.
This analysis is not about saying “Gold is bullish, it will go to 6k or 7k, I’m a genius if it does.”
It’s about giving traders something they can actually work with.
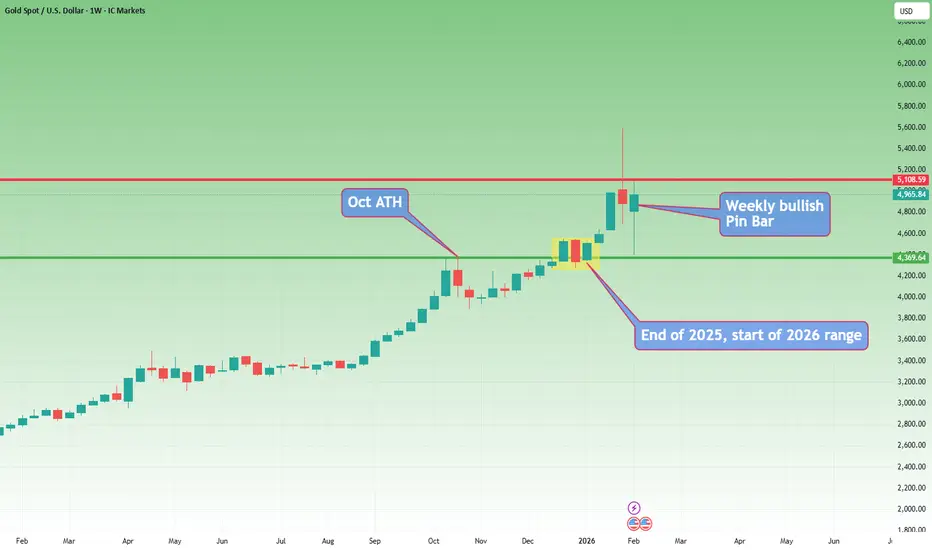
🔎 Weekly Chart — Big Picture Reality
Three things stand out immediately:
1️⃣ The 5600 → 4400 drop
Yes, it was massive:
- ~12,000 pips
- large in percentage terms
- emotionally shocking
But in long-term trend terms?
👉 Just a correction.
Even if we measure only the 2025 rally, the drop didn’t even reach a 50% retracement.
2️⃣ Technical respect of structure
The decline stopped almost exactly at the October 2025 ATH, which acted as support.
Markets remember levels.
This is not random.
3️⃣ Alignment with congestion
The drop also aligned with:
- the late-December congestion zone
- the starting price of 2026
The first prices of the year often act as major S/R zones.
This is classic market behavior.
✅ Conclusion from Weekly:
Trend is bullish. No debate here.
❌ But tradable?
Not really.
Why?
Because a correct structural stop would be ~8,000 pips away.
With leverage, that’s not trading — that’s praying.
🔎 Daily Chart — Still Bullish, Still Not Tradable
On the daily:
- clean reversal from support
- first impulsive leg up
- pullback forming a higher low
- recent Piercing Line bullish pattern
Again:
✅ Bullish structure
❌ Not tradable structure
A proper stop still sits ~4,000 pips away.
That’s not risk management.
🔎 15-Minute Chart — Where Trading Actually Happens for me lately
Given current volatility, this is what matters these days
Here’s what we see:
- initial rally in a rising wedge
- rejection from resistance
- drop from 5100 → 4650 contained within a bullish flag relative to the impulse
- breakout above flag resistance
- continuation toward 5k
- NY close near highs
Structurally?
👉 Still bullish.
But even here:
❌ Buying blindly at 4965 makes no sense.
We need a dip.
We need structure.
We need asymmetric risk.
📌 The Two Buy Zones That Make Sense
If price offers them:
✅ 4900
✅ 4800
Those are the zones where risk/reward becomes logical.
⚠️ The Reality Most Traders Don’t Want to Hear
Even on a 15M chart:
- stops of 300–500 pips are normal
- targets should be well above 1,000 pips
Let’s be honest:
Bragging about a 100-pip Gold target these days is like bragging about a 2-pip win on a EURUSD trade.
simply not trading...
✅ Final Conclusion
✔️ Gold is bullish
✔️ I will look to buy dips
✔️ But only with structure and discipline
Because in this environment:
- volatility is extreme
- emotions are expensive
- precision matters more than bias
A trader’s job is not to be right.
A trader’s job is to make money.
And those are two very different things. 🚀
P.S.
And yes — if I see a clear reversal structure on the 15-minute chart, I can take a short trade, even if my overall bias on Gold remains bullish.
This does not contradict my opinion.
It simply reflects the reality that:
You can be bullish on the bigger picture and still trade short-term corrections.
Have a nice Saturday!
Mihai Iacob
Futures market
Elise | XAUUSD · 30M – Liquidity Grab → Bullish ContinuationOANDA:XAUUSD
Gold executed a classic liquidity grab below support, trapping weak sellers before aggressively reclaiming structure. Each dip into demand has been met with strong buying pressure, showing smart-money accumulation. The current pullback appears corrective, and as long as price holds above support, continuation toward the higher resistance zone remains favored.
Key Scenarios
✅ Bullish Case 🚀 → 🎯 Target: 5,040 – 5,080
❌ Bearish Case 📉 → Failure to hold 4,820 may expose price back toward the lower demand zone.
Current Levels to Watch
Resistance 🔴: 5,040 – 5,080
Support 🟢: 4,780 – 4,820
⚠️ Disclaimer: This analysis is for educational and informational purposes only. It is not financial advice. Please conduct your own research before trading

XAU/USD ~ Gold Building Momentum from Key Support📝 Description 🔍 Setup OANDA:XAUUSD
✅Gold has been respecting a descending trendline with multiple rejections, showing clear bearish structure. Now price is attempting a breakout + retest while holding above a strong demand zone.
✅Buyers stepped in aggressively from support, forming higher lows and pushing price back toward the cloud resistance area.
✅Geopolitical tensions (Middle East concerns) continue to support safe-haven demand for gold — adding a fundamental tailwind.
📍 Support & Resistance
🟥 Support Zone: 4,760 – 4,650
🟥 Major Support: 4,570 – 4,400
🟩 1st Resistance: 5,310
🟩 2nd Resistance: 5,550
Volume profile shows strong acceptance near support — buyers defending the zone.
⚠️ Disclaimer
This analysis is for educational purposes only.
Trading involves risk. Always use proper risk management and your own strategy.
💬 Support the Idea👍 Like if you’re bullish on Gold
💬 Comment: Breakout rally or fakeout? 🔁 Share with fellow gold traders
#XAUUSD #Gold #Forex #PriceAction #TrendlineBreakout #SafeHaven #TradingView #SupportResistance #IntradayTrading #Kabhi_TATrading

XAUUSD Breaks the Deadlock as Bulls Regain ControlXAUUSD has rebounded strongly after the corrective phase.
Following that clear impulse to the upside, bullish momentum briefly slowed and price transitioned into a clean, downward-sloping corrective structure—exactly the type of price behavior I often observe during trend continuation phases.
This pullback is not a sign of weakness, but a necessary pause.
Sellers attempted to push price lower, but the decline remained shallow and lacked follow-through. Each dip into lower levels was quickly met with strong buying interest, effectively absorbing selling pressure. This behavior clearly suggests that buyers remain firmly in control of the broader market structure.
Price has now broken out of the corrective structure with convincing strength.
The breakout candle reflects clear buying intent and confirms that capital is rotating back into the market. This is a familiar setup that typically signals the activation of the next bullish leg, rather than a short-lived technical rebound.
As long as price holds above the breakout zone and does not rotate back into the structure,
I expect gold to continue extending higher, with upside targets focused on the 5.2xxx – 5.3xxx region in the coming sessions.

GOLD - Consolidation in a symmetrical triangle. Up or down? FX:XAUUSD showed signs of recovery on Friday, but the price is stuck within the boundaries of a symmetrical triangle, which generally indicates market uncertainty.
Key fundamental factors
The ADP, JOLTS, and unemployment claims reports pointed to weakness in the labor market, supporting expectations of two Fed rate cuts this year, which is positive for gold. Upcoming US-Iran talks are supporting demand for safe-haven assets, despite the conclusion of the Ukraine talks. Other central banks (the ECB and the Bank of England) easing policy has strengthened the dollar, putting pressure on gold.
Gold's attempt at recovery looks vulnerable. Although weak employment data and geopolitical risks provide support, the main counterforce remains the global rotation of capital in favor of the US dollar.
Technically, the market may have a chance to break through the correction resistance, but will there be support from traders?
Resistance levels: 4901, 5021, 5100
Support levels: 4811, 4751, 4670
I expect that before attempting a breakout, the market may try to test liquidity in the 4812 zone. However, if the market breaks through the resistance conglomerate and manages to close above 4901, then the market will be able to continue its growth towards 5000.
Otherwise, if 4812 does not hold the price, the market will close within the boundaries of a symmetrical triangle (flat).
Best regards, R. Linda!

Gold Price Analysis – Key Resistance and Support LevelsThis chart outlines critical resistance and support levels for gold prices. The Key Resistance Level at 5,565.814 is a potential area for price rejection or breakout. If price approaches this level, watch for either a continuation of bullish momentum or a pause in upward movement. The Support Zone around 4,820 is being tested, and if this level holds, it could lead to a bullish reversal or bounce. The Critical Support at 5,012.323 is a key level for potential bullish movement, while the Final Target at 4,504.227 represents the expected downside if support fails. Extreme Support at 4,509.018 is a significant reversal area, should the price reach this level

THE KOG REPORT - UpdateEnd of week update from us here at KOG:
Not a bad game play here with price working with the range we plotted, bouncing early session from our EXC Hot Spot and the resuming the move to complete our long target.
We're at a crucial point here for bulls with defence above that ideally needs to break to go higher. There is a level of 4980-85 which could be a test for the close, but they need a strong close here to change dynamics. We're on the side lines here having completed the targets we wanted for the week by the NY session.
Levels to watch for the remainder of the session:
Pull back support 4925
Resistance 4980-5, if broken, we should close above 5000.
From Camelot this morning:
Price: 4882
RED BOXES:
Break above 4890 for 4899✅, 4910✅, 4915✅ and 4939✅ in extension of the move
Break below 4855 for 4839 and 4810 in extension of the move
As always, trade safe.
KOG

XAUUSD – H1 Outlook: Liquidity Build XAUUSD – H1 Outlook: Liquidity Build While Risk Premium Supports Gold | Lana ✨
Gold is holding firm after a clean rebound from the sell-side liquidity sweep, and the current price action suggests the market is now building structure rather than trending aggressively.
📌 Technical picture (SMC/flow-based)
Price has transitioned from the sell-side sweep into a steady climb, now respecting the upper trendline.
The 4,940–4,970 region is acting as a short-term balance / re-accumulation zone where price is pausing and collecting liquidity.
Above current range, buyside liquidity is visible near the recent highs, with a key magnet around 5,015.
A healthy pullback into 4,920–4,940 would still keep the bullish intraday structure intact and often provides a better re-entry opportunity than chasing highs.
🎯 Scenarios to watch
Bullish continuation: Hold above 4,940–4,970 → reclaim highs → seek liquidity toward 5,015, then extension higher if price accepts.
Corrective dip first: A brief sweep below the range toward 4,920–4,940 → bounce back into the trendline → continuation to highs.
🌍 Macro backdrop (short & relevant)
ETF inflows into oil are rising sharply as US–Iran tensions increase, which typically lifts the geopolitical risk premium. When risk sentiment tightens, gold often benefits as a defensive hedge — supporting the idea that pullbacks may remain corrective, not reversal-driven.
✨ Stay patient, trade the levels, and let liquidity guide the next expansion.
Follow Lana for more intraday updates and share your view in the comments.

XAUUSD (H2) – Liam View Rally into supply XAUUSD (H2) – Liam View
Rally into supply | Volatility risk rising
Gold is rebounding from the 4550–4600 demand base, but the broader H2 structure still points to a sell-side environment. The current move higher looks corrective, driven by short covering and liquidity rotation rather than a confirmed trend reversal.
From the chart, price is rotating back toward 4900–5030, a zone where previous distribution and liquidity rest. Unless price can accept above this area, rallies should be treated as sell-side opportunities, not breakout confirmation.
Key technical zones
Major sell zone: 5536 – 5580 (HTF supply)
Near-term reaction zone: 5000 – 5030
Key demand / base: 4550 – 4600
Intraday support: ~4730
Market context
Recent US political headlines and institutional reviews add another layer of headline-driven volatility, increasing the risk of sharp swings and liquidity sweeps. In such conditions, gold often reacts erratically intraday, but higher-timeframe structure tends to reassert itself once the noise fades.
Outlook
As long as price stays below 5030, the bias remains sell-side dominant.
Failure to hold above 4730 would reopen downside risk toward the demand base.
Only a clean H2 acceptance above 5030 → 5100 would neutralise the bearish structure.
Execution note
Avoid chasing momentum in news-driven sessions.
Let price come to levels. Trade the reaction, not the headlines.
— Liam

Gold Roadmap (1H): Breakout Scenario in PlayToday, I want to share a long setup for Gold( OANDA:XAUUSD ) on the 1-hour timeframe—so stay with me!
Gold is currently moving near a resistance zone($4,991-$4,878).
From a classical technical perspective, it appears that gold has formed a descending broadening wedge pattern. If we break above the upper lines of this pattern, we can anticipate bullish momentum in the coming hours.
From an Elliott Wave perspective, it seems gold can continue its upward corrective wave, likely a ZigZag Correction(ABC/5-3-5).
I expect gold, after a small correction near Fibonacci levels and support zone($4,991-$4,878), to start rising toward at least $4,976. If we break the resistance zone($4,991-$4,878), we can set the next target around $5,081.
In case of heightened Middle East tensions, gold could experience a sudden bullish surge—so be prepared for that scenario as well!
What is your idea about Gold!? Up or Down at least for the short-term!?
First Target: $4,976
Second Target: $5,081
Stop Loss(SL): $4,591
Points may shift as the market evolves
💡 Please respect each other's opinions and express agreement or disagreement politely.
📌 Gold Analyze (XAUUSD), 1-hour time frame.
🛑 Always set a Stop Loss(SL) for every position you open.
✅ This is just my idea; I’d love to see your thoughts too!
🔥 If you find it helpful, please BOOST this post and share it with your friends.

XAUUSD: 3-3-5 ABC correction?I believe 5 impulsive waves have completed and gold prices are now taking 3-3-5 ABC correction. If this theory is correct and wave A has completed then we are now looking for wave B to complete and then heading towards wave C.
Wave B to ideally complete between 5000$ to 5141$
Wave B can also complete at 5344$ and 5425$ level as per XABCD harmonics that is appearing to be formed
Wave C initial target 4301$ with extended target towards 3951$
More to unfold as price moves in following days…

XAUUSD (30M) – Bullish Continuation After CorrectionGold has completed a corrective move into the 4,750–4,780 demand zone, where buyers stepped in strongly. Price is now forming higher lows with a clear bullish impulse, indicating a potential continuation of the short-term uptrend.
As long as price holds above 4,900, bullish momentum remains valid. A sustained push above 5,000 could open the door for a move toward 5,100, aligning with prior highs and supply.
Bias: Bullish
Key Support: 4,750 – 4,900
Key Resistance / Targets: 5,000 → 5,100
Invalidation: 30M close below 4,750

RTY When Reactions Aren’t ReversalsPrice recently reached the lower edge of the structure, where sellers began to lose momentum and buyers stepped in. That reaction from demand has produced the current bounce, but at this stage it’s best viewed as a reaction, not a confirmed reversal.
The key area now is trend resistance overhead. For this move to continue higher, price needs to accept above that level meaning hold above it, not just briefly spike through.
If that acceptance occurs, continuation toward upper supply becomes possible.If price fails and moves back below the demand area, the idea is invalid, and the broader downtrend remains in control.
This is a market letting us know what it wants to do our job is to wait for confirmation, not force a bias.

Xauusd 1H chart Pattern.descending triangle / falling wedge squeeze, and price is already breaking upward from the apex with demand support around 4855–4860.
🎯 Targets (Bullish Breakout)
Immediate Target (T1):
➡ 5,100 – 5,120
(previous structure + mid resistance)
Main Target (T2):
➡ 5,200 – 5,230
(matches my marked zone on the chart)
Extended Target (T3 – momentum continuation):
➡ 5,480 – 5,520
(full pattern height projection + higher TF resistance)
🛑 Invalidation / Risk Level
Break & hold below: 4,850
That would weaken the bullish structure and delay targets.
📌 Trade Logic Summary
Structure: Compression → breakout
Cloud support holding
Higher lows forming
Targets you drew are technically valid ✅

Gold 30-Min — Volume Bullish Reversal Triggered⚡Base : Hanzo Trading Alpha Algorithm
The algorithm calculates volatility displacement vs liquidity recovery, identifying where probability meets imbalance.
It trades only where precision, volume, and manipulation intersect —only logic.
Technical Reasons
/ Direction — LONG / Reversal 4862 Area
☄️Bullish momentum confirmed through strong candle body.
☄️Structure shifted with higher-low near key demand base.
☄️Volume expanding confirms order-flow alignment upward.
☄️Buyers reclaimed imbalance with sustained clean break.
☄️Algorithm detects rising momentum under low liquidity.
⚙️ Hanzo Alpha Trading Protocol
The Alpha Candle defines the day’s real control zone — the first battle of momentum.
From this origin, the Volume Window reveals where the next precision strike begins.
⚙️ Hanzo Volume Window / Map
Window tracked from 10:30 — mapping true market behavior.
POC alignment exposes institutional bias and breakout potential zones.
⚙️ Hanzo Delta Window / Pulse
Delta window monitors real buying vs. selling power behind each move.
Tracks volume aggression to expose who controls the candle — buyers or sellers.
When Delta aligns with Volume Map, momentum becomes undeniable.

Elise | XAUUSD · 30M – Structure Shift → Bullish ContinuationOANDA:XAUUSD
Gold swept liquidity on multiple pullbacks before aggressively reclaiming structure. Buyers stepped in decisively from demand zones, leading to a clean bullish continuation. The current consolidation above support suggests acceptance at higher prices, increasing the probability of a push toward the next premium resistance levels.
Key Scenarios
✅ Bullish Case 🚀 → 🎯 Target 1: 5,080 – 5,120 → 🎯 Target 2: 5,280 – 5,320
❌ Bearish Case 📉 → Failure to hold 4,940 would weaken bullish bias and open downside retracement.
Current Levels to Watch
Resistance 🔴: 5,080 – 5,120 | 5,280 – 5,320
Support 🟢: 4,900 – 4,940
⚠️ Disclaimer: This analysis is for educational and informational purposes only. It is not financial advice. Please conduct your own research before trading.

THE KOG REPORT - UpdateEnd of day update from us here at KOG:
Yesterday we plotted the potential range we expected price to play with the higher and low hot spots on the chart. We wanted both to complete one way or another, which as you can see from the chart, they have. Price managed to stay within the range so far giving the opportunity for traders to capture the scalps on the indi’s.
We now have support at the 4840-45 level which will need to hold price up in order for us to attempt the immediate resistance level above sitting at 4930. We’re still in a short-term bearish structure and this could be the final swing so again, it needs extreme discipline and patience, the trades are coming but the levels need to be right to get the big captures, which the market is giving.
From Camelot this morning:
Price: 4882
RED BOXES:
Break above 4890 for 4899, 4910, 4915 and 4939 in extension of the move
Break below 4855 for 4839✅ and 4810✅ in extension of the move
As always, trade safe.
KOG

XAUUSD Short: Supply Holding, $4,750 Demand as TargetHello traders! Here’s a clear technical breakdown of XAUUSD (4H) based on the current chart structure. Gold previously traded within a well-defined ascending channel, where price respected both the rising support and resistance lines, forming a series of higher highs and higher lows. This structure confirmed sustained bullish momentum and healthy trend continuation. During this phase, pullbacks remained corrective, and buyers consistently defended the lower boundary of the channel, allowing price to gradually grind higher. The bullish move ultimately accelerated into a strong impulsive rally, which culminated at a clear pivot high, marking a temporary exhaustion of buying pressure. Following this pivot point, market structure shifted. Price broke below the ascending channel support and transitioned into a bearish corrective phase, signaling that bullish control was weakening.
Currently, XAUUSD is trading below the descending Supply Line, with price structure showing lower highs and failed recovery attempts. This suggests that the recent upward moves are corrective pullbacks rather than the start of a new bullish trend. Below current price, the Demand Zone around 4,750 stands out as the next major area of interest. This zone represents a strong historical demand level and aligns with prior consolidation, making it a logical downside target where buyers may attempt to step in.
My primary scenario favors further downside continuation as long as price remains below the descending supply line and below the 4,900 Supply Zone. Any rallies into this resistance area are viewed as potential selling opportunities rather than trend reversals. The main downside objective is the 4,750 Demand Zone (TP1), where partial profits can be considered and where a market reaction is likely. If price reaches this zone, the response will be key in determining whether gold forms a base for a corrective bounce or continues lower into deeper demand. However, a strong bullish reclaim and acceptance back above the supply zone and the descending supply line would invalidate the bearish scenario and signal a possible trend shift. Until that happens, structure, trend, and price behavior continue to favor sellers. Manage your risk!

GOLD - Correction (local downtrend). Range?FX:XAUUSD is showing increased volatility on Thursday, fluctuating within a wide range of 4800-5100. The market may move into consolidation...
Key fundamental factors
The USD's rise to two-week highs is putting pressure on gold. A weak ADP private sector employment report (22K vs. 48K forecast) supports expectations of two Fed rate cuts this year (limiting gold's decline). The agreement on negotiations between the US and Iran in Oman on Friday temporarily reduces demand for safe-haven assets.
Today's JOLTS (job openings) data and weekly jobless claims may strengthen or weaken expectations for Fed rates.
Gold is balancing between conflicting factors: a strong dollar and reduced geopolitical risks are weighing on prices, while weak employment data and general uncertainty about Fed policy are providing support.
Resistance levels: 4941, 5021, 5100
Support levels: 4856, 4751, 4670
The market is in a correction phase, with pressure in the 4950-5000 zones intensifying local sell-offs ahead of the news. The structure will be broken if gold breaks through the 4950 conglomerate and downward resistance and consolidates above this zone. But at the moment, I am considering a decline to 4751-4670 and a possible rebound with the aim of forming a sideways range.
Best regards, R. Linda!

Selena | XAUUSD – 30M | Intraday Recovery From DemandFOREXCOM:XAUUSD PEPPERSTONE:XAUUSD
After a strong bearish impulse, XAUUSD reached a major intraday demand zone and printed a sharp rejection. Price is now attempting a corrective recovery, but upside remains capped by a descending trendline and supply zone around 4,900–4,930. The move currently looks like a pullback within a broader corrective phase.
Key Scenarios
✅ Bullish Case 🚀 (Intraday)
Holding above 4,760–4,780 support
🎯 Target 1: 4,900
🎯 Target 2: 4,930–4,960 (trendline + supply zone)
❌ Bearish Case 📉 (Failure Scenario)
Breakdown below 4,760
🎯 Downside target: 4,640–4,600 demand zone retest
Current Levels to Watch
Resistance 🔴: 4,900 – 4,960
Support 🟢: 4,760 → 4,640
⚠️ Disclaimer: This analysis is for educational purposes only. It is not financial advice.

XAUUSD: High-Reward Short Setup at Key ResistanceTrade Setup: The current chart highlights a clear Short (Sell) opportunity on Gold (XAU/USD) as price action rejects the heavy horizontal resistance zone around 4,860. We are observing a shift in momentum that aligns with a potential trend reversal from recent local highs.
Technical Rationale:
Resistance Rejection: Price is showing significant exhaustion near the 4,857 level, failing to maintain a bullish structure above the purple supply zone.
Risk-to-Reward: This setup offers a highly attractive Risk/Reward ratio, targeting significant liquidity areas lower in the structure.
Price Target: The projected path suggests a move toward the major demand zone near 4,347, which acted as a strong historical floor.
Execution Levels:
Entry Price: 4,857.34
Stop Loss (SL): 5,077.89 (Placed above the recent swing high for safety)
Take Profit (TP): 4,347.04
Risk/Reward Ratio: Approximately 2.3+

GOLD(XAUUSD): New Potential Zone For Swing And Intraday Buyers! Gold fell below our previous analysis’s expectations rendering it invalid. Consequently, we’ve identified two potential zones for buyers. One is safer while the other is riskier. You can choose either or both depending on your trading strategy.
Like and comment for more! We appreciate your support and hope it continues.
Team Setupsfx_

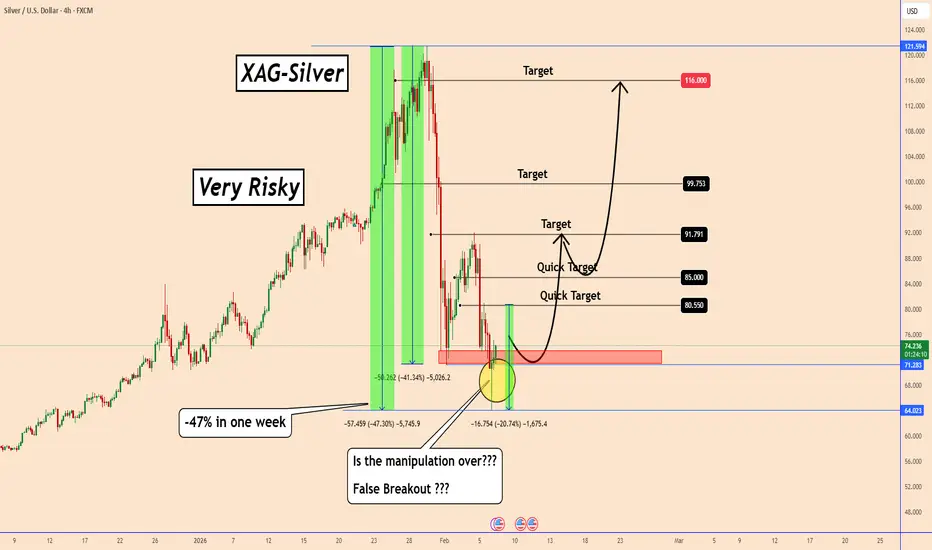
Silver: From -47% to Bullish Momentum: Silver’s Chaotic WeekSilver: From -47% to Bullish Momentum: Silver’s Chaotic Week
In the first sell-off that silver experienced, the price fell by almost -40%.
After a correction these days, we saw silver move lower overnight creating another structural low.
Just yesterday, silver fell by almost -21%, adding to the biggest drop a correction value of almost -47% in just one week.
Why all this mess, when nothing has changed from a geopolitical perspective.
(Just manipulation by those who created the big bullish wave - My opinion and I don't expect everyone to agree with it)
On the 4-hour chart, the price created a possible false breakout and today silver is resuming the bullish move again as shown in the chart.
However, the bullish move is related to the US-Iran talks. If they don't reach an agreement, silver could probably skyrocket again.
If the US and Iran reach an agreement over the weekend, we could see the markets calm down and perhaps silver could also fall further.
However, this is related to the news in this analysis, but remains bullish and highly manipulated. A bullish wave can happen in the same way as a bearish wave too without any clear idea why. In the same way as it moved down.
You may find more details in the chart.
Thank you and good luck! 🍀
❤️ If this analysis helps your trading day, please support it with a like or comment ❤️