Bulls Are DONE… Bears Ready to ATTACK🎯 Complete & Professional Guide to the Double Top & Double Bottom Pattern
The Double Top and Double Bottom patterns are among the most reliable reversal signals in technical analysis. When identified correctly, they can create low-risk and high-reward trading opportunities.
🔻 1. What Is a Double Top?
A Double Top forms when the price hits a resistance level twice and fails to break above it—showing the market has no strength to continue higher.
Key Characteristics:
The prior trend must be upward
Two peaks form at roughly the same level
A valley forms between the two peaks
Neckline breakout → confirms a sell entry
📉 Core message: Buyers are losing strength; sellers are taking control.
🔹 2. What Is a Double Bottom?
This is the opposite of the Double Top. Price tests a support level twice and bounces each time.
Key Characteristics:
Prior trend must be downward
Two bottoms at the same level
A peak forms between the two bottoms
Neckline breakout → confirms a buy entry
📈 Core message: Sellers are weakening; buyers are stepping in.
📌 3. Structure of Double Top / Double Bottom
Double Top → M-shaped
Double Bottom → W-shaped
Three essential components:
1️⃣ Two equal highs or lows
2️⃣ The neckline
3️⃣ Breakout → main trading signal
🧠 4. Most Important Rule: Breakout of the Neckline = Entry Signal
❌ Two highs or lows alone do NOT confirm a trade.
✔️ A professional entry occurs only after a valid neckline breakout.
🎯 5. Professional Entry Rules
🔻 Sell Entry – Double Top
After the neckline breaks:
Entry: after breakout or during pullback
Stop-loss: above the second top
Take-profit: measure the distance (Top → Neckline) and project it downward (T1)
T2: follow lower swing levels
🔹 Buy Entry – Double Bottom
After the neckline breaks:
Entry: after breakout or pullback
Stop-loss: below the second bottom
Take-profit: distance (Bottom → Neckline) projected upward
🔍 6. What Makes a Valid Pattern?
✔️ 1. Volume Confirmation
Double Top: volume decreases on the second peak → buyer exhaustion
Double Bottom: volume increases on the second bottom → new demand entering
✔️ 2. Proper spacing between two highs/lows
Not too close (noise)
Not too far (pattern loses meaning)
✔️ 3. Strong neckline breakout
Powerful candle + high volume = strongest confirmation
⚠️ 7. Common Mistakes Traders Make
❌ Entering before the neckline breaks
❌ Trusting the shape alone
❌ Ignoring volume
❌ Ignoring higher timeframes
❌ Trading these patterns in non-trending markets
🕒 8. Best Timeframes
Day trading: 15m, 30m, 1h
Swing trading: 4h, Daily
Higher timeframes = fewer fake breakouts and better structure.
🔐 9. Pro Tips for Expert Traders
💡 Double Top is stronger when the second peak creates a fake breakout (small wick above resistance → rejection).
💡 Double Bottom is stronger when the second bottom forms a long lower wick, showing heavy demand.
💡 Always check confirmations:
Volume
Rejection candle / breakout candle
Trendline confluence
RSI or MACD divergences
🎯 10. Simple & Highly Accurate Strategy (Recommended)
Breakout + Pullback = highest probability setup
Example (Double Top):
Entry: pullback to neckline
SL: above second top
TP1: height of the pattern
TP2: previous swing lows
Futures market

Understanding the Midpoint Magnet: Weekly Price Filling The concept of 50% price filling on a weekly candle within a consolidation area relates to the common technical analysis practice of looking for a midpoint retracement before a potential breakout. When an asset's price enters a consolidation phase on the weekly chart—meaning it's trading sideways within a defined high and low (often forming patterns like rectangles or triangles)—traders view the 50% level of that range (the distance from the high to the low) as a key point of equilibrium or balance between buyers and sellers. This level, which is a psychological point often included in the Fibonacci retracement tool despite not being a true Fibonacci ratio, can act as a magnet where price action is likely to 'fill' or return to before initiating the next major move. Therefore, a weekly candle's wick or body penetrating and reversing at this 50% level suggests a rebalancing of orders and offers a high-probability zone for traders to anticipate either a continuation of the prior trend or a strong breakout from the consolidation range.
Consolidation area
Identifying Consolidation and Key Levels
Consolidation Area: The broader charts show the price of Gold Spot (XAUUSD) entering a period of sideways trading, characterized by alternating weekly bullish (green) and bearish (red) candles, often within a defined high and low range. This area represents a balance or indecision between supply and demand.
Key Candle/Range: The concept then focuses on a specific high-momentum candle (e.g., the Nov 2nd Week Candle) or the entire range of the consolidation to establish the boundaries for the analysis.
The 50% Level: The critical level is the 50% retracement (or midpoint) of this chosen range. This level is considered the Equilibrium (EQ) point, where buyers and sellers are perfectly balanced.
Example
On this chart, we see:
Each weekly candle dipped into the midpoint of the one before it,
Created reaction,
And built a foundation for continuation.
As long as the market keeps holding above the 50% zone, the structure remains intact and biased toward continuation.
During consolidation phases, the market often displays a repetitive behaviour:
each weekly candle tends to retrace and fill approximately 50% of the previous week’s candle before continuing in either direction.
This happens because the midpoint of a strong weekly candle is a fair value zone, where:
liquidity is gathered,
trapped orders are resolved,
and the market achieves balance before the next move.
How the Chart Demonstrates This
November 2nd week candle
A large bullish candle created a strong move upward.
This left an imbalance in price.
The midpoint of this candle sits around 4,122.
Following weeks
Price entered consolidation.
Each weekly candle retraced into the 50% zone of the previous week’s candle.
When price reached the midpoint, buyers stepped in again, causing a bounce.
Repeat Structure
This pattern repeated across the next candles:
wick down → fill midpoint → rejection → continuation
Showing a rhythmic behaviour characteristic of consolidation:
Slow pullback
Midpoint fill
Reaction
Next candle repeats
Current Candle
Again moved back into the midpoint zone, confirming the same behaviour.
Holding above the 50% level maintains a bullish continuation structure.
Why This Happens
The 50% zone of a strong candle is often where:
-institutions reload
-pending orders sit
-imbalances are corrected
This zone is neither expensive nor cheap — it’s fair value.
So, during sideways phases, price frequently returns there to:
✔ collect liquidity
✔ balance the market
✔ establish support or resistance
Before the next directional move occurs.
Key Takeaway
In consolidation, the market does not trend strongly.
Instead, it oscillates around the previous candle’s midpoint.

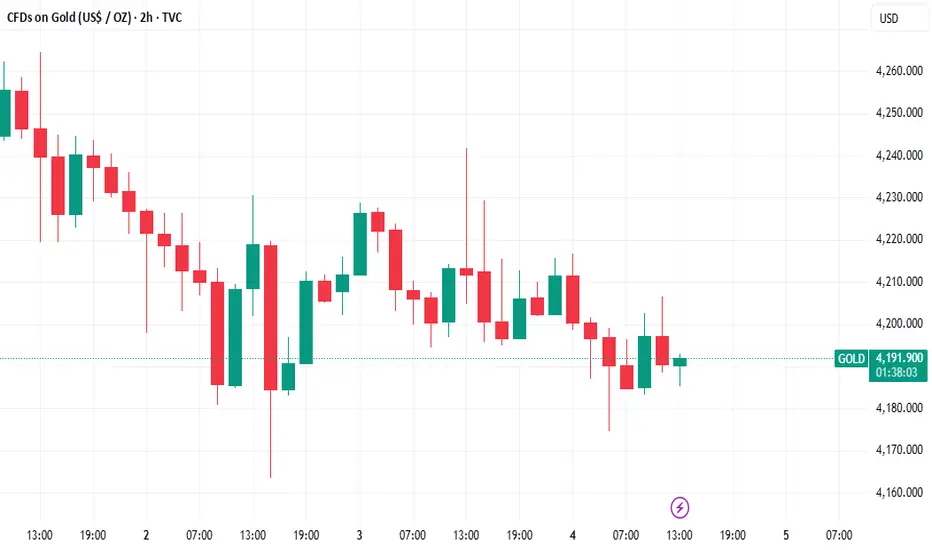
XAUUSD H1 Structure Shift SellGOLD (XAUUSD) H1 Timeframe SELL Analysis
After a strong bullish rally, Gold showed a major reversal where the price tested the 4000 level and then gave an aggressive bullish push. During this bullish wave:
1. Break of Structure (BOS) Confirmation
Price first gave a BOS, and with bullish continuation it respected the bullish trendline twice.
2. Break of Structure
Price tested the bullish trendline again and afterward the market moved inside a Small Bullish Channel (ascending channel), where a higher-high and higher-low structure was maintained.
3. Trend Weakness After the Last BOS
After breaking above the channel, the market formed a lower high, showing that bullish momentum was weakening.
From this point, a Bearish Trendline was created, which is now rejecting the price.
4. Current Market Behaviour (Most Important)
Price retested the Bearish Trendline
Failed to break it rejection occurred
Price is currently trading around 4194
Market structure is now showing a clear bearish shift
As long as the price stays below the bearish trendline, further downside continuation is expected
SELL Trade Setup
Sell Entry
4192 – 4194 zone
Stop Loss 4213
Take Profit Levels
TP1 4170
TP2 4145
TP3 4110
Final Summary
After the bullish rally, Gold gave a reversal, BOS was confirmed, the bullish channel broke down, and now the bearish trendline is strongly rejecting price. A sell setup is active from 4190 targeting 4170, 4145, and 4110, with a stop loss at 4213.

Banknifty Banknifty levels are based on volume profile
1. Gapup 59650 long
2. 59650-59450 trade breakout
3. Gapdown 59450 short

CONFIRMATION CANDLE
If this current h2 candle closes bullish by 3 p.m UTC hold buys but if it closes bearish just close buys because it could sell more and it's very important
GOLD Resistance Ahead!
HI,Traders !
#GOLD keeps growing
But will soon hit a horizontal
Resistance of 4229.11
So after the retest we will
Be expecting a local
Bearish correction !
Comment and subscribe to help us grow !

Gold Trade Set Up Dec 4 2025Price swept PDL and SSL to the left also tapping into 1h and 15m demand zones so i will be targeting higher BSL and PDH for a continuation higher

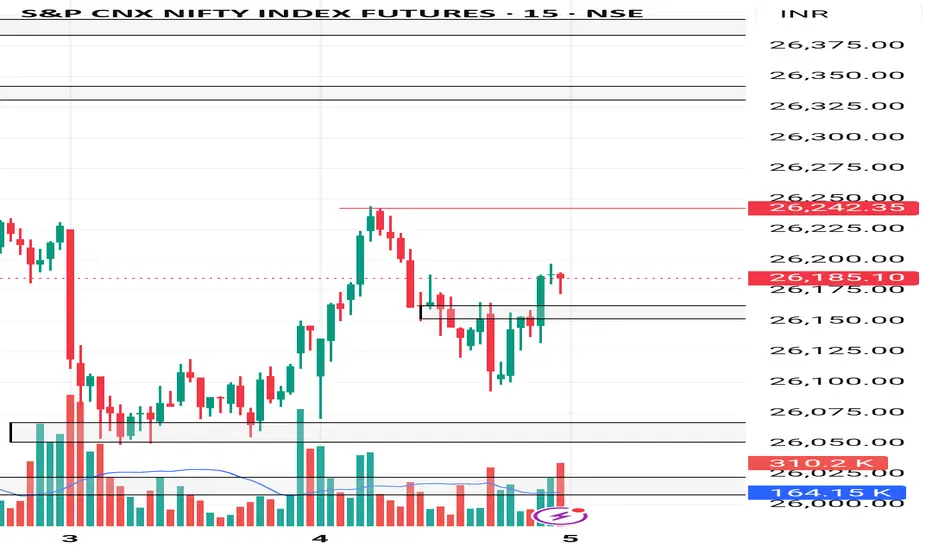
NiftyNifty levels are based on volume profile
1. Gapup 26250 long
2. 26250-26150 trade breakout
3. Gapdown 26150 short
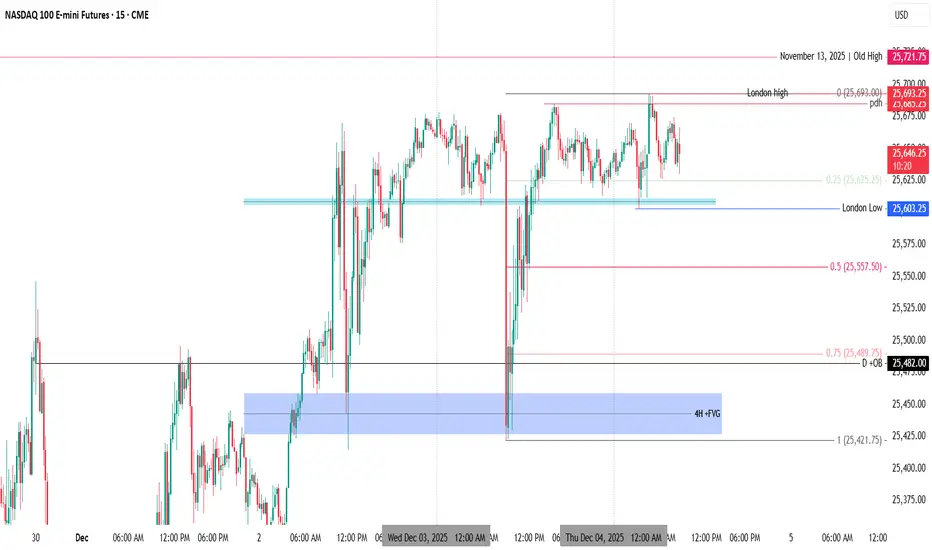
NQ | Thursday December 04, 2025**NQ**
HTF Bias: **Bullish**
The Asian high was raided during the London open. Price then retraced, swept the Asian low, and traded into the daily volume imbalance before pushing higher and taking the PDH.
Currently, price remains inside the London session range.
**Buyside Targets:**
> London high at 25,693.25
> November 13, 2025 old high and November 12 old high
**Sellside Targets:**
> London low at 25,603.25
> Previous dealing range 50% at 25,557.50
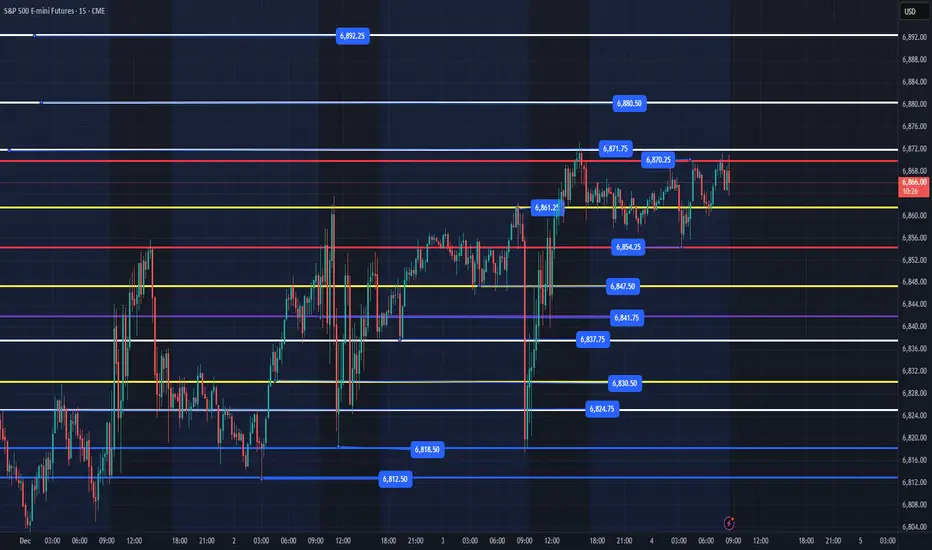
ES - December 4th - Daily Trade PlanDecember 4th- Daily Trade Plan - 8:30am
*Before reading this trade plan, if you did not read yesterday's take the time to read it first! (You can view the posts in the related publication section) *
If my posts provide quality information that has helped you with your trading journey. Feel free to boost it for others to find and learn, also!
My daily trade plan and real-time notes that I post are intended for myself to easily be able to go back and review my plan and how I did from an execution perspective.
--------------------------------------------------------------------------------------------------------
You can review my trade plan from yesterday and the daily note updates to see which levels we grabbed points from.
Overnight we have been building a nice bull flag between 6854-6870. Looking at the bigger picture price looks like it wants to go higher and break out of this range we have been. My general lean today is that we have a flush and reclaim of 6854 before heading up. We might only get as low as 6861. IF price loses 6818 then we should move lower.
Key Levels Today
1. 6861 flush and reclaim
2. 6854 flush and reclaim
3. 6847 flush and reclaim
4. 6837 flush and reclaim
5. 6818 flush and reclaim (wait for reclaim of 6824)
Below these levels and price will most likely be selling off and I would be getting out the way and let price find a level below to reclaim and move higher.
I will post an update around 10am EST
----------------------------------------------------------------------------------------------------------------
Couple of things about how I color code my levels.
1. Purple shows a current or prior weekly low
2. Red shows the current overnight session High/Low (time of post)
3. Blue shows the previous day's session Low (also other previous day's lows)
4. Yellow shows core support/resistance levels
5. White shows overhead resistance/targets
Gold Bias – Short-Term Bearish Pullback Setup
Price is holding below intraday resistance and showing weakening momentum after failing to break higher. As long as gold remains under the 4,199–4,201 zone, the short-term bias favors a continuation lower into the next demand levels around 4,145 → 4,138 → 4,133. A breakout and hold above 4,201 would shift the bias back to bullish.

GOLD Is Bullish! Buy!
Take a look at our analysis for GOLD.
Time Frame: 4h
Current Trend: Bullish
Sentiment: Oversold (based on 7-period RSI)
Forecast: Bullish
The market is approaching a significant support area 4,188.16.
The underlined horizontal cluster clearly indicates a highly probable bullish movement with target 4,233.29 level.
P.S
Overbought describes a period of time where there has been a significant and consistent upward move in price over a period of time without much pullback.
Like and subscribe and comment my ideas if you enjoy them!

XAUUSD Near Key Support – Bounce or Breakdown?Gold is currently trading around 4188, pulling back from the strong supply zone between 4220–4268, which aligns with:
The November High zone,
A daily close level from the start of the month,
A repeated rejection area seen multiple times on the chart.
This region remains a heavy supply area, and the market is struggling to break and hold above it.
At the same time, gold still respects the mid-range ascending structure, holding above the trendline and staying within the broader bullish channel. This creates two possible outcomes based on whether buyers defend nearby support levels.
PLAN A – Bearish Correction Into Last Week’s 50% Zone
Scenario:
If the current support fails, gold can slide toward the stronger demand area at 4143–4134, which also aligns with:
50% retracement of last week’s candle,
The lower boundary of the grey demand box,
A previously untested bullish accumulation region.
This zone is a logical liquidity magnet and would complete the deeper correction.
Possible Entries:
Wait for price to hit 4143–4134
Look for bullish reversal candles inside this zone
Targets for a bounce:
TP1: 4175
TP2: 4200
TP3: 4220
(If buyers reclaim structure, a retest of 4250+ becomes possible later)
If selling:
Early confirmation = 4H break below 4170
Downside Targets: 4143 → 4134 → (extension) 4100
Invalidation:
Sharp reclaim above 4205.
PLAN B – Bullish Recovery From Mid-Level Support
Scenario:
Price wicks down into the light-grey support zone around 4175–4185, finds buyers, and pushes back toward 4200–4220, eventually retesting the supply at 4226–4268.
Why it makes sense:
This zone acted as previous resistance turned support.
It lines up with the ascending channel midline, which has been respected multiple times.
Buyers may defend this level before the market decides direction.
Possible Entries:
4180–4175 on bullish rejection
Confirmation: bullish engulfing or higher-low formation
Targets:
TP1: 4200
TP2: 4220
TP3: 4250–4268 (major supply)
Invalidation:
Clean 4H close below 4170.

FDAX UpdateProbably hits overbought tomorrow, so watch out. If FDAX goes down, we'll see futures go red in the morning.

RTY Premarket UpdatePosting premarket update because I showed it went oversold yesterday. MFI hit overbought already, don't chase it.

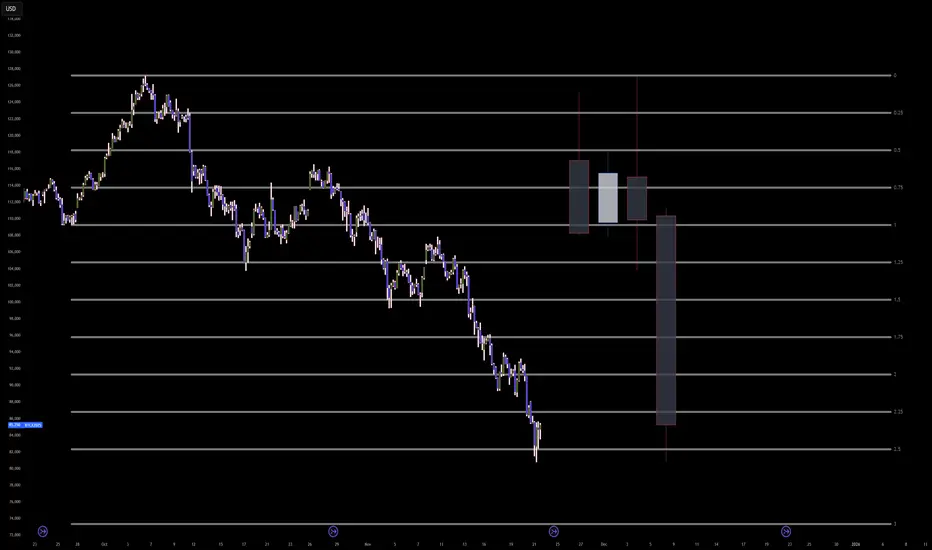
BTC CME Futures: The Capitulation Buy SetupSimply:
The logic here is simple.
Bitcoin has dropped too far and too fast.
We are currently hitting a major mathematical exhaustion point (the 2.5 Standard Deviation line).
At the same time, we are entering that big blue support box between 78k and 82k where the massive rally started earlier this year.
This is not a crash anymore; it is a bear trap.
Retail traders are panic selling right at the bottom, which provides the liquidity for big players to buy.
We are setting a limit order to catch the final wick down before the bounce.
Entry: 81,250 (Buy Limit)
Stop Loss: 77,500 (If it goes below here, the setup is wrong)
Target: 94,000 (The bounce back to equilibrium)
Don't chase the red candles.
Let the price come to you, fill the order, and wait for the squeeze.
____
Advanced:
The algorithm is currently executing a terminal volatility expansion into the 2.5 Standard Deviation extremity to finalize the Macro Sell Model and engineer a generational Smart Money Reversal.
The present liquidation cascade is not a crash but a precise, mathematically ordained delivery of price into the deep discount 'Blue Box' accumulation array to harvest the final sell-side liquidity before the grand repricing event.
Entry: 81,250.00 (Limit Order - 4,000 points below market)
Stop loss: 77,500.00 (3,750 points)
Take profit: 94,000.00 (12,750 points)
Risk to reward ratio: 3.40R
The Opportunity
The Bitcoin algorithm has been running a high-velocity sell program from the 126,000.00 highs, systematically dismantling every bullish PD Array.
However, we have now breached the Event Horizon. The price is magnetically drawn to the confluence of the 2.5 Standard Deviation projection and the historical Accumulation Block (78k-82k) originating from the early 2025 impulse.
This zone represents the 'Algorithmic Floor'—a region of maximum discount where institutional order flow must pivot from distribution to accumulation to close massive short positions and defend the macro bull trend.
The Entry
Do not chase the current candle. The algorithm demands a touch of the 2.5 Standard Deviation level at approximately 80,800.00 - 81,200.00 to complete the fractal expansion.
We place our limit order at 81,250.00 to front-run the absolute mathematical bottom, capitalizing on the 'Capitulation Wick' that will clear the final trailing stops.
This entry is timed for the CME close/open gap or the weekend volatility injection, which often targets these extreme deviation levels to trap late bears before a violent Monday reversal.
The Invalidation
The reversal thesis is ontologically corrupted if price displaces below the 3.0 Standard Deviation level and the bottom of the accumulation block at 74,000.00.
A sustained closure below this level signifies a total failure of the macro structure and a transition into a secular bear market, invalidating the accumulation narrative.
This would shift the probability manifold to the Primary Antithetical Chain, targeting the 60,000.00 liquidity void.
Key Trajectory Waypoints
Target 1: 86,000.00 | Type: Immediate Rebalance (2.25 SD) | Probability: 90% | ETA: 24 Hours
Target 2: 90,500.00 | Type: Internal Bearish Breaker | Probability: 75% | ETA: 3-5 Days
Target 3: 94,000.00 | Type: Equilibrium / FVG Fill | Probability: 60% | ETA: 1-2 Weeks
The Shadow Reality
A 25% probability exists for the antithetical reality: The Abyss Cascade.
In this scenario, the 2.5 SD level fails to provide a reaction, and the algorithm enters a 'Free Fall' discovery mode targeting the 3.0 SD at 74,000.00 immediately.
This reality is confirmed if price slices through 80,000.00 with no wick response.
___
tags: BITSTAMP:BTCUSD COINBASE:BTCUSD INDEX:BTCUSD BINANCE:BTCUSD
max pain in sight for the bullsgm,
i've been entertaining a few ideas on btc, and this one comes to mind today.
the possibility of 1 more leg down, to take the rest of the longs that fomoed into the rally this week, and the few who managed to survive the drop from ath by averaging down mindlessly.
---
the way we bounced is very reminiscent of a wave 4.
btc is teethering on the edge of a negative funding rate (our favorite contrarian indicator)
by creating one more low, we will for certain print a massive, multi-week negative funding reading, and that's when a proper buy could take place.
---
i have personally decided to fade the rally, and have de-risked quite substantially from the positions i managed to pick up near the lows.
---
in my opinion, the path of maximum pain is a sweep of that notorious 75k level that everyone keeps talking about.
---
---
🎯 - 75k

ADP data will determine the $4,200 mark.
news:
In the crucial window leading up to the Federal Reserve's December interest rate meeting, the US November ADP employment data, to be released today, has become the market focus. Its performance will directly influence the short-term direction of gold prices, with bulls and bears fiercely battling around the $4200/ounce level.
ADP Data: The "Final Piece of the Puzzle" Influencing Fed Rate Cut Expectations
As a leading indicator of non-farm payroll data, this month's ADP data is far more important than ever. Due to the US government shutdown, the official employment reports for October and November will be postponed to December 16th, lagging behind the Fed's December 9-10 interest rate meeting. Therefore, today's ADP data will be a core reference for the Fed's policy decisions.
Technical aspects:
Looking at the 1-hour chart, the key resistance level to watch is 4240-50, while the short-term support level is around 4200, with a significant support level at 4175. Technically, the current consolidation suggests a tendency to short on pullbacks. We should patiently wait for key entry points. Specific trading strategies will be provided in the channel; please pay close attention.
Gold prices are still trading above the 5-10 day moving average, and the downtrend has not yet been broken. After the $4,200 level is lost, gold prices may face further declines.
Strategy Signals:
Buy: 4225-4230 Stop Loss: 4240 Target: 4200-4180

XAUUSD – Potential Bullish Reversal Zone FormingPrice is currently trading above a key demand zone around the 4170–4185 region. This area has previously acted as strong support, and market reactions here suggest that buyers are still defending it. The recent push into this zone combined with the rejection wicks indicate potential accumulation.
Price is hovering around the 4200 psychological level, and if we see a deeper retest into demand, the structure allows for a possible bullish continuation scenario.

XAUUSD- Volume Profile AnalysisAt first glance, the chart may look a bit busy, but the structure is actually quite straightforward once you peel it off layer by layer.
The Fall
We start with the sharp October liquidation on the left. The volume profile over that entire downswing sets up a clean VAH-1, VAL-1, and POC-1, which are our key reference points for everything that follows.
Early November Rally
Early November price action is classic: price bases right around VAL-1, absorbs supply, and then launches into a swift breakout toward VAH-1. Textbook rotation from value-low to value-high.
Importance of VAH
VAH-1, as expected, caps the move and triggers a pullback right into the POC-2 of the November advance, which also happens to overlap with the prior breakout zone. A high confluence area where buyers stepped back in.
The Sharp Pullback to Retest
Price then coils around VAH-2, grinds higher, and retests VAH-1 but only to resist again. That repeated inability to hold above VAH-1 is a sign of pullback.
A Perfect Alignment
POC-3 and POC-4 line up almost perfectly, creating a stacked POC shelf and hence a structurally important zone. Add to that an active ascending trend channel that has been containing the structural swings also aligns with the POC shelf.
Potential Setup
Given this alignment, the 4075–4100 region becomes a potential demand pocket or a zone that could attract responsive buyers on any pullback, offering a comparatively low-risk long setup.
On the flip side, price could simply squeeze higher from current levels, ripping past 4250 into the old highs. But that scenario doesn’t offer favorable risk-to-reward for fresh longs as the risk of breakout failure remains high in an extended market.
But the real question is-
How do you read this tape? Are we staring at the late stages of a tired rally, or shaping up for a classic pullback-and-continuation structure?
Share your thoughts in the comment section below.
Thanks for reading.
📣Disclaimer:
Everything shared here is meant for education and general awareness only. It’s not financial advice, nor a recommendation to buy, sell, or hold any asset. Do your own research, manage your risk, and make sure you understand what you’re getting into.

Today gold reversal are you agree ? Trade Idea
Bias: BUY
Entry Zone: 4,185 – 4,197 (Demand Zone / Order Block)
Stop Loss: 4,184 (Below Demand Zone)
Take Profit Targets:
TP1 → 4,215
TP2 → 4,235
TP3 → 4,260
Why BUY?
Price is at a strong Demand Zone (support area).
Liquidity sweep below the zone may fuel a reversal.
Change of Character (ChoCH) forming on lower TF → short-term bullish signal.
Targets align with previous highs & supply zones (liquidity levels).
⚠️ Caution: Not financial advice. Trade carefully.

Unemployment claims trade ideaOnly looking for buys on gold because the feds will start cutting rates soon. I'm looking for buys above my pink line only if we get stronger U.S unemployment claims. I like this it follows the bigger picture of the feds cutting rates soon and because of the geopolitical tensions in South America

XAUUSD Setup Short📉 XAUUSD Setup Explanation
Gold just retested the 200 EMA / 50 EMA zone, which is acting as dynamic resistance. Price tapped into this resistance and showed rejection wicks, indicating sellers defending the area.
The structure is still bearish overall, and this retest offers a potential sell setup.
🔻 Short Setup
Entry Zone: 4200–4202 (resistance retest area)
Stop-Loss: Above the rejection zone at 4208–4210
Targets:
TP1: 4190
TP2: 4184
TP3: 4178
Reasoning:
Trend is still bearish on lower timeframes.
Price rejected EMA50 & EMA200 resistance.
Lower highs formation continues.
