CRUDE OIL Rebound Ahead! Buy!
Hello,Traders!
CRUDE OIL has been ranging
For a while now and the
Price is now about to
Retest the horizontal
Support level of 61.50$
From where a local
Bullish correction is
To be expected
Buy!
Comment and subscribe to help us grow!
Check out other forecasts below too!
Disclosure: I am part of Trade Nation's Influencer program and receive a monthly fee for using their TradingView charts in my analysis.
Futures market

XAUUSD--LONG--Bullish bias.
--tp and entry levels are as shown on chart
--for big picture check the weekly chart I published before. (I added below)

ID: 2025 - 0095.5.2025
Trade #9 of 2025 executed.
Trade entry at 137 DTE (days to expiration).
Trade construct is a PDS (put debit spread) at Delta 15 combined with a PCS (put credit spread) at Delta 15. Overlapping short strikes give it the "unbalanced" butterfly nomenclature.
Sizing and strike selection is designed to keep the risk/reward "AT EXPIRATION" to a 1:1 risk profile. This lets charm work it's magic (second order greek), while exploiting the fact that this is a non-directional bias. The process is a disciplined and systematic approach letting time decay evaporate the extrinsic time value from the short options until target profit is achieved.
OF NOTE: This trade opened at EXCELLENT fills, and there is zero risk to the upside. The danger is of a catastrophic move to the downside, which will bring in phenomenal gains for ID 006 and 008. 😊
Happy Trading!
-kevin

Has the pullback from the all-time high of $3,700 ended? Has the pullback from the all-time high of $3,700 ended? Gold awaits a new round of buying signals.
Spot gold prices fluctuated on Friday (September 19th), retreating from a high of $3,660/oz in early Asian and European trading. However, geopolitical risks led to renewed buying support, partially recovering the losses. Currently, gold prices are caught between a mix of bullish and bearish factors, facing upward pressure and downward support.
Positive Factors:
Geopolitical tensions continue to escalate: The Russia-Ukraine conflict has intensified, and the Middle East-Israel-Lebanon conflict has expanded, increasing gold's safe-haven appeal.
Expectations of a Fed rate cut persist: The Fed completed its first rate cut of the year on Wednesday and hinted at further easing amid a weakening labor market.
Negative Factors:
The US dollar rebounded strongly: Driven by Powell's hawkish comments and unexpected economic data (a decline in initial jobless claims and a significant rebound in the Philadelphia Fed manufacturing index), the US dollar continued to recover from its lows, suppressing dollar-denominated commodities.
A partial recovery in market risk sentiment is suppressing safe-haven demand and limiting gold's upside. Technical Analysis
Gold rebounded from a low near 3632 this morning. The initial upward move reached 3661 before retreating under pressure. It found support near 3643 before resuming its upward trend. The overall price center of gravity is shifting upward, maintaining a volatile upward trend.
The 3627-33 area currently remains a key dividing line between bulls and bears. While gold prices remain stable above this range, we recommend continuing to buy on dips. A further retest of the 3630-35 area could still present an opportunity to enter a long position. Be wary of a possible rapid short-term bullish rally, especially when disrupted by fundamental events, as the market is prone to emotional volatility.
Analysis on the 4-hour chart shows that core support remains concentrated in the 3627-33 area, which serves as a key defensive line for bulls. A successful break below this level could trigger a reversal in the bull-bear pattern. Key resistance above lies in the 3690-3700 area, with a breakout towards the 3710 area.
Trading Recommendations:
Go long on a pullback to the 3627-33 area, with a stop loss at 3618. Targets are 3690-3700. A breakout targets 3710.
Currently, we recommend positioning around key support and resistance levels. Remain cautious at intermediate levels, follow orders with caution, and patiently wait for an ideal entry opportunity.

XAUUSD--Ascending Channel--Bullish bias
--Looking at the sizes of the candles, we see momentum decreases. But it seems GOLD will rise more.At least up to the upper side of the channel.

Selling pressure weakensThe MCAD signal line is starting to flatten, and the RSI line is rising from the overbought area. This indicates that selling pressure is starting to weaken.

GOLD GOLD ,THE structure is bullish now on 4HR/3R AND ALL TIME FRAME,the weekend was a liquidity week and the correction at 3684 might hold or fail.
trading is 100% probability.
#gold #xauusd

Noise or pattern?Since february 2024 silver shows like gold a four phase pattern but with a higher frequency leading to a phase shift. What do you think. What are the causes for this cycles? Why is there a difference in the frequency and what will happen when both phases are congruent again?
Disclaimer
This content is for informational and educational purposes only and should not be construed as financial or investment advice. The author is not a registered financial advisor. Trading and investing in financial markets involve substantial risk of loss and is not suitable for every investor. Past performance is not indicative of future results. Always conduct your own research and consult with a qualified professional before making any investment decisions.

Gold XAUUSD Intraday Setup 19 SeptGold on the 15M timeframe is showing a short-term bullish structure after forming a series of higher lows, with the price now retesting the ascending trendline support near 3647–3650. This area also aligns with a minor demand zone, suggesting buyers are stepping in to defend it. If the trendline holds, momentum could push the market back toward recent highs, with the first target at 3674 (TP1) and extended target at 3685–3690 (TP2). However, if price closes below 3638, it would signal a break of structure and potential continuation of the bearish leg, so a stop loss below this level is crucial. Overall, the market is offering a favorable risk-to-reward long setup as long as the trendline is respected and no strong bearish candle closes below support.

Will gold prices continue to fall on September 19th?
I. In-depth Fundamental Analysis
Impact of Key Events:
Federal Reserve Interest Rate Decision: A 25 basis point rate cut as expected, triggering a "buy the anticipation, sell the reality" market
Powell's speech: The "meeting-by-meeting" approach was interpreted by the market as signaling uncertainty
Market Reaction: Investors chose to take profits, causing gold prices to fall rapidly from their historical high of 3707.
Positive Factors:
The long-term accommodative monetary policy environment remains in place.
Gold has risen 39% year-to-date and over 6% this month, demonstrating strong bullish momentum.
Safe-haven properties remain attractive in the long term.
Negative Factors:
Lack of new catalysts in the short term.
Significant profit-taking pressure (significant profit-taking above 3700).
The market needs time to digest the Fed's policy signals.
Fundamental Conclusion: The long-term bull market remains intact, but short-term fluctuations and consolidation are needed to digest gains and rebuild momentum.
II. Technical Analysis
Trend Structure:
Main Trend: Intact bullish pattern (upward trend on the daily chart)
Minor Trend: High-level oscillation (consolidation on the 4-hour chart)
Short-term Trend: Range-bound (convergence on the 1-hour chart)
Key Price Levels:
Support System (Level 3):
Immediate Support: 3645 (Yesterday's low, psychological support)
Important Support: 3635 (overlapping Bollinger Band + 60-day moving average)
Trend Support: 3620-3610 (bullish lifeline, breakout is likely to lead to a rebound). Trend turns bearish)
Resistance System:
Short-term Resistance: 3660-3670 (Key Resistance Zone in the Asian and European Sessions)
Upward Resistance: 3675, 3690
Strong Resistance: 3707 (Historical Double Top Resistance Level)
Technical Pattern Characteristics:
Daily Chart: A bearish pullback from a high level, but without breaking the unilateral moving average support system
H4 Chart: Bollinger Bands closing and moving averages converging, indicating a consolidation pattern
Important Signal: Two tests of 3707 have formed the prototype of a double top, requiring a breakout for confirmation
III. Comprehensive Trading Strategy
Main Idea: Range-bound trading, with phased long positions at support levels.
Trading Plan:
Long Position (Main Strategy):
Aggressive Long Position: 3640-3645 (Light Position for Testing)
Conservative Long Position: 3630-3635 (Opportunity to Increase Positions)
Core Long Position: 3620-3610 (Trend Long Position)
Target: 3660 → 3675 → 3690
Stop Loss: Below 3605 (Effective Breakout)
Short Position (Supporting Strategy):
Entry Zone: 3665-3675 (Stagflation Signal)
Target: 3650 → 3640 → 3635
Stop-loss: above 3685
Breakout Trading Strategy:
Break above 3710: Buy on pullbacks, target 3730-3750
Break below 3605: Short on rebounds, target 3580-3550
IV. Risk Control System
Position Management:
Main Strategy Position: 5-8% (Planned)
Breakout Trading: 3-5% (Follow the trend)
Total Position: ≤10% (Strict Position Control)
Summary: Prioritize intraday trading in the 3620-3670 range, focusing on the defense of the 3620 support level. Conservative traders should wait for opportunities at key levels, while aggressive traders should test the market with a small position. Following a breakout, follow the trend, but maintain strict position and risk control.

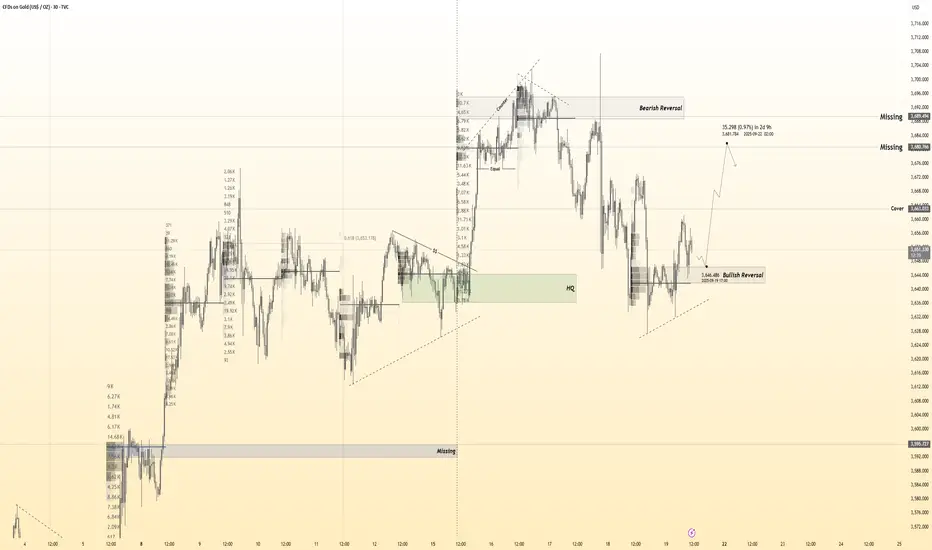
Gold next Week Move PredictionWhen the market opens next week, gold is expected to retest 3684 and then reverse back into a selling trend.

Not as Bullish as it Seems - ES Futures
Its not often that you see this many points of control unfilled. I have removed the Volume Profile to make a point.
When the market finished with a level, often it will return to it to "check it off" - as shown in the red circles. There are buyers waiting there and liquidity - after all that was the most traded price for that day.
Sometimes I've noticed - that there will be a close double line that goes untouched. Much like accounting - it means work completed. Price will move much higher. This isn't anything I've been taught but after looking screens for years something I've observed, we have that here too.
Bottom line these lines get filled - but when I see this many, I get a little concerned. What's going on that we are not hearing in the news. Japanese Bond market blowing up? Dems won't has a budget? Point is something is going on.
Actionable idea?
Sure buy a Call Bear spread in the SPX at the money (Remember the ES is about 50 points higher than the SPX)- 30 days out and target the highest Point of Control under the yesterdays - with a 20 Point spread at the money the risk/reward is your favor. Most likely than that one will get filled - in the next 7 days but 30 days gives you time.

Gold Analysis on September 19th
Gold experienced a period of highs and lows this week. On the day of the Fed's decision, the price fluctuated between 3650 and 3707, closing with a medium-sized negative candlestick on the daily chart. The following day, the price converged, trading between 3633 and 3672, with another small negative candlestick on the daily chart, marking the first two consecutive negative candlesticks since the rally from the 3311 low.
Structurally, despite consecutive negative candlestick pullbacks on the daily chart, the bullish trend remains intact, and the market is currently in a period of high-level consolidation within the trend continuation phase. Key support below is 3615, while a break above 3672 is crucial.
Operationally, if the price rebounds to the 3688-3692 range, consider entering a short position with a stop-loss above 3700. Downside targets include 3672, 3660, and 3654.
It should be noted that despite the short-term adjustments on the technical side, the medium-term bullish logic for gold remains solid, supported by geopolitical uncertainty and risk aversion, and the bull market is expected to continue after this round of adjustments.

Gold 30Min Engaged ( Bullish Reversal Entry Detected )Time Frame: 30-Minute Warfare
Entry Protocol: Only after volume-verified breakout
🩸Bullish Movement from - 3647
➗ Hanzo Protocol: Volume-Tiered Entry Authority
➕ Zone Activated: Dynamic market pressure detected.
The level isn’t just price — it’s a memory of where they moved size.
Volume is rising beneath the surface — not noise, but preparation.
🔥 Tactical Note:
We wait for the energy signature — when volume betrays intention.
The trap gets set. The weak follow. We execute.
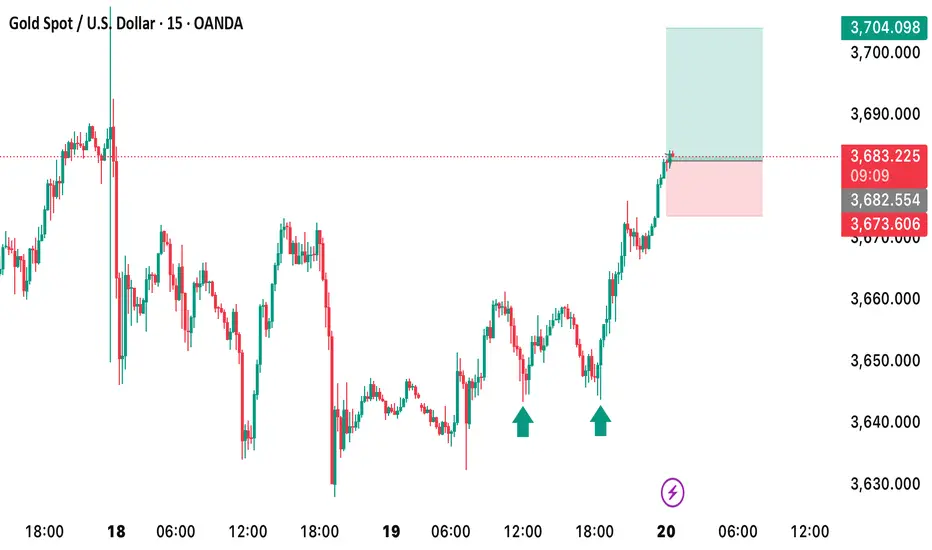
Xauusd analysis Gold is trading around $3,683.22, showing a +1.07% daily gain.
Setup Displayed:
Entry zone: Around 3,683.2
Take Profit (TP): ~3,704.1
Stop Loss (SL): ~3,673.6
Risk–Reward Ratio: About 1:2.1, which is favorable.
Today's Gold Trading Recommendation From the 4H chart analysis, the effective support level remains around the 3620, a key defensive support zone to focus on currently. If this level is breached further, the bull-bear dynamic may shift in the future. On the upside, the key resistance lies in the 3700-3710 range.
In terms of trading operations, plan long and short positions within this range. For prices in the middle of this interval, it is advisable to watch more, trade less, avoid chasing trades recklessly and wait patiently for entries at key levels.
Buy 3630 - 3640
TP 3650 - 3660 - 3670
Daily-updated accurate signals are at your disposal. If you run into any problems while trading, these signals serve as a reliable reference—don’t hesitate to use them! I truly hope they bring you significant assistance


Gold short-term support levels to watch for FOMCInitial support comes in at $3655/50 area, followed by $3564, before the focus turns to the more significant $3,500 level. Will we see a dip to any of these levels today, and get a bounce? Well, a lot depends on the FOMC.
Yesterday saw sold and stock averages both pulled back in unison from record highs ahead of the FOMC rate decision, suggesting the move was driven by profit-taking. The dollar’s renewed drop against the yen and yuan today suggests the gold selling may be limited and the metal could even rally to a new high if the Fed turns out to be a little more on the dovish side of things today.
From a macro point of view, today's housing market data disappointed with both housing starts and building permits fall. This comes on the back of retail sales data from yesterday, which rose more than expected, but does it matter? Well, the retails data suggests it is not all doom and gloom out there, but this is probably too little too late to prevent a rate cut today. The Fed has clearly signalled it will trim rates and everyone expects them to do so. But the recent dollar selling was never about this week’s likely rate cut. It was all about whether we will get one or two more cuts before the year is out. Well, the jury is still out on that, as surely one retail sales report is unlikely to sway the Fed in one or the other direction. So, from a rate cut perspective, traders may take the retail sales beat in their stride and continue to buy dips in foreign currencies and gold.

Gold is about to experience a brief correction!Gold is being supported near the \$3,630 level on the 1-hour chart. A short-term downward correction toward this area is expected. A break or rebound from this level will determine the next direction of the price.

Gold pulled back after printing a fresh highGold pulled back after printing a fresh high and reacting to the latest FOMC meeting. It has since broken below key support and also violated its ascending trendline.
In the short term, price action is expected to remain range-bound to bearish, heading toward the next support zone.
As long as price remains below the broken trendline and resistance, the short-term bias stays bearish to sideways.
However, in the medium term, the overall outlook remains bullish, and a fresh upside wave may develop once the correction is completed.


THE KOG REPORT - UpdateEnd of day update from us here at KOG:
What a week! Our path worked well from Monday-Wednesday which is when we published the FOMC Report, which also worked extremely well on the red box indicator and hot spots. Yesterday we wanted that low for a push up and as you can see now, the move is in progress.
It's too late in the session now to attempt anything other than a scalp, but ideally the entries long are from the red box level which was given yesterday. We now have resistance at the 3695 region with support 3664 which needs to hold. The race for the close is on!
Wishing you all a great weekend ahead and we'll see you on Sunday for the KOG Report and our view for the week.
Please take some time to hit the boost button on our ideas and we appreciate the following.
As always, trade safe.
KOG

Continuation bullishif price breaks resistance bullish , mostly price will retrace then continue for challenge resistance at h4.
