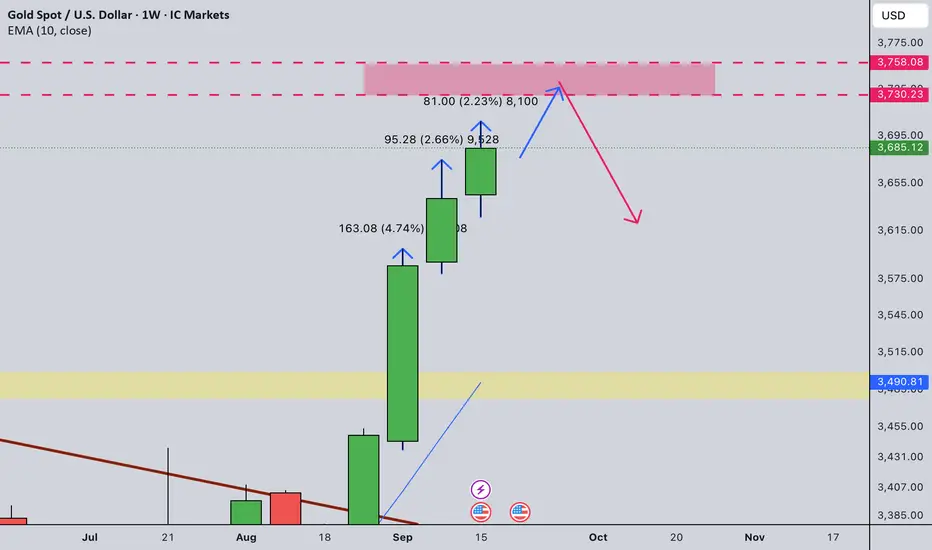
Gold Weekly Summary and Forecast 9/20/2025Gold has been rising for the past four weeks. For the past three weeks, price is rising 4.74%, 2.66% and 2.23%. It is showing sign of exhausting. However, as long as weekly is not closed in red bar, bulls still not loses its control yet and bears need more power to take over.
As such, next week should be critical for bears. I am expecting price to rise to 3730-3758 zone first and drop from there.
Let's see how the market plays out next week.
Futures market
GOLD WEEKLY SUMMERY.GOLD ,THE daily structure is strongly protected by a demand floor,the daily line chart close at the demand floor level, is 3640,3634,3626 ,the dollar index daily rejection during newyork time at 97.803 was enforced BY 12;00 AND 13;00 that made GOLD to skyrocket from the neckline of the double bottom at 3644 to close 3685 breaking every strategy for sell. The strong double bottom structure from the 4HR line chart ,the neckline was retested at 4HR close in the zone 3644-3647, and GOLD BUYING closed the week 3685 AGAINST ALL ODDS AND STILL looking to reclaim 3700 next week with a possibility of a new all time high at 3723-3725-3730 zone based on the rule of selling from the ascending trendline supply roof on 4HR .THE next touch could be 3730-3725 bound.
But at the moment, we have a supply roof from a lower 4-hour cross as a potential rejection zone 3697-3700. If this zone is respected, we could get a correction to keep buying GOLD .
I WILL NOT ADVISE ANYONE TO TRY TO SELL GOLD UNTIL THE DAILY BREAK OF DEMAND FLOOR.
WE KEEP BUYING AND ALLOW OTHERS TO SELL ,THEN WE LOOK FOR A BUY OPPORTUNITY.
GOLD BUY/SELL IS RELATED TO REAL LIFE PHYSICAL GOLD PRICE IN THE MARKET ,SO TAKE IT SERIOUSLY.
GOODLUCK
#XAUUSD #GOLD #SILVER #COPPER #US10Y #DOLLAR #DXY

FCPO Weekly Roundup: Week Ending Sep 19, 2025📊 The Technical Take
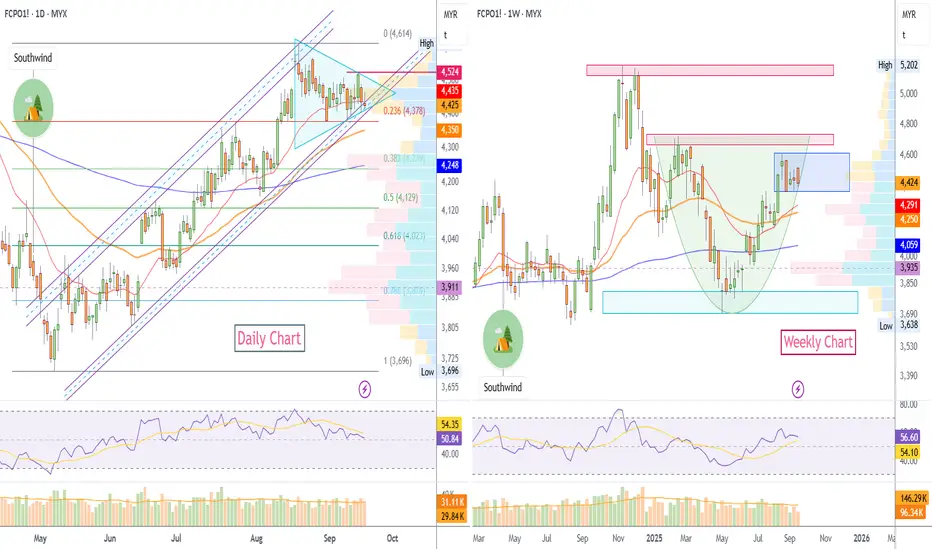
The charts show a classic standoff between long-term strength and short-term indecision!
📈 Long-Term Bullish: The big picture (weekly chart) shows a powerful **"Cup and Handle"** pattern forming. This is a very strong bullish sign for the months ahead! ☕️
🧘 Short-Term Pause: The daily chart shows the price is coiling tightly in a "Symmetrical Triangle"
🔺 The market is taking a breather and building energy for its next big move.
🌍 The Fundamental Story
It's a classic tug-of-war between strong demand and rising supply.
🟢 THE BULLS (Demand):
🟢 India's Unstoppable Demand: India 🇮🇳 is currently the powerhouse driver of the market. Imports surged by over 15% in August to a 13-month high! This is fueled by massive restocking for their festive season and palm oil's significant price advantage over competing oils. This strong demand is expected to continue, absorbing any new supply.
💰 Good Price : Palm oil's price advantage over soyoil is keeping buyers interested.
💧 The Biodiesel Boost : Don't forget the structural demand! Government mandates in both Indonesia and Malaysia for higher biofuel blending (B40) are permanently removing millions of tons of palm oil from the food market, creating a tighter long-term supply balance that is very supportive of higher prices.
🌏 Strong Global Exports : Beyond India, overall export numbers from Malaysia have been improving, showing that global demand remains robust and is successfully absorbing the seasonal increase in production.
🔴 THE BEARS (Supply) :
- 🌿 Harvest Pressure : It's peak production season in Malaysia & Indonesia, meaning more supply is hitting the market.
- 📦 Stocks are Up : Inventories in Malaysia are at a 2-year high.
👀 Outlook for the Week Ahead
The market is perfectly balanced and waiting for a catalyst. The key is to watch the symmetrical triangle on the daily chart!
🎯 Bullish Scenario : A breakout **ABOVE** the triangle signals that strong demand is winning. This could kick off the next leg up!
⚠️ Bearish Scenario : A breakdown **BELOW** the triangle would mean that supply pressure is taking over, and we could see a deeper price correction.
In short: The market is coiled like a spring. Watch for the breakout to see which way it pops! 🚀
GOLD GOLD ,THE daily structure is strongly protected by demand floor,the daily line chart close demand level is 3640,3634,3626 and we have a strong double bottom structure from 4hr line chart ,the neckline was retest at 4HR close at 3644 and GOLD BUYING close the week 3685 AGAINST ALL ODDS AND STILL looking to reclaim 3700 next week and possible new all time high at 3723-3725-3730 zone based on the rule of selling from the ascending trendline supply roof on 4HR .THE next touch could be 3730-3725 bound.
but at the moment we have a supply roof from a lower 4hr cross as a potential rejection zone 3697-3700 ,if this zone is respected we could get a correction to keep buying GOLD .
I WILL NOT ADVISE ANYONE TO TRY TO SELL GOLD UNTILE DAILY BREAK OF DEMAND FLOOR.
WE KEEP BUYING AND ALLOW OTHERS TO SELL ,THEN WE LOOK FOR BUY OPPORTUNITY.
GOLD BUY/SELL IS RELATED TO REAL LIFE PHYSICAL GOLD PRICE IN THE MARKET ,SO TAKE IT SERIOUSLY.
GOODLUCK
#XAUUSD #GOLD #SILVER #COPPER #US10Y #DOLLAR #DXY

XAUUSD UPDATE Still flyAfter made a minor correction 3625-3708 range, Gold still want to make a higher high....NEW ATH on next week ?
Target 3750-3780 range.
Have a blessing week ahead 1

Latest Gold Price Update Today👋Hello everyone, let's take a look at OANDA:XAUUSD !
Yesterday, gold experienced a volatile trading session after the Federal Reserve (Fed) concluded its September meeting and decided to cut the benchmark interest rate by 0.25%, as expected. The reference interest rate is now at 4-4.25% per year.
Typically, when the Fed cuts interest rates, the US Dollar weakens, which boosts demand for gold. However, this time, the rate cut led investors to sell gold to take profits. The main reason is that the rate cut aligned with previous expectations, and gold prices had already surged in anticipation, making the market less surprised by this move.
From a technical perspective, gold is currently hovering around the 3,670 USD level and is gaining momentum from the support zone. I think the current phase is a healthy correction before the bulls take action again. Today's unemployment claims data will set the stage for the next move.
What do you think about the trend of XAUUSD? Leave your thoughts in the comments!

SOFR Futures: Understand Market Pricing for future Fed PolicyWith the Federal Reserve having just cut interest rates and guiding towards further cuts this year and through 2026, I have received several requests to explain how traders can understand for themselves what the market is pricing and expecting for Fed policy by a specific point in time.
Perhaps the more simplistic way to view what is priced or implied for the next FOMC meeting is to use the ‘FedWatch’ tool on the CME's website - www.cmegroup.com . This looks at the distribution of expectations for the next FOMC meeting, as implied in the fed funds futures pricing.
Interest rate futures can guide our understanding of what’s priced
One way traders can gauge the market’s expectations for future Fed policy—commonly referred to as “what is priced in”—is through interest rate futures pricing or in interest rate derivatives (interest rate swaps, for example). These are tradable instruments that allow investors and corporates to hedge their interest rate risk, while also giving speculators a vehicle to express views on where they see Fed interest rate policy at a specific point in time.
TradingView doesn’t offer pricing on IR swaps, but it does offer pricing on SOFR 3-month futures and Fed funds futures, both of which can be useful in understanding where the market sees policy risk. My preference is SOFR futures, as they are comparatively more liquid, especially in the further-dated contracts for 2026 and 2027 and are more heavily traded than Fed funds futures.
What is the SOFR rate?
SOFR is one of, if not the most important, markets in the entire financial ecosystem. It is the first derivative of markets and is worth taking a moment to familiarise yourself with.
SOFR (Secured Overnight Financing Rate) essentially represents the interest rate at which financial institutions lend cash overnight (and what borrowers pay), with borrowers pledging US Treasuries as collateral.
The Federal Reserve influences SOFR through its monetary policy settings, with the rate typically tracking within the Fed’s target corridor. This corridor is defined by the upper bounds and what the Fed pays banks on reserves (currently 4.25%) and the lower bounds and what the Fed pays financial institutions that lend overnight repo to the Fed (the ‘RRP rate’, currently 4%).
SOFR 3-month futures, therefore, reflect the market’s expectations of what the overnight risk-free rate will average over a defined three-month period at a forward point in time.
For example, the SOFR 3-month December 2026 futures contract (TradingView code: SR3Z2026 ) reflects the market’s expected average interest rate on overnight cash borrowing from December 2026 through to the contract’s expiration on 16 March 2027.
Since SOFR is guided by the Fed’s policy corridor, the futures price on that contract provides an indication of where the Fed could set interest rates at a given point in time.
Calculating the markets expectations for future Fed policy from SOFR futures
The price of SOFR 3-month futures moves dynamically through supply and demand, with rates traders reacting to economic data, Fed communications, sentiment in other markets (such as equities), and liquidity conditions. Upon expiration, futures are cash settled at 100 (or “par”), so the implied interest rate for a set contract is calculated as 100 minus the futures price.
For example, if SR3Z2026 trades at 96.99, the implied rate for the SOFR between Dec 2026 and 16 March 2027 is 3.01% (100 – 96.99). If the current SOFR spot rate (TradingView code: SOFR) is 4.38%, this therefore implies that the market is pricing 139 basis points of further Fed rate cuts by early 2027.
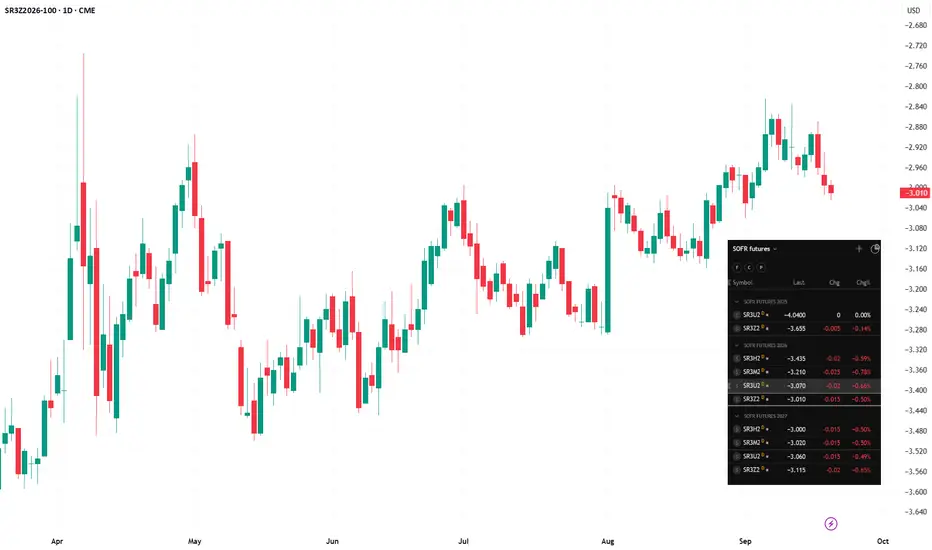
You can add all the SOFR 3-month futures contracts to a watchlist in TradingView, ordered by the contract period. For instance, starting with SR3U2025 (the September SOFR futures expiring on 16 December 2025).
As we see in the screenshot, based on today’s curve, the perceived low point—or the pricing for the “terminal” rate—in the Fed’s cutting cycle is seen in the December 2026 contract, at 2.99%.
Why is this useful for all traders?
Firstly, it provides a clear guide to the market’s view of future Fed policy and what is currently already discounted in interest rate markets. This matters because the USD, US Treasuries, equities, and even gold tend to move in line with—or inversely to—shifts in interest rate futures pricing.
If the market has fully priced in a rate cut, then when the Fed delivers that cut, the market reaction should be minimal. Conversely, if the market expects little or no cut and the Fed surprises by cutting rates, one can expect an outsized reaction in assets like the USD or US 2-year Treasury yields.
This makes SOFR futures incredibly helpful for traders across asset classes when managing risk around key data releases or Fed meetings.
They can also help assess perceived recession risk. If the Fed’s “neutral rate”—the equilibrium setting that is neither stimulatory nor restrictive—is 3%, and the market prices the terminal rate in the cutting cycle at the same level, this suggests a low probability of recession. A recession risk scenario would likely see the market pricing the Fed’s terminal rate well below 2.5%.
Given how often the question “how do I know what’s priced in?” comes up, I hope this offers a clear framework for assessing it through SOFR futures on TradingView.
Good luck to all
THIS IS MY EXPECTED BULLISH MOVE THIS COMING WEEKBookmark it somewhere, I will probably post it again and explain it tomorrow or lately by Monday before New York session, don't take it for granted though, I will also update it on Monday when the market present any little changes which wouldn't be any significant change unless the market decide to change to bearishness, which i dont think it's going to happen.

GOLD GOLD ,THE structure is bullish now on 4HR/3R AND ALL TIME FRAME,the weekend was a liquidity week and the correction at 3684 might hold or fail.
trading is 100% probability.
#gold #xauusd

XAUUSD WEEKLY PROFILE 22 SEP TO 26 SEP 2025📊 Weekly Gold (XAU/USD) Outlook
Date: Sept 23 – Sept 27, 2025
🔎 Market Overview
Gold (XAU/USD) is currently trading around $3,685 after consolidating in recent sessions. The market structure indicates that price may attempt another push higher before a potential corrective move. Key levels on both the upside and downside are likely to influence the coming week’s price action.
📈 Bullish Outlook
Resistance Zone: $3,720 – $3,730 (Fibonacci Extension).
Price is expected to test or slightly breach the all-time high at $3,707.
A short-term bullish move from current levels could materialize, targeting this resistance zone.
📉 Bearish Outlook
From the $3,720–3,730 resistance, price is likely to face selling pressure.
A pullback into the H4 demand zone / Fair Value Gap ($3,655–3,665) could provide a temporary buying opportunity.
However, a deeper move is anticipated, with price expected to take out the previous weekly low ($3,648).
After liquidity is cleared, price may extend towards the Weekly Fair Value Gap ($3,595–3,620).
🎯 Key Levels to Watch
Resistance: $3,707 (All-Time High), $3,720–$3,730 (Fibo Extension).
Support / Demand Zones:
$3,655–3,665 (H4 OB / FVG).
$3,595–3,620 (Weekly FVG).
Liquidity Levels: $3,648 (Previous Weekly Low).
⚖️ Trading Strategy Notes
Short-Term: Look for bullish continuation into $3,720–3,730 before reversal.
Medium-Term: Expect bearish retracement after highs are tested, targeting $3,648 and possibly $3,595–3,620.
Risk Management: Key reversal zone sits at $3,720–3,730; invalidation of bearish bias above $3,750.
✅ Summary:
Gold may see an early-week rally towards $3,720–3,730, but this zone is likely to act as a major reversal point. A corrective move lower is expected, with targets at $3,648 and potentially $3,595–3,620 in the coming sessions.

XAUUSD--LONG--Bullish bias.
--tp and entry levels are as shown on chart
--for big picture check the weekly chart I published before. (I added below)

Gold Under Pressure - Is the Downtrend Just Beginning?Hi everyone, it’s Ken!
On the 2H chart, after careful observation, we can see a RISING WEDGE pattern forming. After XAUUSD broke the previous uptrend and completed its correction phase, there's a high likelihood that a new bearish trend will emerge, continuing the short-term downtrend we've seen recently.
Ken's target is to push the price below 3,630, aiming for a further low at 3,608 – this level perfectly aligns with Fibonacci 1.618.
What about you? Do you think XAUUSD will continue to drop, or is there a chance for a reversal to the upside? Share your thoughts and targets in the comments!

Gold (XAU/USD) 4H Outlook – Two Possible Scenarios AheadGold is trading inside a rising channel on the 4H timeframe, approaching a key resistance zone (3,685–3,700). From here, I see two potential scenarios:
🟢 Bullish Scenario
A breakout and 4H close above 3,700 could signal continuation higher.
Retest of the 3,690–3,700 zone as support would strengthen the case for upside.
Next target sits around 3,750–3,770 (upper channel boundary).
🔴 Bearish Scenario
Failure to break above 3,700 and rejection from resistance may trigger a pullback.
A break below the 0.5–0.618 Fibonacci retracement zone (3,643–3,626) would add bearish momentum.
Downside target extends toward 3,580 (major demand zone).
Both paths are possible – price action confirmation around the 3,690–3,700 zone will be key to determine direction.

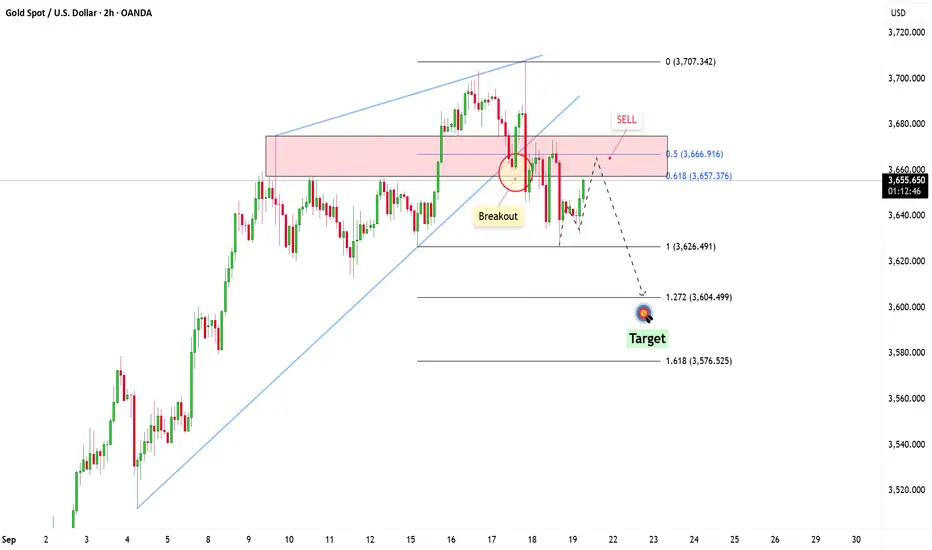
Gold Faces Major Resistance: Is a Sharp Decline Imminent?Hey everyone, looking at XAUUSD today, I noticed something quite interesting. Gold has reached an important resistance level, one that in the past has acted as a strong barrier, pushing the price down. This area has also been a strong supply zone, where sellers have previously taken control of the market. Therefore, it becomes a "hot" spot for those looking for shorting opportunities.
If the price starts showing bearish signals, such as rejection wicks, bearish candlestick patterns, or signs of weakening buying pressure, I think there's a good chance we could see a drop towards 3,604, and possibly even lower to 3,5XX if the selling pressure remains strong. However, if the price breaks this resistance clearly, the bearish outlook might be invalidated, and we could see a further rally.
This is just my personal view on the support and resistance levels, not financial advice. Always double-check your signals and ensure proper risk management.
Good luck with your trades!
Uptrend in silverCurrently, according to the previous analysis, the trend of silver is completely bullish. We have two scenarios. If the price breaks the first range downwards, we can expect a price correction in silver, otherwise the trend is completely bullish.

XAU/USD – Captain Vincent Weekly Plan🔎 Captain’s Log – Context
📈 Main Trend : Strong uptrend after BoS.
📊 Price moving sideways within the rising channel, staying below Weak High 3674 .
📌 EMA 50 > EMA 200 → bullish trend remains solid.
🎯 Captain’s Map – Trading Scenarios
1️⃣ Golden Harbor (BUY – Main Priority)
🎯 Entry:
FVG Dock: 3602 – 3593
FVG Deep: 3567 – 3560
OB Harbor: 3535 – 3540
⛔ SL: below 3520
✅ TP1: 3674 (sweep Weak High)
✅ TP2: 3720 – 3740
2️⃣ Quick Boarding (Short-term SELL – Counter-trend)
Condition: If price breaks 3674 first → watch for false break.
🎯 Entry: 3670 – 3680
✅ TP: back to 3602 – 3567
⚠️ Note : scalp only, don’t hold long.
3️⃣ Storm Breaker Alert (Bearish Scenario)
If 3535 breaks → short-term uptrend invalidated.
🎯 Bearish target: 3480 – 3500
Captain’s Note ⚓
“The golden sail still catches the wind after BoS, leading the captain and crew on the bullish tide. Golden Harbor 🏝️ (3593 – 3560 – 3535) remains the preferred docking point to load cargo and continue the voyage. Quick Boarding 🚤 at Storm Breaker 🌊 (3670 – 3680) is only a short ride when the ship sweeps liquidity at Weak High 3674 . Should 3535 break, the ship might be dragged toward 3480 – 3500, but as long as it anchors at Golden Harbor, the grand journey still heads north toward 3720+.”

Gold Weekly OutlookIf we stay in the older trend we going up but there is a greater chance it will spike up on market open to 3648 - 3653 and then sell off.
If so we might follow the new trend. Mondays as normal is a no trade day to see what the market does.

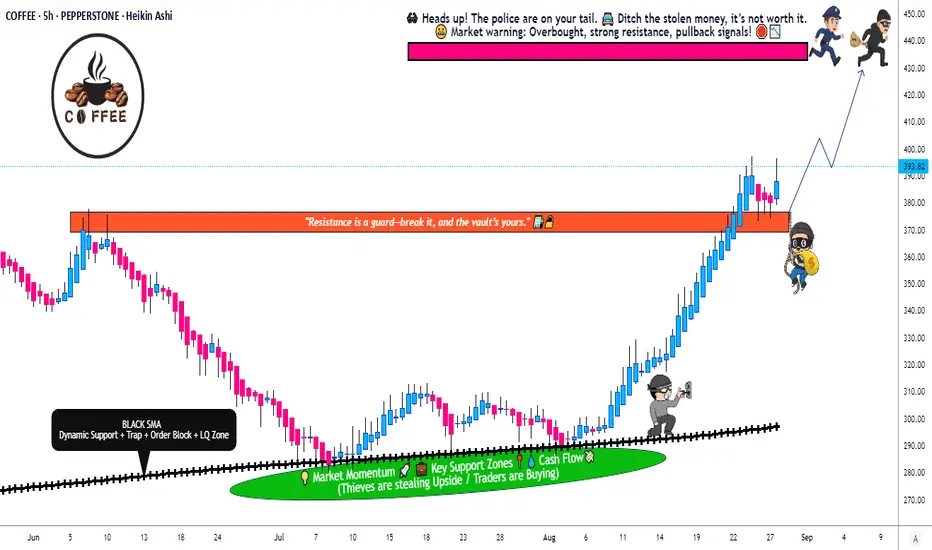
Coffee Heist: Are You Ready for the Bullish Layup?🚨☕ "COFFEE" Heist Plan – Swing/Day Robbery 🚨
🌟 Hola! Ola! Bonjour! Hallo! Marhaba! 🌟
Dear Robbers & Money Makers 🤑💰💸✈️
Based on 🔥 Thief Trading Style Analysis 🔥 here’s our master heist plan to rob the "COFFEE" Commodities CFD Market.
🎯 Plan: Bullish Robbery
Entry 📥: Any price level – Thief always sneaks in at any vault door.
👉 But remember: Thief Strategy = LAYERED ENTRY ⚡
Multiple Buy-Limit Layers:
(390.00) 🏦
(380.00) 💎
(370.00) 🎭
(360.00) 🔑
(Add more layers based on your own robbery plan)
Stop Loss 🛑:
This is Thief SL @ 340.00 ⚔️
Dear Ladies & Gentlemen (Thief OG’s) – Adjust your SL based on your personal robbery strategy & risk appetite.
Target 🎯:
⚠️ Police barricade spotted @ 440.00 🚔
So escape early with the loot @ 430.00 💸 before getting caught!
🏴☠️ Thief Notes:
Our heist is in the bullish zone 🚀
Layer in carefully, don’t rush 💎
Always manage risk – the cops (market makers) are watching 👮♂️
Use alerts, trailing SL & risk management to protect your stolen bags 💰
💥 If you’re riding with the Thief crew – Hit Boost 🚀 & Share Love ❤️ – that fuels our robbery strength!
We rob, we trade, we escape – That’s the Thief Way! 🏆🐱👤
#ThiefTrader #CoffeeHeist #CommoditiesCFD #SwingTrade #DayTrade #LayerStrategy #BuyTheDip #TradingPlan #ForexRobbers #MarketHeist
XAUUSD Long 1HThe trend still bullish, if u trade for a day u can set the TP and SL like on the chart above.

XAUUSD--Ascending Channel--Bullish bias
--Looking at the sizes of the candles, we see momentum decreases. But it seems GOLD will rise more.At least up to the upper side of the channel.


GOLD (XAUUSD) H1📊 GOLD (XAUUSD) H1 Setup
🔹 On H1, the FVG has now converted into an Inversion FVG.
🔹 At the same level, we also have an Order Block.
👉 Our plan: As soon as price retests the Order Block, we’ll look for Buy setups with confirmation on the lower timeframe.
✅ Smart entries only with patience and confirmation.

Gold Buy Setup — Intraday Idea💹 Entry: 3678
🛑 Stop Loss: 3676
🎯 Target: 3750
Price is holding above the key support zone. A long position is initiated at 3678, with a tight stop below at 3676. The upside potential targets the 3750 level, aligning with the next resistance zone.
Risk is minimal with a favorable risk-to-reward ratio. Monitoring price action closely for confirmation.
📊 This is an educational idea, not financial advice.
