XAUUSD Potential Reversal Zone & Bullish Channel Projection (45-1. Price Action Context
Gold (XAUUSD) has been in a short-term downtrend, shown by a sequence of lower highs and lower lows.
Price is currently trading around 4113 after a sharp drop.
2. Key Zone: RESISTANCE Turned SUPPORT
The highlighted red zone around 4081 – 4103 is marked as a major support / demand zone.
This appears to be a level where buyers are expected to step in.
The squiggly black arrows indicate a possible liquidity grab or fake breakout before the true move begins.
3. Projected Bullish Recovery
The gray vertical projection box and upward channel lines suggest the author expects:
A bounce from the 4081–4103 support
A move up through the channel
A potential target around 4220, which aligns with the upper boundary of the projected ascending channel.
4. Trend Channel
A rising channel has been plotted, projecting the potential direction over the next sessions.
Price bouncing inside the lower area of the channel suggests:
The down move might be ending
Momentum could shift toward a bullish correction or even a trend reversal
5. Key Levels Highlighted
Support zone:
4,081.888
4,103.142
Bullish target:
4,220.041
These levels are visually marked and consistent with a reversal strategy.
🧭 Overall Interpretation
This chart proposes a bullish reversal setup, with traders watching for:
A potential liquidity sweep at the support zone
A bounce and consolidation
A climb toward the upper channel area, with 4220 as a projected target
This is a counter-trend reversal idea, so confirmation would be crucial (rejection wicks, bullish candle structures, RSI turning up, etc.).
Futures market

Gold faces a test at 4100; time to prepare for positioningGold’s Downtrend Intensifies:
The decline in gold has accelerated, with the previous support at $4,150 now decisively broken. Based on prior price action, the next key support is located near $4,100, a level that the market tested twice during the earlier consolidation phase but failed to break, indicating strong structural support.
At the same time, the ascending trendline also converges near this area, adding further reinforcement to the support zone.
Therefore, $4,100 can be considered the key pivot level going forward. Should this level be breached, gold could face deeper downside risk, with a potential move back toward the $4,000 psychological level not out of the question.
However, as noted, the $4,100 area carries significant support, so monitoring the price reaction closely will be crucial. If this level holds, long positions may be considered.
If $4,100 breaks decisively, I believe momentum shorts (trend continuation trades) become viable.

ElDoradoFx – GOLD ANALYSIS(14/11/2025, LONDON SESSION)1️⃣ Market Overview
Gold begins the London session trading around $4,178–$4,183, recovering after an early sweep toward $4,159 and bouncing back into the intraday structure.
Despite this recovery, price remains below the broken ascending trendline, which now acts as resistance, and under the broader descending trendline from $4,245.
The current movement suggests a corrective pullback, with sellers defending the $4,183–$4,192 zone, as gold forms lower highs intraday. London volatility will determine whether the market rejects this retest (bearish continuation) or breaks above it (bullish reversal attempt).
⸻
2️⃣ Technical Breakdown
🔹 Daily (D1)
• Gold maintains a mid-recovery structure, holding above the 100EMA and trying to build above the 10EMA.
• RSI ~61 shows mild bullish momentum but not strong enough to break the long-term descending trendline.
• Major support remains at $4,028–$4,090, with resistance at the compression ceiling near $4,192–$4,209.
🔹 1H Chart
• Structure remains bearish-to-neutral, following a clean BOS down from $4,209 into $4,159.
• Current bounce is just a retest of the broken trendline.
• RSI around 46 and MACD red but flattening → early signs of indecision, not reversal.
• Critical resistance sits at $4,183–$4,192, aligned with retest structure + EMA cluster.
🔹 15M–5M
• Intraday shows a BOS to the downside, then a corrective pullback.
• Price is reacting inside a tight compression wedge between trendline resistance and EMAs.
• Momentum on lower timeframes suggests sellers are waiting for rejection confirmation at $4,183–$4,192.
⸻
3️⃣ Fibonacci Analysis
Last swing: 4,245 → 4,159
• 38.2% = 4,192
• 50.0% = 4,202
• 61.8% = 4,212
🎯 Golden Zone: 4,192 – 4,212
This is the primary high-probability sell interest area.
⸻
4️⃣ High-Probability Trade Scenarios
📉 SELL SCENARIO (Main Bias)
Sell Zone: 4,183 – 4,192
(Trendline retest + EMA cluster + FVG alignment)
Targets:
→ 4,172
→ 4,160
→ 4,145
Stop Loss: Above 4,200
Confirmation Needed:
• Bearish engulfing
• BOS below 4,176
• RSI divergence on 5M–15M
⸻
💥 BREAKOUT SELL SETUP
Trigger: Break & close below 4,172
Retest: 4,174–4,176
Targets:
→ 4,160
→ 4,145
→ 4,130
Stop Loss: Above 4,185
⸻
📈 BUY SCENARIO (Countertrend)
Buy Zone: 4,159 – 4,165
(Morning sweep demand + liquidity grab)
Targets:
→ 4,176
→ 4,183
→ 4,190
Stop Loss: Below 4,154
Confirmation:
• Bullish CHoCH
• Strong wick rejection
• MACD flip
⸻
💥 BREAKOUT BUY SETUP
Trigger: Break & close above 4,200
Retest: 4,192–4,195
Targets:
→ 4,209
→ 4,225
→ 4,245
Stop Loss: Below 4,188
⸻
5️⃣ Fundamental Watch
• London session opens with higher volatility following overnight sweeps.
• US PPI and consumer sentiment later today may set the direction for the next leg.
• DXY stabilizing near 105.8, keeping pressure on gold until broken.
• Markets remain sensitive to Fed tone and bond yield fluctuation.
⸻
6️⃣ Key Technical Levels
Resistance Zones:
• 4,183
• 4,192
• 4,200
• 4,209
Support Zones:
• 4,172
• 4,165
• 4,159
• 4,145
Golden Zone:
➡️ 4,192 – 4,212
Break Levels:
• Sell Break Trigger: < 4,172
• Buy Break Trigger: > 4,200
⸻
7️⃣ Analyst Summary
Gold is forming a corrective pullback into a major confluence zone.
As long as gold remains below 4,190, the market favors bearish continuation toward 4,160 → 4,145.
A breakout above 4,200 would invalidate the bearish structure and drive the market toward the 4,225–4,245 imbalance.
This is a classic London-session compression → expansion setup.
⸻
8️⃣ Final Bias Summary
📉 Primary Bias: Bearish below 4,190, targeting 4,160 – 4,145.
📈 Alternative Bias: Bullish only above 4,200, targeting 4,225 – 4,245.
⸻

XAU/USD Intraday Plan | Watching 4153 Support for Next MoveGold failed to break above 4234 resistance yesterday and pulled back to retest the 4153 pullback zone. Market structure has turned temporarily bearish, with price closing below the 50MA.
If the 4153 support holds and price manages to reclaim the 50MA, a retest of 4234 resistance is likely. A clean break above 4234 could open the way toward 4,285.
However, if selling pressure continues and 4153 gives way, we may see 4115 tested next. A break below the pullback zone could extend the decline toward the lower support area at
4074–4027, where buyers may look to re-enter.
📌Key Levels to Watch
Resistance:
4197
4234
4285
4322
Support:
4153
4115
4074
4027

Gold Outlook | Smart Money Levels & Volatility Spike (Nov 14, 20OANDA:XAUUSD GOLD ANALYSIS - Smart Money Moves the Market Today
📅 Updated: November 14, 2025
🚀 Market Snapshot
Gold surges toward $4,200 as the U.S. shutdown disrupts key macro data and uncertainty boosts safe-haven flows.
The DXY slips to ~99.25, reflecting investor hesitation amid data blackout and Fed silence.
Macro Highlights:
* 🏛️ Shutdown freeze: October CPI/Jobs data postponed — volatility spikes expected on reopening.
* 🏦 Central Banks: +220t in Q3, +415t H1; China & Poland lead accumulation.
* 🌍 Geopolitics: U.S.–China tariff heat + Mideast tension = sustained risk premium.
* 💰 ETF Inflows: Heavy buying continues; gold reclaims post-ATH strength at $4,202 (+0.50%).
🧭 Smart Money Levels (Valid for Today)
🔴 Smart Money SELL ORDERS
$4,293 – $4,279
💣 ~$85M+ in institutional orders
→ Expect sharp rejection and high-volatility spikes.
🟠 Scalp SELL Area
$4,244 – $4,256
→ Ideal for quick fade setups with tight stops.
🟢 Smart Money BUY ORDERS
$4,080 – $4,104
💸 ~$50M+ in buy-side liquidity
→ Strong accumulation zone; expect bounce setups.
📍 These are high-probability institutional footprints for today’s session.
🔍 Macro Catalyst Outlook
* 🕒 CPI & Jobs Data: Still delayed → Expect “volatility bursts” when released.
* 🏦 FOMC (Dec): 25bps cut odds ~47%.
* 🌏 Geopolitical heat:
* Tariff escalation & Mideast risk = 🟢 Bullish
* Diplomatic cooling = 🔴 Pullback pressure
Bottom Line: Market remains headline-driven and liquidity-sensitive.
⚡ Technical Outlook — Bullish but Overstretched
* ✅ Break above $4,200 = continuation toward 4,250+
* ⚠️ RSI near 84 = expect volatility, not immediate reversal
* 🟩 Holding $4,180 = bullish continuation
* 🔻 Losing $4,180 = correction toward $4,150–$4,120
📌 Intraday Trade Levels (Nov 14, 2025)
🟢 Buy Zone: $4,180 – $4,200
→ Structural retest + central bank bids = strong support
🔴 Sell Zone: $4,230 – $4,250
→ Overbought liquidity pocket, short-term fade setup
→ Larger rejection expected around $4,244–$4,256
📈 Daily Range:
High: ~4,220
Low: ~4,190
Current: ~$4,202
🎯 Trade Plan — Simple & Tactical
* Buy Dips: 4,180–4,200 → Targets: 4,230 / 4,250
* Sell Fades: 4,244–4,256 → Short-term scalp
* Institutional Sell Wall: 4,279–4,293 → Major rejection zone
* Break & Hold Above 4,250: Target 4,300+
🧠 Final Take: Bulls in Control, Volatility Rising
Shutdown chaos, data blackout, and global risk keep gold bid on every dip.
Until $4,180 breaks, the bulls hold the advantage.
Trade the reaction — not the prediction.

Updated Gold AnalysisWith this price movement, it seems that many traders are currently holding long positions on gold.The market structure still looks bullish, and considering all the unusual news coming out these days, it’s natural to see strong reactions in the market.
Price was rejected from 4250 and is now pushing back upward. A range is likely to form in this area.
If you don’t have an open position and you want to trade gold, there are potential setups in the 15-minute timeframe.

14/11/25 Still Sideways Tight Trading Range
Yesterday’s candlestick (Thursday, Nov 13) was a bull doji closing around the middle of its range.
In our previous report, we said traders would watch whether the bears would attempt to create another leg down, or if the market would continue to consolidate sideways.
The market retested the Nov 6 low, but there was no follow-through selling. The market reversed back into the sideways consolidation.
The bulls hope the current decline will form a major higher low.
If the market trades lower, they want the recent sideways consolidation to be the final flag of the move.
They want a pullback to the 20-day EMA.
The problem with the bull's case is that they haven't been able to create strong bull bars to show control.
They must now produce strong consecutive bull bars, clearly breaking above the tight trading range with follow-through buying.
The bears’ measured-move target, based on the height of the prior trading range, projects toward the 4000–3950 area.
The selloff formed a tight bear channel, showing strong bears and persistent selling pressure.
They see the current tight trading range as a pullback. They want a breakout below, followed by another strong leg down.
If the market trades higher, the bears want it to stall around 4200 or the 20-day EMA, then resume its decline.
Fundamentals
• Production: SPPOMA down 2% in the first 10 days.
• Refineries: Buying interest remains, though not paying premiums vs spot futures.
• Exports: ITS is down 12.28% in the first 10 days.
Overall, the market broke out from an 11-week trading range in a persistent, tight bear channel — evidence of strong selling momentum.
The market remains Always-In-Short.
The selloff, however, is slightly climactic and has a parabolic wedge shape. The market may need to form a minor pullback before resuming its decline.
However, he bulls have not yet been able to create decent buying pressure.
The bulls need to do more to show they are at least temporarily back in control by creating consecutive strong bull bars. Otherwise, traders will not be willing to buy aggressively.
For now, odds still slightly favor the first pullback being minor.
If the pullback continues to be sideways and the bulls fail to create strong bull bars, the odds of another leg down will increase in the days ahead.
Today (Friday, Nov 14), traders will watch whether the bears get a strong bear bar, which will create a bear body on the weekly chart. If this is the case, the bearish case remains or increases. Or will the bulls be able to create a strong bull bar (which they have not yet been able to do so), which will create a bull body on the weekly candlestick instead?
Andrew

GOLD Long TradeTVC:GOLD / OANDA:XAUUSD Long Trade
Entry: 4106 - 4120
TP: 4244
This is good trade.
Don't overload your risk like Greedy gambler!!!
Be Disciplined Trader, risk what you can afford.
Use proper risk management.
Disclaimer: Trading is risky, only idea, not advice.

ES - November 13th - Daily Trade PlanNovember 13th- Daily Trade Plan - 5:18am
*Before reading this trade plan, IF, you did not read yesterdays, or the Weekly Trade Plan take the time to read it first! (You can see both posts in the related publication section) *
If my posts provide quality information that has helped you with your trading journey. Feel free to boost it for others to find and learn, also!
My daily trade plan and real-time notes that I post are intended for myself to easily be able to go back and review my plan and how I did from an execution perspective.
--------------------------------------------------------------------------------------------------------
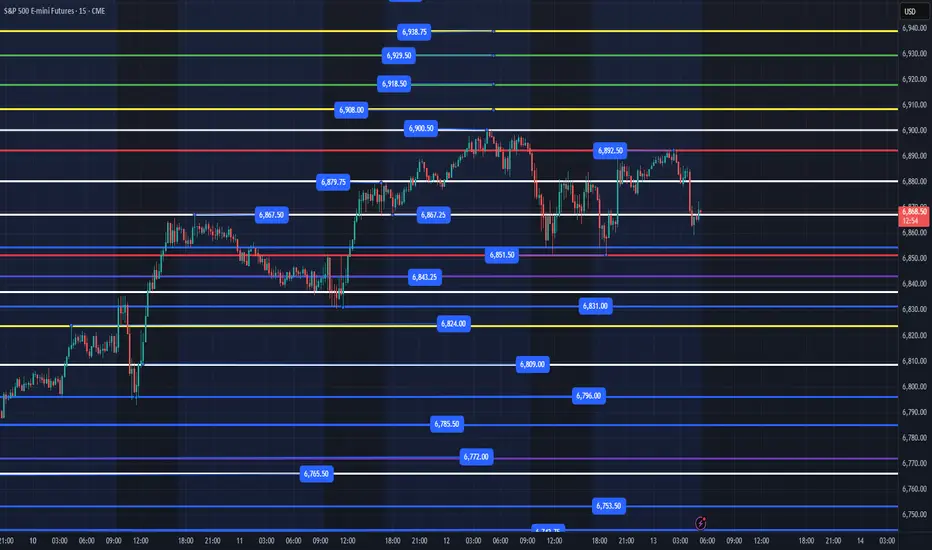
We have CPI at 8:30am and price action this week has been mainly contained to a range between 6831-6900. I expect us to have some volatility today and I am looking at only the best levels to flush and reclaim. Each day there are many levels that can bring points, but the highest quality levels are those where Institutions are entering to ride higher. 6867 has been a magnet inside our range.
Overnight high is 6892 and Overnight low is 6851. As I am typing this post, price just reclaimed 6867 and I anticipate it at least back testing the 6879 level which it broke down from this am.
Key Levels Today -
1. Loss of 6851-53 and reclaim
2. Loss of 6843 and reclaim
3. Loss of 6831 and reclaim
4. Loss of 6796 and reclaim
5. Loss of 6772 and reclaim (possibly as low as 6765 to close the gap)
6. Loss of 6743 and reclaim (possibly down to 6731)
Below those areas and we will most likely need to retest 6654. Price needs to clear 6900 to continue higher with 6918, 6929, 6938, 6953+ being the immediate targets higher.
Key Support Levels - 6867, 6851-53, 6843, 6831-36, 6824, 6809, 6796, 6785, 6772, 6765
Key Resistance Levels - 6879, 6893, 6900, 6908, 6918, 6929, 6938, 6953
We are in a tight range overnight and I still think we need to lose 6851-53 and reclaim for us to move above 6900. Ideally, we can flush down to 6824 and reclaim 6831 or 6837 and reclaim 6843. IF price is selling off, make sure to take your time on entering. Let price flush the level, back test that level, price hold, then you can enter.
I will post an update around 10am EST
----------------------------------------------------------------------------------------------------------------
Couple of things about how I color code my levels.
1. Purple shows the weekly Low
2. Red shows the current overnight session High/Low (time of post)
3. Blue shows the previous day's session Low (also other previous day's lows)
4. Yellow Levels are levels that show support and resistance levels of interest.
5. White Levels are previous day's session High/Low
GOLD Local Short! Sell!
GOLD is sliding away from the horizontal supply zone, with bearish displacement hinting at continuation toward the next liquidity pocket below. Any minor pullback may simply serve as distribution before the markdown resumes. Time Frame 1H.
Sell!
Comment and subscribe to help us grow!
Check out other forecasts below too!
Disclosure: I am part of Trade Nation's Influencer program and receive a monthly fee for using their TradingView charts in my analysis.

Gold Elliott Wave AnalysisHello friends
We are witnessing the formation of a complete Elliott wave pattern in the gold chart (XAU/USD).
A bearish wave has formed in the ABC pattern and then an upward correction in the form of ABC is forming. Of course, this correction could be the beginning of a 5-wave uptrend.
But wave 3 or C has not yet been completed, so we expect the price to grow to the $4370 range.
Good luck and be profitable.

BTC Analysis | CME GapHello friends
Bitcoin’s critical gap between $91,500 and $92,500 could serve as a short-term correction target if selling pressure continues.
A gap that closes could set the stage for a bottom and a continuation of the uptrend.
The price’s reaction to this area will determine the market’s next direction.
Don't forget risk and capital management.
*Trade safely with us*

Another Golden Opportunity!Gold's corrective move the past few weeks has now led to a bounce, expect some more gains in a likely ABC bounce to be followed by further correction towards $3800ish.
This wave 5 might only be wave 1 finished at $4380, a wave 2 corrective decline to be followed by a stronger wave 3...of course anything can happen, new highs in the next week or so will be very welcome.
Let's see the pattern play out before we are clearer on the outcome, expect this bounce to peter out towards $4190ish, if a resumption of the correction develops, another golden opportunity presents itself around $3800.
Whatever happens, this wave 5 will see $5000 plus and possibly $6000...remember $3000?
Appreciate a thumbs up, good trading and God Bless you all!

Gold bullish breakout resistance at 4250The Gold remains in a bullish trend, with recent price action indicating a potential breakout rally within the broader trend.
Support Zone: 4120 – a key level from previous consolidation. Price is currently testing or approaching this level.
A bullish rebound from 4120 would confirm ongoing upside momentum, with potential targets at:
4250 – initial resistance
4297 – psychological and structural level
4350 – extended resistance on the longer-term chart
Bearish Scenario:
A confirmed break and daily close below 4120 would weaken the bullish outlook and suggest deeper downside risk toward:
4090 – minor support
4045 – stronger support and potential demand zone
Outlook:
Bullish bias remains intact while the Gold holds above 4120. A sustained break below this level could shift momentum to the downside in the short term.
This communication is for informational purposes only and should not be viewed as any form of recommendation as to a particular course of action or as investment advice. It is not intended as an offer or solicitation for the purchase or sale of any financial instrument or as an official confirmation of any transaction. Opinions, estimates and assumptions expressed herein are made as of the date of this communication and are subject to change without notice. This communication has been prepared based upon information, including market prices, data and other information, believed to be reliable; however, Trade Nation does not warrant its completeness or accuracy. All market prices and market data contained in or attached to this communication are indicative and subject to change without notice.

Gold Spot (XAU/USD) – 4‑H Chart Update (Nov 13, 2025)Gold Spot (XAU/USD) – 4‑H Chart Update (Nov 13 2025)
**Current price:** ~4 223.76
**Recent movement:** The market rallied strongly from the 4 000 area over the past week, climbing back above 4 200 and currently trading near 4 224. Momentum remains positive but the price has just entered an area of overhead resistance.
---
#### Key zones & levels
* **Double Top/Bottom High (4 381.51) & 4‑hour SR (4 356.02):**
These purple lines mark the high of a previous double-top formation and a corresponding 4‑hour support/resistance level. If the uptrend continues, this area could act as a major supply zone; a clean break above 4 356 would signal renewed bullish strength toward 4 400+.
* **Vfi Sell Zone & Weekly SR (4 266.91–4 280):**
This red band is a confluence of a weekly support/resistance level and a sell zone identified by your Vfi indicator. Price briefly tested this region before pulling back. Watch how price behaves if it retests this zone—rejection could trigger a corrective move, while a decisive close above 4 280 would open the way toward the higher resistance band.
* **Immediate resistance (4 238.95):**
A 4‑hour SR line lies just above the current price. This level has already been tested intraday. Sustained trading above 4 238 would strengthen the near‑term bullish case; failure to reclaim it may encourage sellers.
* **Mid‑range support cluster (4 206.43 & 4 194.65):**
The dashed green lines denote the daily open (approx. 4 206) and another 4‑hour support/resistance level (~4 195). This zone could act as minor support on pullbacks. A break below might indicate a deeper retracement toward the next support band.
* **Daily / ¼‑hour TJL support (4 125.79):**
A broader green band around 4 126 is highlighted as a strong demand zone. If the market corrects, buyers may look for reaction here; it coincides with a prior consolidation area.
* **Major support (4 000.48):**
A weekly SR at 4 000 (pink) marks the lower bound of the recent range. A break below would negate the current bullish structure and put focus back on the swing low at 3 886.28.
---
#### Potential scenarios
1. **Bullish continuation:**
* Price holds above 4 206–4 195 and reclaims 4 238.95.
* An upside break of the Vfi sell zone (4 266–4 280) could extend the rally toward the double‑top area (4 356–4 381).
* Watch for strong volume and momentum on any breakout.
2. **Range/bearish pullback:**
* Failure to close above 4 238 leads to consolidation between 4 238 and 4 206.
* A break below 4 206–4 195 would target the green support band around 4 125.
* Loss of 4 125 opens risk for a deeper correction toward the weekly SR at 4 000.
---
**Note:** This analysis is for educational purposes. Always incorporate your own risk management and confirm signals before taking any trades.

possible bounce NQ from trendlineNQ is testing a 4h symmetrical traingle line sfp frome here might deliver a bounce or otherwise we go lower.
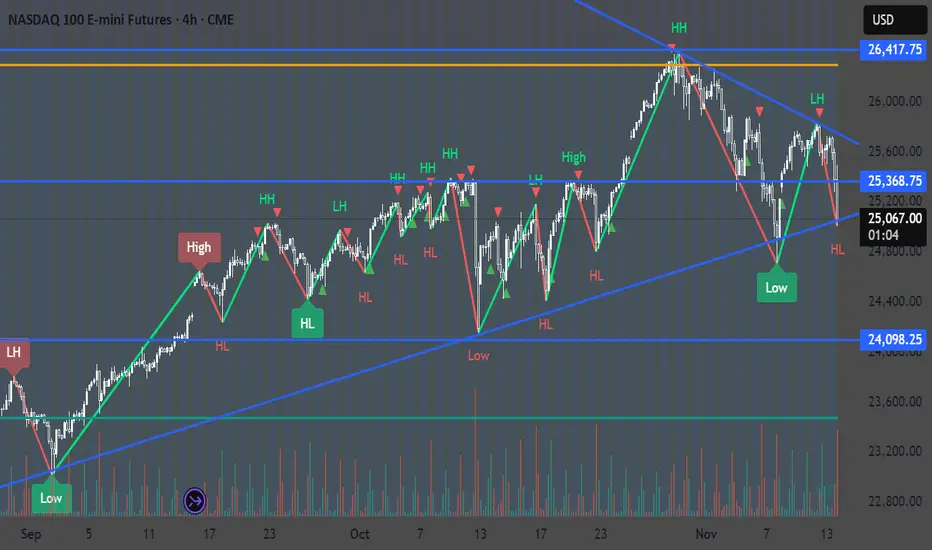
ES - Buy The Dip ?NQ1
Indexes have begun to slump with impulse today.
Previously S&P bounced hard from the 1:1 extension.
That completed a 3 wave correction where the first impulse wave down began after news of a Trump tariff threat against China was reported on.
So with plenty of impulsive chop for some time, this current wave down may well be the tail end of a fairly long correction phase.
Notice that S&P Futures has slumped below support - into higher liquidity.
This could well trigger a reversal.
If it does then we may be on the brink of the next bounce and into the next bullish phase.
Stocks / assets showing strength may do well if a bounce arrives.
And this may also be an opportunity to catch knives in stocks in confluence zones of support / RSI / ratio 🧐.

XAU/USD – Rate Cut Hope vs Supply Trap?🌐 MARKET CONTEXT
Gold is trading near elevated levels as markets increasingly price in a rate cut by Federal Reserve in December. Spot gold climbed above US$4,130/oz driven by a weaker dollar and relief over the U.S. government shutdown ending.
Reuters
+2
Saxo Bank
+2
Despite this strength, analysts still view gold as being in a corrective range, awaiting key U.S. inflation data and monetary-policy signals.
The Economic Times
+1
Sentiment is tilted toward risk-on for gold (i.e., bullish) given dovish expectations, but the upside is capped by supply zones and the possibility of a rejection if data surprises to the upside for the dollar.
For the upcoming London → New York sessions, expect volatility and trading around structural zones rather than trending breakout.
Bias for today: Conditional bullish, but prepared for a bearish bias if supply triggers rejection.
📉 TECHNICAL ANALYSIS (SMC + Liquidity Structure)
Price is in a broad up-trend, but currently approaching high-probability supply zones where prior imbalances may repeat.
Key structures to monitor:
A potential BOS (Break of Structure) upward if demand zones hold.
A potential CHoCH (Change of Character) if supply rejects and price turns lower.
Demand zones: strong structural support and liquidity pools lie lower in the 3,900s region.
Supply zones: clusters of untested supply exist near 4,080 + where stop-runs and trap buys may occur.
Confirmation factors: liquidity sweeps (stop-loss hunts), fake breakout then reversal, mid-timeframe (M5/M15) rejection candles.
Example logic: If price enters 4,080-4,078 zone and shows a wick, then rally fails → likely a supply trap and short scenario. Conversely, if price falls into 3,990-3,988 and sweeps then reverses → possible CHoCH to bullish.
🔑 KEY PRICE ZONES
4,080 – 4,078 ▶️ Sell Zone – High-probability supply, reactive short.
4,161 – 4,163 ▶️ Buy Zone – Higher structural support / breakout-target area for long.
4,081 – 4,083 ▶️ Buy Zone – Mid-structural demand zone, smaller long setup.
3,990 – 3,988 ▶️ Buy Zone – Deep support, high reward if confirmed.
Stop-loss levels:
For sell zone: 4,086
For buy zone (4,161): 4,155
For buy zone (4,081): 4,075
For buy zone (3,990): 3,982
⚙️ TRADE SETUPS
✅ BUY SCENARIO 1 – STRUCTURAL HIGH BUY
Entry: 4,161 – 4,163
Stop-loss: 4,155
TP1: ~4,180 TP2: ~4,210 TP3: Open
Logic: A strong bounce in this zone indicates continuation of bullish structure, valid for London session.
✅ BUY SCENARIO 2 – MID-DEMAND REACTION
Entry: 4,081 – 4,083
Stop-loss: 4,075
TP1: ~4,100 TP2: ~4,135 TP3: Open
Logic: Reactive long in mid-structure; lower risk, good for intraday.
✅ BUY SCENARIO 3 – DEEP SUPPORT ACCUMULATION
Entry: 3,990 – 3,988
Stop-loss: 3,982
TP1: ~4,020 TP2: ~4,060 TP3: ~4,100+
Logic: High reward scenario if price sweeps down and reverses from strong support.
⚠️ SELL SCENARIO – NY SESSION SUPPLY REJECTION
Entry: 4,080 – 4,078
Stop-loss: 4,086
TP1: ~4,040 TP2: ~3,990 TP3: ~3,930
Logic: Supply zone with liquidity; if price enters and shows rejection → shift to short bias.
🧠 NOTES / SESSION PLAN
London session: focus on buy setups from zones at 4,081 and 3,990.
NY session: monitor sell scenario around 4,080–4,078 for reactive short.
Avoid entering right on news release; wait for structure confirmation (M5/M15).
Maintain risk ≤ 2% per trade; trail stops after TP1 hit.
Be aware of macro risk: U.S. inflation data and Fed commentary may cause sudden moves.
If price gets stuck or choppy in zone without confirmation → stay out rather than forcing a trade.
🏁 CONCLUSION
Today’s bias: conditional bullish, favouring longs from confirmed support zones 4,161–4,163, 4,081–4,083, and 3,990–3,988.
But remain ready to switch to a bearish scenario if price triggers the supply zone at 4,080–4,078 and displays rejection.
Trade with discipline, wait for confirmation, and manage risk strictly.

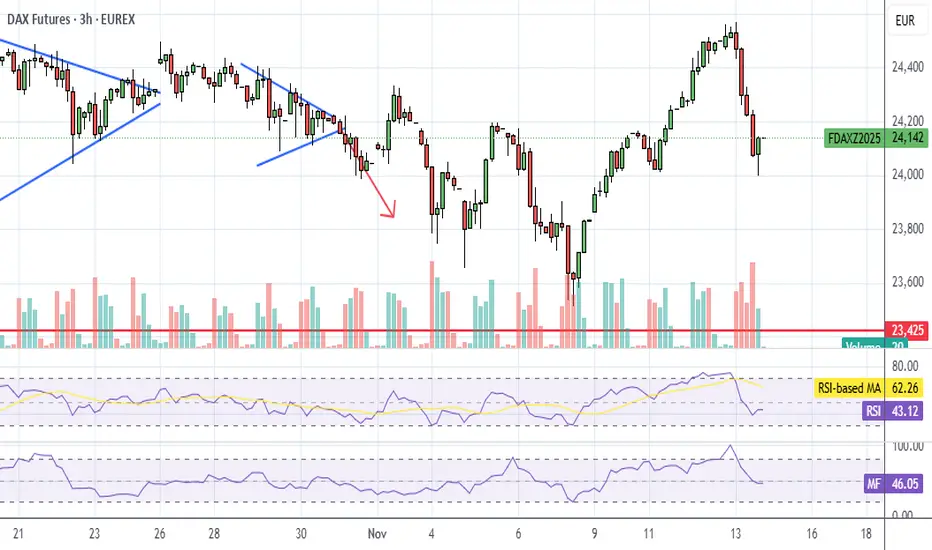
FDAX UpdateFDAX hasn't filled the Sunday gap or gone oversold, but it can bounce anyways. Not really sure what the Euros will do tomorrow morning.
Maybe we gap down so the algos can buy futures for a lower price. FUtures are green AH but not by much,
Excellent Profits on Bull run I announcedMy position: As I spotted #4,100.80 benchmark test, I started Buying Gold on each dip towards #4,116.80 first Resistance. On another #4,106.80 Support sweep, I engaged strong Buying orders towards #4,127.80 extension last night. I will continue Buying every dip on Gold from my key entry points. That is my practical suggestion.
My position: I have Bought Gold on multiple occasions throughout yesterday's session / each reversal I have Bought the dip ultimately towards #4,192.80 Resistance. I have awaited Gold to form a benchmark on #4,200.80 then I have waited this morning to re-Buy Gold multiple times from #4,227.80 towards #4,240.80 Resistance. I will continue Buying Gold from each reversal / dip as I await #4,201.80 - #4,211.80 to Buy more. Congratulations on spectacular Profits, making money on Gold became so easy / just stay with the trend.

Not an uptrend yet for gold (XAUUSD)—just a reboundNot an uptrend yet for gold (XAUUSD)—just a rebound; be careful of a sharp reversal.
Technical Analysis
1. XAUUSD rebounded to the 161.8% Fibonacci retracement around 4240, stalled, and has started to pull back. A bullish divergence between price and RSI has set, indicating the potential of a bearish reversal.
2. If XAUUSD falls below 4140, it would confirm the end of the rebound and could plunge lower to 4030, or even retest the prior low around 3900.
3. However, if the support at 4140 holds, the price may further spike to retest 4270 resistance before choosing the next direction.
Fundamental Analysis
4. US government reopening allows economic data to be released, clarifying the economic outlook, and reduces uncertainty, which may diminish demand for safe-haven assets.
5. However, if upcoming data point to a weaker labor market, expectations for Fed rate cuts would increase and support gold.
6. Meanwhile, CME FedWatch shows the market has trimmed the probability of a 0.25% cut in December to 49.9%, down from 62.9% yesterday. For the first time, markets now assign a slightly higher probability to a hold (50.1%) , which will pressure the gold price once traders internalize this shift.
Analysis by: Krisada Yoonaisil, Financial Markets Strategist at Exness

Gold Bulls Awaken, Can It Hold Above 4300? Strategy Update
Gold continued its upward breakout from its consolidation range in the latter half of the previous trading session, further opening up upward potential. We've previously mentioned that the short-term consolidation in gold was a build-up for an upward breakout. Today, we should continue to focus on effective long positions following the trend, observing the extent of the bullish continuation. While bullish, avoid chasing the price higher. During the Asian session, wait for a pullback to key support levels before entering effective long positions. Since the gold price has already broken out, this indicates further upward potential. During the pullback, long positions should continue to be established, following the trend. Short-term support is at 4185-75, where small, incremental long positions can be entered. Gold's 4160-50 level has transformed from resistance to support, making it another good entry point for long positions. Gold remains bullish in the short term. Current price action suggests resistance around 4210-20, with strong resistance around 4245-55. This is a suggested strategy for the Asian session, and it's time-sensitive. If the Asian session breaks through, the target for the European and American sessions is 4250. Continue to expect further upward movement towards 4300; otherwise, expect range-bound trading.
Market Review: On the previous trading day, when the price pulled back to around 4100, I signaled to enter long positions near the double bottom pattern formed at 4100, ultimately resulting in profit. A total of 5 trades were made on the previous trading day, including both long and short positions, all of which were profitable. You can check previous posts to verify this. Currently, the price is fluctuating within a small range of 4185-4205; we will look for opportunities to buy.
Markets don't always move in a sideways pattern; there will always be breakouts. These breakouts are more volatile and offer more opportunities, but they also carry higher risks. I always remind investors to prioritize risk management and carefully plan their positions. I focus solely on real trading and a clear rhythm. There are no perpetual bull or bear markets, only the right direction in the present. Master the rhythm and follow the trend. This is the essence of trading. Currently, you must seize every opportunity to buy on pullbacks. If you're struggling to execute trades precisely, try my method: test the market with a small position first, then add to your position on pullbacks. This way, you won't miss any opportunities. If you're truly unsure when, where, and how to trade, follow me and strictly adhere to my signals. This will make it easier to recover losses or double your profits!

GoldBased on my simple analysis, the chart shows that after the trendline was broken, the price has pulled back to retest the trendline. A clear double-top pattern is also visible on the chart.
