Demand for Furkids on the rise .......I am bullish on this sector for the long haul and will be nibbling on this stock soon.
Aging population, getting late to marriage and not having kids after marriage.......this combination will result in more singles, couples keeping furkids more than anything. Currently, the market is fragmented with pretty low entry and I believe over time, there will be some consolidation amongst the big boys.
This trend is not only taking place in China but like Japan, Singapore, Korea and Thailand, I see a similar pattern.

If break out of resistance, take a nibble - Alpha GroupPlease take a look at this stock and DYODD.
The breakout from the resistance would be a good entry point

Potential Bullish Rally Amid China’s Market ReboundAs the Chinese stock market shows signs of a bullish outlook, Seik Motor Corporation Limited (600104) appears well-positioned for a significant upward movement. This analysis is based on the belief that the market is either experiencing or will soon enter a period of sustained growth, potentially benefiting undervalued stocks like Seik Motor.
From a technical perspective, Seik Motor reached a notable low around the 11.49 CNY level before rallying to approximately 16 CNY. This initial surge is identified as the completion of wave one in an Elliott Wave sequence. Following this, the subsequent decline to around 12.5 CNY represents a corrective wave two. Currently, we anticipate that the stock is preparing for wave three, which often tends to be the most extended and powerful wave in such sequences.
If wave three unfolds as expected, Seik Motor could potentially reach a target level of 20 CNY, with a high probability of even surpassing its prior all-time high around the 37 CNY mark. However, the key invalidation level for this bullish outlook remains at 11.49 CNY. Should the stock drop below this threshold, it would indicate a shift in market sentiment, nullifying the bullish scenario.
Given these technical indicators, Seik Motor Corporation Limited presents an intriguing opportunity for investors seeking exposure to the anticipated strength in the Chinese market.

Bullish Breakout Expected Amid Wave 3 Rally PotentialAt Vital Direction, we’re closely monitoring Chongqing Zhifei Biological Products Co., Ltd (ticker: 300122) as we believe it’s poised for a significant upward movement, reflecting our bullish outlook on the broader Chinese stock market. With our technical analysis framework, we interpret this stock as highly undervalued and positioned for potential growth, in line with the index’s bullish trajectory. Currently trading around ¥28, we project that it could ascend to ¥50 or even test new all-time highs, driven by strong technical indicators.
Diving deeper into the wave structure, our analysis indicates that the low around ¥20.38 served as a foundational bottom, marking the beginning of an impulsive pattern. From this level, the sharp increase to approximately ¥40 represents what we interpret as wave 1, while the subsequent correction down to ¥27 aligns with a wave 2. This sets up the present move as the start of wave 3, which we expect to extend much higher in the coming months.
It’s important to note that if the price were to drop back down to the ¥20.38 level, this would invalidate our current bullish scenario. However, as long as this level remains intact, our outlook remains strongly positive. For those following the Chinese market’s developments, this stock could present an opportunity as the market rallies.

Xiamen Changelight Soars 108% in Just 16 Days!Xiamen Changelight Analysis:
Xiamen Changelight has seen a phenomenal rally, achieving a stunning 108% gain over the past 16 days. The recent bullish momentum has allowed the stock to achieve all target levels, with each level surpassed in quick succession.
Trade Setup:
Entry Point: $8.11
Stop Loss: $7.86
Target Levels:
TP 1: $8.41
TP 2: $8.90
TP 3: $9.38
TP 4: $9.69
Technical Indicators:
The stock has trended strongly above the Risological dotted trend line, showing a clear uptrend and sustained buying pressure. The price action’s alignment with this trend suggests confidence among buyers and the potential for continuation if volume remains supportive.
Market Sentiment:
The sharp rise in share price reflects strong interest in Xiamen Changelight, potentially driven by fundamental catalysts or broader market trends in its industry. With robust volume supporting the upward movement, the momentum appears sustainable, although some consolidation might occur after such a large gain.
Outlook:
With all targets reached, traders should monitor for any pullback or consolidation phase as new support levels are established. The strong trend could attract further interest, especially if broader sentiment remains positive. Keep an eye on volume and price stability to assess if another leg up is likely in the coming sessions.

I may nibble this company shares this week - 300750Last Saturday news may probably cause the Chinese stock market to pull back or goes sideway this week, so I am monitoring the move closely before deciding to put some ammunition in this stock.
Please DYODD

Chinese banks in my watchlistWith more rate cuts coming up from the FEDs in the coming months, we can reasonably expect the big banks in China will follow suit as well. Already, the government is pushing stimulus for these banks to lend out more money by lowering the RRR. But, is it enough?
Loans business remain sluggish in the 2nd largest economy. Read here
It will take at least 12 -18 months before we start to see an increase in banks increasing their rates again. Currently, with ultra low interest rates, that means these banks have to find more volume (businesses) to lend its money to. Already, the weak consumer demand is driving the corporates to tighten its belt and stay cautious in expansionary plans. This is a vicious cycle - less consumer spending leads to lesser productivity from corporations which means they need to borrow less and banks suffer more in terms of business.
The chart imo reflects my opinion about the China market where the bearish candles reflect it is at its peak and prices will continue to falter from here onwards. We could see it revisit the 5 dollars mark zone where I will be interested to buy more.
Please DYODD

The banks in China are still undervalued.......If you have not heard the news, please read here
I think this is not the end of the stimulus but the beginning as the government is going all out to get the economy back ! Here , we can see that many companies are still suffering in the red with bankruptcies rate accelerating as well.
Time is of essence as the GDP target of 5% is important to meet for the government ! All eyes are watching on the CCP moves since the last few days.......
Let's wait for next week to see how the price pattern moves .........

CATL, Chinese stock market, it will long. so simple!The yellow downward channel has broken through with an upward target marked, and there are also other oscillation ranges. Overall, it is expected to rise, very simple and obvious.

CATL - start of another super cycle?This has got to be one of the most bullish setups out there. We are essentially in a larger time frame bull flag. Price remains in a short term downtrend, putting in lower lows and lower highs. However if we breakout of this flag with volume I fully expect the start of a new 5 Wave Impulsive move to the upside, essentially the start of a new super cycle with the distance of the pole creating a 1-1 extension of the initial move. This lines up with a beautiful Fibonacci target.
Keep your eye on this one!
Do what’s best for you, not financial advice. Just my own trades which I am kindly bringing to your attention.

Long , China: 603345 Anjoy FoodsGo long at the lower boundary support of the green oscillation range,
and then break through the white falling channel


600519 - Awaiting for it to come to support level firstFrom the weekly chart, we can see that the share price will be likely revisiting the support level at 1356 level. Let's wait for this level and assess if there would be any trend reversal with a bullish candle pattern before going LONG......
IF this support level breaks, we can see the share price tumble down to the near 1000 level mark.....

The drop is in place, with a white oscillation range of decline,At the same time, there is also support for the lower boundary of the green oscillation range
long

2024.07.18 603569 BEIJING CHANGJIU LOGISTICS longlooks like bottom
buysing dip
planning to take profit above 10%
// not financial advice, just for personal trading records

2024.07.18 002458 SHAN DONG YISHENG longbought today at the opening price
it is going up
will take profit above 10%
// not financial advice, just for personal trading records

Taking a nibble on this company - Fuyao GlassThe global demand for NEV vehicles will continue and automotive glass will be required to pair with each vehicle be it sold domestically or for export market.
Let's see how it turns out in 6-12 months time........

Is the green energy sector turning around? Bullish Divergence!Previously we had a 66% draw down then bullish divergence to form the bottom.
Looks like we are in a similar position?
Lets see if we get a breakout soon :)

600009 - 7 months HEAD & SHOULDERS══════════════════════════════
Since 2014, my markets approach is to spot
trading opportunities based solely on the
development of
CLASSICAL CHART PATTERNS
🤝Let’s learn and grow together 🤝
══════════════════════════════
Hello Traders ✌
After a careful consideration I came to the conclusion that:
- it is crucial to be quick in alerting you with all the opportunities I spot and often I don't post a good pattern because I don't have the opportunity to write down a proper didactical comment;
- since my parameters to identify a Classical Pattern and its scenario are very well defined, many of my comments were and would be redundant;
- the information that I think is important is very simple and can easily be understood just by looking at charts;
For these reasons and hoping to give you a better help, I decided to write comments only when something very specific or interesting shows up, otherwise all the information is shown on the chart.
Thank you all for your support
🔎🔎🔎 ALWAYS REMEMBER
"A pattern IS NOT a Pattern until the breakout is completed. Before that moment it is just a bunch of colorful candlesticks on a chart of your watchlist"
═════════════════════════════
⚠ DISCLAIMER ⚠
The content is The Art Of Charting's personal opinion and it is posted purely for educational purpose and therefore it must not be taken as a direct or indirect investing recommendations or advices. Any action taken upon these information is at your own risk.

4/26/2024 - 300552 Vanjee Technology300552 Vanjee Technology
Chart: 15m
Price line
Trend line
Pattern recognition: Bullish Rectangle

4/26/2024 - 002395 Wuxi Double Elephant002395 Wuxi Double Elephant
Chart: Daily
Price line
Trend line
Pattern recognition: Rising Wedge

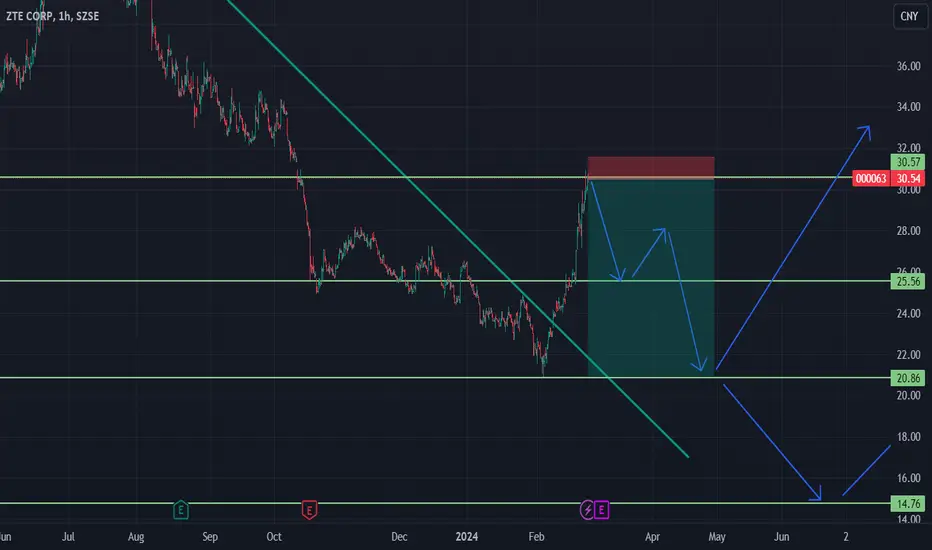
ZTE corp for short *The content on this analysis is subject to change at any time without notice, and is provided for the sole purpose of assisting traders to make independent investment decisions.
Investment Opportunity BYDI'm expecting the price to continue the bullish trend, we can see the price reacting on the demand zone and broke the structure upside.
