ECAP - Egyptian stock#ECAP timeframe 1 DAY
created 2 Bullish pattern ( Gartley and AB=CD ) , so we can see action price in this point .
Entry level at 22.70 ( price now 22.40 )
Stop loss 22.00( loss may go to up -3% )
First target at 24.45( with profit around 7.60% )
Second target 25.97( with profit around 14.70% )
NOTE : this data according to time frame I DAY ,
Its not an advice for investing only my vision according to the data on chart
Please consult your account manager before investing
Thanks and good luck

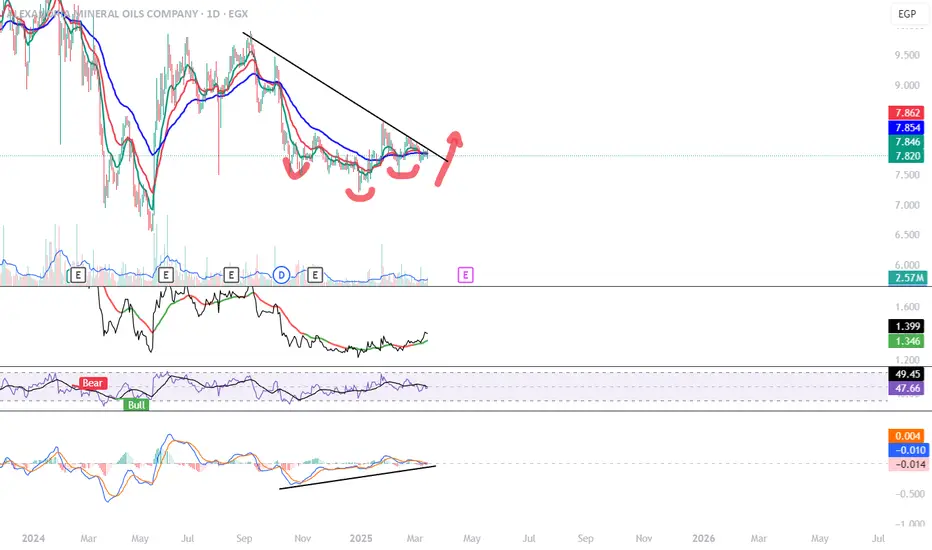
AMOC (Alexandria Mineral Oils Company) – Bullish Breakout Ahead?
**📈 AMOC (Alexandria Mineral Oils Company) – Bullish Breakout Ahead? 🚀**
🔎 **Technical Analysis (1D Chart):**
AMOC has been trading in a long-term downtrend but is now showing signs of a potential reversal. The price action has formed what appears to be an **inverse head and shoulders pattern**, which is a strong bullish reversal signal when confirmed with a breakout.
- **Inverse Head and Shoulders:** The formation is visible with three distinct lows, suggesting a possible trend reversal.
- **Descending Trendline Resistance:** The stock has been respecting a major downward trendline. A breakout above this level could lead to a strong upside move.
- **Moving Averages:** The price is hovering around the short-term moving averages. A bullish crossover between the moving averages could act as further confirmation of upward momentum.
- **MACD Bullish Divergence:** The MACD indicator is showing a rising trend while the price has been forming lower lows, indicating weakening bearish momentum and potential bullish strength.
- **RSI Near Key Levels:** The RSI is moving around neutral levels, suggesting that the stock has room to rally if buyers step in.
🔑 **Key Levels to Watch:**
- **Immediate Resistance:** **7.85 - 7.86 EGP** (needs to break for confirmation)
- **Support Levels:** **6.97 EGP** (holding above this is crucial)
- **Breakout Target:** **9+ EGP** (based on the pattern projection)
📊 **Market Sentiment:**
Volume has started to pick up, which is a positive sign, but a clear breakout above resistance is needed to confirm a sustained move higher. If buyers step in with strong volume, AMOC could see a trend reversal and a push towards higher price levels.
⚠️ **Risk Management & Disclaimer:**
This is **NOT financial advice**. Always conduct your own research and apply proper risk management before making any trading decisions. Markets are unpredictable, and technical patterns are not guaranteed to play out as expected. Stay cautious and trade responsibly!
🔥 **What’s Next?**
A daily close above the resistance level could signal the beginning of a new bullish trend. If the stock fails to break out, it may consolidate or retest support before attempting another move. Keep an eye on volume and confirmation signals before entering any trade.
📢 **What do you think? Will AMOC break out soon? Share your thoughts below!** 👇
#AMOC #EGX #Trading #Breakout #TechnicalAnalysis #StockMarket #Investing

Bullish Trend Analysis ,Trend is your Friend ### **📈 Egyptian Transport (EGYTRANS) – Bullish Trend Analysis 🚀**
Your chart on **EGYTRANS (EGX:ETRS)** shows signs of a potential **bullish trend**, but confirmation is needed. Here’s a detailed analysis:
---
### **✅ Bullish Trend Confirmation:**
1️⃣ **Support Holding at 4.507 EGP** – Important level.
2️⃣ **Breakout Possible Above 4.968 EGP** – Key resistance zone.
3️⃣ **RSI at 48.89** – Neutral, needs to cross 55 for bullish momentum.
4️⃣ **MACD Crossover Forming** – Could push price higher.
5️⃣ **Volume Profile Shows Buyers** accumulating around 4.9-5.2 EGP.
---
### **📈 Trade Setup:**
- **Entry:** Above **5.208 EGP** for strong confirmation.
- **Target 1:** **6.199 EGP** (Resistance level).
- **Stop-Loss:** Below **4.507 EGP** to limit downside.
---
### **🔍 Key Observations:**
✅ If price **stays above moving averages**, bullish trend strengthens.
✅ **Volume must increase** on breakout to confirm trend shift.
✅ **Watch for a retest of 5.208 EGP** before a stronger rally.
---
🔥 **Final Verdict:** **Bullish but needs breakout confirmation above 5.208 EGP.**

#EKHOA Egyptian stock - great opportunity - great fundamental.#EKHOA time frame 1 DAY
created 3 Bullish Gartley patterns ( patterns by time frame 1 day and anther one by time frame 1 hour ) , so we can see action price in this point but in anther hand we are in a downtrend targeted 27.00 .
Entry level at 30.10 to 30.30
Stop loss 29.00 ( loss may go to up -3.70% )
First target at 31.95 ( with profit around 6% ) , resistance at 31.20
Second target 33.50 ( with profit around 11% )
Third target 34.50 ( with profit 15% )
NOTE : this data according to time frame I DAY , it`s may take period up to 3 months to achieve targets , you must study well the Alternative opportunities before invest in this stock .
Its not an advice for investing only my vision according to the data on chart
Please consult your account manager before investing
Thanks and good luck

AIH -Long Arabia Investments Holding (EGX:AIH)
Arabia Investments Holding engages in the non-banking financial, engineering, contracting, and manufacturing businesses in Egypt. Arabia Investments Holding was founded in 1985 and is based in Cairo, Egypt.
At close: Apr 6, 2025 0.490 EGP/share is slightly undervalued
Key Investment Highlights
1. Undervaluation Opportunity
o Current Price (0.49 EGP) vs. Book Value (0.91 EGP): Trading at ~46% discount to book value.
o Fair Value (1.18 EGP): Ostoul Securities estimates 141% upside based on sector P/E.
o Low Trailing P/E (10.52): Suggests earnings are reasonably priced.
2. Strong Financial Growth (2023)
o Revenue Growth: +11.48% (1.41B EGP).
o Earnings Growth: +27.95% (90.16M EGP).
o Market Cap CAGR (5.17% since 2013): Steady but modest long-term appreciation.
3. Technical Indicators Suggest Bullish Reversal
o Wyckoff Accumulation Phase (Since Oct 2024): Potential upward breakout.
o Falling Wedge Pattern (Monthly Chart): Targets 1.01 EGP.
o Elliott Wave Analysis: Wave 1 target at 0.721 EGP.
o Point of Control (POC) at 0.6 EGP: Near-term resistance.
o EMA200 Below Price: Indicates bearish trend, but reversal signals emerging.
🔑 Strategy Suggestion:
• Entry Zone: 0.48–0.52 EGP
• Stop-loss: Below 0.44 EGP
• TP1 refers to volume Money flow profile =POC is 0.6 EGP/share
• TP2 refers to Elliot analysis current in wave 1and TP is 0.721 EGP/share
• TP3refers to daily falling wage 0.737 EGP/share and Flag in monthly to be 1.01 EGP/share
• TP4 refers Book Value Per Share 0.91 EGP/share
📌 Investment Thesis Summary
✅ Positives
• Undervalued vs. Book Value and Sector P/E
• Strong revenue and earnings growth in 2023
• Technical setup suggests a bullish reversal (accumulation + falling wedge)
• Fair value (1.18 EGP) implies significant upside (~141%)

#ETEL- Egyptian stock#ETEL timeframe 1 hour.
Created a Bullish Gartley pattern
Entry level at 35.13 - price closed at 35.05
Stop loss 34.70 (-1.20% estimated loss)
First target at 36.00 (2.65% estimated profit)
Second target 36.90 (5.00% estimated profit)
NOTE: this data is according to time frame 1 hour, also there is a positive divergence on MACD.
It's not an advice for investing, only my vision according to the data on chart.
Please consult your account manager before investing.
Thanks and good luck.

#ALCN- Egyptian stock#ALCN time frame 2 hours
Created a Bullish Gartley pattern
Entry level at 21.00
Stop loss 20.80(-1.30% estimated loss )
First target at 21.70( 3.18% estimated profit )
Second target 22.30( 5.30% estimated profit )
NOTE : this data according to time frame 2 hours,
Its not an advice for investing only my vision according to the data on chart
Please consult your account manager before investing
Thanks and good luck

EFIH-LONGe-finance for Digital and Financial Investments S.A.E. (EGX:EFIH)
Technical Overview
• Current Price (April 3, 2025): 16.95 EGP/share
• 100-Week Range: 13.25 – 27 EGP/share
• Below EMA 200: Bearish sign; technically under long-term resistance
• Gann Analysis TP: ~32.11 EGP in Dec 2025 (based on( 2+((13.455))^1/2 )^2
• Elliott Wave Analysis: In Wave C (correction) is complete 16 EGP/share (current price near
upper bound) , ready to run up
Wyckoff selection is complete accommodation phase
• TP1: 19.1 EGP (Falling wage )
• TP2: 23.0 EGP (ROC)
• TP3:26.0 EGP (Daily R4)
• TP4: 32 EGP (Gann target) in Dec. 2025

long-term investor (EGX:LCSW) (EGX:LCSW) Lecico Egypt (S.A.E.) produces and sells sanitary ware products and various tiles in Egypt and Lebanon. The company’s products include bathroom suites, toilets, washbasins, and bidets and urinals; and squatting pan, shower trays, kitchen sink, and taps, as well as other complementary products.The company exports its products. It sells its products under the Lecico brand.Lecico Egypt (S.A.E.) was incorporated in 1975 and is based in Alexandria, Egypt
Mid-Term Target Price (Fair Value Avg): ~85 EGP, implying ~237% potential upside from current levels.
• Technically Weak in Short-Term: Below EMA 200 and entering the Wave C correction suggests consolidation or dip toward the 21–25 EGP range before an upside move.
Technical Overview
• Current Price (April 3, 2025): 25.2 EGP/share
• 52-Week Range: 15.00 – 34.84 EGP/share
• Book Value per Share is 46.68 EGP
• Below EMA 200: Bearish sign; technically under long-term resistance
• Rate of Change (ROC): 24.6 EGP/share
• Gann Analysis TP: ~34.5 EGP in May 2025 (based on (15.02)2+2(15.02)^2 + 2(15.02)2+2)
• Elliott Wave Analysis: In Wave C (correction), target zone: 21–25 EGP/share (current price near upper bound)
Financial Highlights – FY 2024
• Revenue: EGP 6.64 billion (↑ 37% YoY)
• Net Profit: EGP 890.3 million (↑ 99% YoY)
• EPS: 11.13 EGP
• Sanitary Ware: 64.8% of revenue, 77.9% export-driven
• EBIT: EGP 1,151 million (↑ 22%)
• Margins:
o Gross: 28.22%
o Operating (EBIT): 17.32%
o Profit: 13.40%
o EBITDA: 19.47%
Interpretation & Conclusion
• Fundamentally Undervalued: With a P/E of 2.26× and P/B of 0.54×,
Lecico appears significantly undervalued given its strong profitability and book value.
Investment Strategy
If you’re a long-term investor:
• Accumulate in the 21–25 EGP correction zone.
• Monitor EMA 200 breakout and ROC reversal for momentum entry.
Mid-Term Upside Targets
• TP1: 34.5 EGP (Gann target)
• TP2: 58.8 EGP (DCF Value )
• TP3: 65.6 EGP (CHF estimate) refer to Cairo Financial Holding company
• TP4: 85.0–105.6 EGP (Sector-based fair value) refer to Ostoul Securities Brokerage Bond Trading Company

#ATQA - Egyptian stock#ATQA timeframe 1 hour
Created a bearish Gartley pattern
Sell point around 10.00
Stop loss / reentry 10.20 (estimated loss -1.65%)
First target at 9.60 (estimated profit 4.20%)
Second target 9.25 (estimated profit up to 7.70%)
NOTE: this data according to timeframe 1 hour.
NOTE: stock remains positive for long term.
It's not an advice for investing, only my vision according to the data on chart.
Please consult your account manager before investing.
Thanks and good luck.

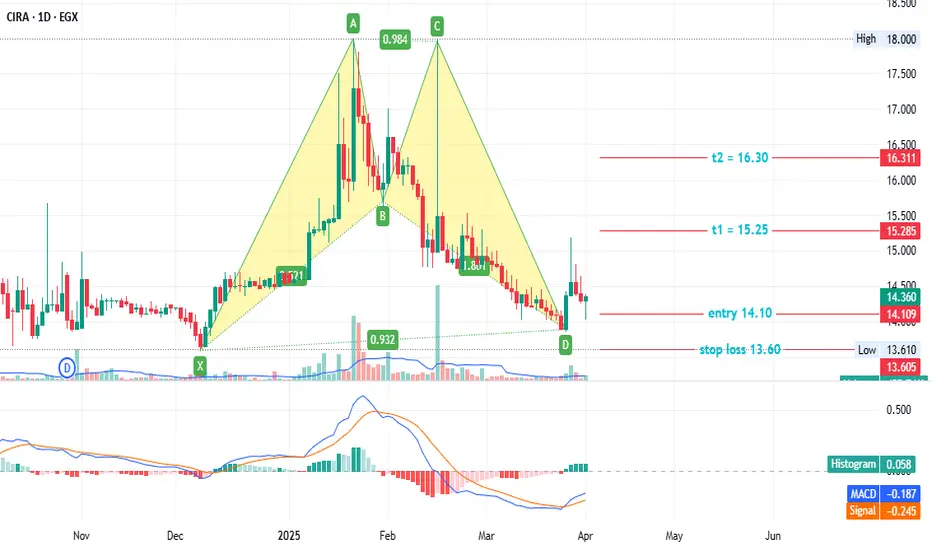
#CIRA - Egyptian stock#CIRAtime frame 1 DAY
Created a Bullish Gartley pattern
Entry level at 14.10
Stop loss 13.60 (-5% estimated loss )
First target at 15.25 ( 8% estimated profit )
Second target 16.30 ( 15% estimated profit )
NOTE : this data according to time frame I DAY , it`s may take period up to 3 months to achieve targets , you must study well the Alternative opportunities before invest in this stock .
Its not an advice for investing only my vision according to the data on chart
Please consult your account manager before investing
Thanks and good luck
RAYA Egypt may go bullish towards 5.30 !Weekly chart,
I see a pre-formation of a widening rising wedge pattern, and the stock EGX:RAYA is preparing to go on a bullish movement towards the upper line R
There is a very strong resistance level at 3.00, then resistance levels at 3.60 and 3.74
(At each resistance level, be careful with your profits!)
The technical confirmation is closing 2 weeks above 2.45 for a new entry (buy)
Long Term Targets 4.00, 4.30, 4.50, 5.00, 5.30
Note: Stop Loss should be considered below 2.30 - 2.27

ICID Egypt - A bullish long-term patternWeekly chart,
The stock EGX:ICID is trading inside a symmetrical triangle pattern between Support and Resistance lines (S and R)
The technical indicator RSI can be seen as drawing the same pattern (waiting for crossing up the R RSI line as a confirmation).
MACD is crossing up its signal line.. However, it is still technically negative.
So, I can expect a new bullish movement towards the Resistance line (at around 4.45)
Crossing up the R line and trading above it for 3 weeks - with high volume, the long term target will be 7.45
NOTE: Consider a near profit protection / stop loss level for this stock, as it is volatile and impulsive!

$SAUD,Al Baraka Bank Egypt S.A.E. (EGX: SAUD) Al Baraka Bank Egypt S.A.E. (EGX: SAUD) is an Egyptian bank providing corporate and retail banking services domestically and internationally.
Financial Overview:
• Market Capitalization: Approximately EGP 8.81 billion.
• Revenue (2024): EGP 6.46 billion, a 37.59% increase from the previous year.
• Net Profit (2024): EGP 2.59 billion, up 36.74% from the prior year.
• Earnings Per Share (EPS): EGP 3.56.
Dividend Information:
The bank announced an annual dividend of EGP 0.85 per share for the 2024 earnings, with a yield of 7.02%. The ex-dividend date is April 14, 2025, and the payment date is April 16, 2025.
Valuation Estimates:
1) Book Value Per Share ( EGP 17.26 per share.)
2) Cairo Capital Securities: Fair value estimate of EGP 23.8 per share.
3) Ostoul Securities Brokerage: Fair value estimate of EGP 15.17 per share, based on the sector's P/E ratio.
Financial Ratios:
• Return on Equity (ROE): 26.97%.
• Price-to-Earnings (P/E) Ratio: 3.41.
• Price-to-Book (P/B) Ratio: 0.69.
Technical Analysis:
• The current Stock Price is below Book Value Per Share and close to 200-day EMA.
• 52-Week Range: EGP 9.97 to EGP 14.80
o Wyckoff Theory: The stock has been in an accumulation phase since May 2024, indicating potential for upward movement.
o Elliot Wave Analysis: Currently in wave 5, with a target price (TP) of EGP 18.30.
o Gann Analysis: Projects a TP of EGP 26.60 by June 2025.
Price Targets:
• TP1 (Point of Control): EGP 14.00
• TP2 (Elliot Wave Analysis): EGP 18.30
• TP3 (Gann Analysis): EGP 26.60 by June 2025.
Please note that financial markets are subject to volatility. It's advisable to consult with a financial advisor before making investment decisions.

Long $ORWEOriental Weavers Carpets Company (S.A.E) (EGX:ORWE) is a leading global manufacturer and seller of carpets, jet-printed rugs, and related raw materials. Their product range includes machine-woven and non-woven carpets, various types of rugs and mats, and artificial turf for both indoor and outdoor applications.
Financial Highlights:
Revenue and Profitability: In the fiscal year 2023, Oriental Weavers reported revenues of EGP 17.659 billion, marking a 33% year-over-year increase. The net income for the same period was EGP 1.892 billion, resulting in a net profit margin of 10.7%. citeturn0search2
Earnings Per Share (EPS):The earnings per share for FY2023 stood at EGP 2.6, reflecting a 106% increase compared to the previous year.
Market Capitalization: As of March 24, 2025, the company's market capitalization was approximately EGP 15.264 billion. but the enterprise value is 19.91 billion.
Dividend: The company declared an annual dividend of 1.25 EGP per share for 2024, with a yield of 5.36%. The dividend is paid once per year, and the last ex-dividend date was April 28, 2024. For 2025, the dividend has been increased to 1.6 EGP per share.
Debt and Cash Position: Oriental Weavers holds EGP 6.30 billion in cash and EGP 8.58 billion in debt, resulting in a net debt position of EGP 2.28 billion.
Return Metrics: The company has a Return on Equity (ROE) of 14.44% and a Return on Invested Capital (ROIC) of 5.17%.
Net Profit increased 34% YoY to record EGP 2.5bn backed by the strong operational performance accompanied with 137% YoY hike in interest income which offset the EGP 0.4bn FX loss and the 20% YoY higher interest expense. Net profit margin remained almost flat at 10.5%.
Sales Volume came almost flat YoY, affected by the global macroeconomic and geopolitical
challenges, with International making up healthy 62% of sales volume and Egypt representing
38% of sales volume.
Stock Performance:
Share Price: As of March 27, 2025, the stock closed at EGP 23.30 per share.
52-Week Range: The stock has traded between EGP 16.62 and EGP 35.12 over the past 52 weeks.
Technical Analysis:
Previous Close is 23.2 EGP/share , to buy below 24.0 EG/Share, below EMA200 now is in good daily support zone is match with Gann fan, SCM demand zone and Money flow profile ROC=24.6
is good buy zone .
The Gann Square of Nine is a technical analysis tool developed by W.D. Gann, used to identify potential support and resistance levels based on geometric and numerical relationships. The formula you've referenced, ((17.6)^1/2 + 2))^2 = 38, suggests a target price of EGP 38 per share. This aligns with certain Gann methodologies, where adding a constant to the square root of a price and then squaring the result can indicate significant price levels.
63 % profit
Refer to
1) CHF Cairo Financial Holding Alpha Spotter FV=30.1 ~ 35.1 EGP/share
2) Faisal Company for Securities Trading FV= 31.4 EGP/share
3) Hermes : FV =30.0 EGP/share
4)Fair value per share based on the sector's book value multiple is 75.0 EGP/share
These valuations might be derived from different analytical models or could represent price targets set by various analysts.
Conclusion:
Oriental Weavers demonstrates strong financial performance with consistent revenue growth and profitability. The company's dividend policy reflects its commitment to shareholder returns. The technical analysis suggests potential price movements, but it's essential to consider these in conjunction with fundamental analysis and broader market conditions.
Note: Financial markets are influenced by numerous factors. It's advisable to consult with a financial advisor or conduct comprehensive research before making investment decisions.*


