OPEN-SOURCE SCRIPT
Trend Thrust Indicator - Rafka
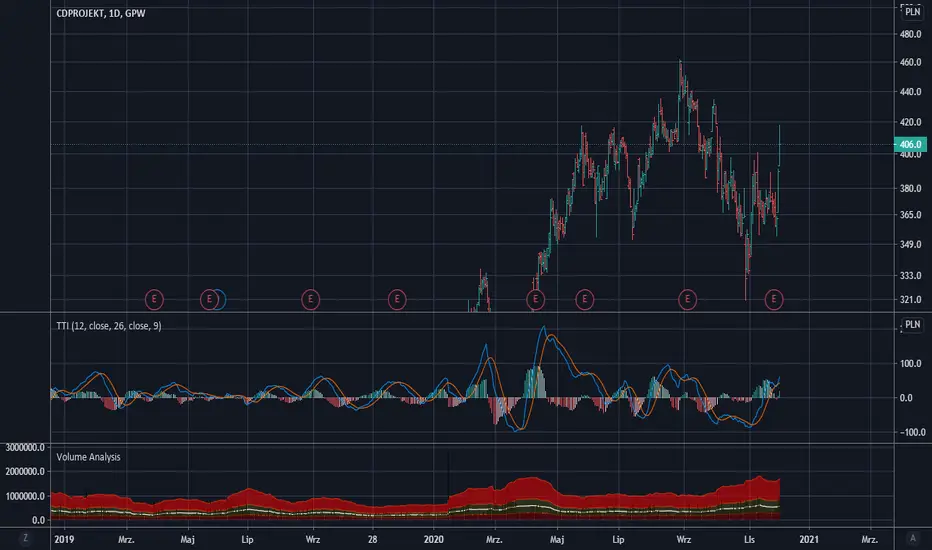
This indicator defines the impact of volume on the volume-weighted moving average, emphasizing trends with greater volume.
What determines a security’s value? Price is the agreement to exchange despite the possible disagreement in value. Price is the conviction, emotion, and volition of investors. It is not a constant but is influenced by information, opinions, and emotions over time. Volume represents this degree of conviction and is the embodiment of information and opinions flowing through investor channels. It is the asymmetry between the volume being forced through supply (offers) and demand (bids) that facilitates price change. Quantifying the extent of asymmetry between price trends and the corresponding volume flows is a primary objective of volume analysis. Volume analysis research reveals that volume often leads price but may also be used to confirm the present price trend.
Trend thrust indicator
The trend thrust indicator (TTI), an enhanced version of the volume-weighted moving average convergence/divergence (VW-Macd) indicator, was introduced in Buff Pelz Dormeier's book 'Investing With Volume Analysis'. The TTI uses a volume multiplier in unique ways to exaggerate the impact of volume on volume-weighted moving averages. Like the VW-Macd, the TTI uses volume-weighted moving averages as opposed to exponential moving averages. Volume-weighted averages weigh closing prices proportionally to the volume traded during each time period, so the TTI gives greater emphasis to those price trends with greater volume and less emphasis to time periods with lighter volume. In the February 2001 issue of Stocks & Commodities, I showed that volume-weighted moving averages (Buff averages, or Vwmas) improve responsiveness while increasing reliability of simple moving averages.
Like the Macd and VW-Macd, the TTI calculates a spread by subtracting the short (fast) average from the long (slow) average. This spread combined with a volume multiplier creates the Buff spread
Open-source script
In true TradingView spirit, the creator of this script has made it open-source, so that traders can review and verify its functionality. Kudos to the author! While you can use it for free, remember that republishing the code is subject to our House Rules.
Disclaimer
The information and publications are not meant to be, and do not constitute, financial, investment, trading, or other types of advice or recommendations supplied or endorsed by TradingView. Read more in the Terms of Use.