OPEN-SOURCE SCRIPT
Updated NY ORB, VWAP & EMAs
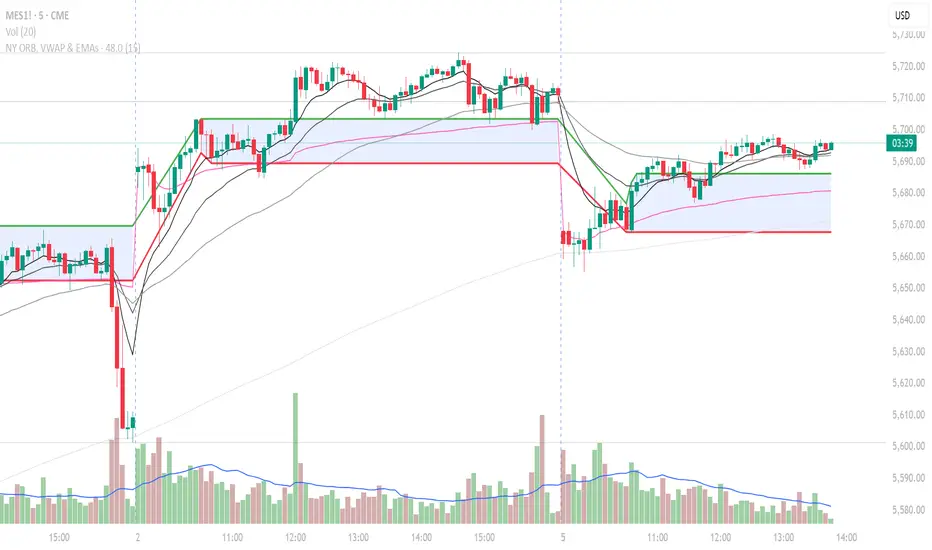
Indicator is designed to display key technical analysis tools on your Trading View chart. It includes:
One of the key benefits of this indicator is that it allows Basic Trading View users to set VWAP, EMAs, and ORB in a single indicator. This is particularly useful for users who are limited to a single indicator on their Basic plan, as it provides a comprehensive view of market sentiment, trend, and potential breakouts without the need for multiple indicators.
Features
New York Opening Range Breakout (ORB): Plots the high and low of the first 15 minutes (configurable) of the New York trading session.
Volume Weighted Average Price (VWAP): Displays the VWAP line, which can be toggled on or off.
Exponential Moving Averages (EMAs): Plots four EMAs (9, 21, 50, and 200 periods), which can also be toggled on or off.
Customization
ORB Length: Choose from 5 or 15 minutes for the ORB calculation.
Show VWAP and EMAs: Toggle the visibility of the VWAP and EMA lines on or off.
Usage
This indicator is designed to help traders identify key market levels, trends, and potential breakouts during the New York trading session. The ORB can be used to gauge market sentiment, while the VWAP provides a benchmark for average price action. The EMAs offer additional trend analysis and can be used to identify potential support and resistance levels.
Release Notes
NY ORB, VWAP & EMAs Indicator is designed to display key technical analysis tools on your chart.Features:
New York Opening Range Breakout (ORB): Plots the high and low of the first 15 minutes (configurable) of the New York trading session.
Volume Weighted Average Price (VWAP): Displays the VWAP line, which can be toggled on or off.
Exponential Moving Averages (EMAs): Plots four EMAs (9, 21, 50, and 200 periods), which can also be toggled on or off.
Customization:
ORB Length: Choose from 5 or 15 minutes for the ORB calculation.
Show VWAP and EMAs: Toggle the visibility of the VWAP and EMA lines on or off.
Advantage for Basic TV Users:
One of the key benefits of this indicator is that it allows Basic TradingView users to set VWAP, EMAs, and ORB in a single indicator. This is particularly useful for users who are limited to a single indicator on their Basic plan, as it provides a comprehensive view of market sentiment, trend, and potential breakouts without the need for multiple indicators.
Usage:
This indicator is designed to help traders identify key market levels, trends, and potential breakouts during the New York trading session. The ORB can be used to gauge market sentiment, while the VWAP provides a benchmark for average price action. The EMAs offer additional trend analysis and can be used to identify potential support and resistance levels.
Release Notes
The “NY ORB, VWAP & EMAs” indicator is a versatile tool for intraday traders, built with Pine Script v6 to identify high-probability breakout opportunities during the New York trading session. By integrating the New York Opening Range Breakout (ORB), Volume-Weighted Average Price (VWAP) with optional standard deviation bands, and Exponential Moving Averages (EMAs), it offers a confluence-based system for scalping and day trading. Optimized for low timeframes (1m–15m) and adaptable for swing trading, it generates non-repetitive buy/sell signals (hidden by default, toggleable in settings), displays ORB levels, includes customizable alerts, a shaded ORB range, and a vertical session break line, making it intuitive for traders of all levels.## Why This Mashup?
The combination of `ORB, VWAP, and EMAs` addresses distinct yet complementary aspects of market behavior:
- NY ORB: Captures the volatility and directional bias established during the first 15 minutes of the New York session (9:30 AM–9:45 AM EST), a period known for high liquidity and institutional activity. Breakouts above or below this range often signal strong momentum.
- VWAP with SD Bands: VWAP reflects the volume-weighted average price, a key institutional benchmark. Optional ±1 standard deviation bands highlight overbought/oversold zones, refining breakout validation.
- `EMAs (9, 21, 50, 200)`: Provide multi-timeframe trend context. Shorter `EMAs (9, 21)` identify immediate momentum, while longer `EMAs (50, 200)` confirm the broader trend, filtering out false breakouts.
This mashup is original because it combines ORB breakouts with VWAP and EMA confluence, offers non-repetitive signals that are hidden by default for user flexibility, and includes a toggleable session break line and VWAP bands. The shaded ORB range and alertable signals enhance usability, distinguishing it from generic scalping tools.
## What It Does
The indicator:
- Plots the high and low of the NY ORB (default: 15-minute range at 9:30 AM EST) as horizontal lines to identify breakout levels.
- Displays the `VWAP` line to gauge institutional bias (price above VWAP = bullish, below = bearish).
- Overlays four `EMAs` (9, 21, 50, 200) to assess short- and long-term trends.
- Generates buy/sell signals when price breaks the `ORB` range, provided it aligns with VWAP and EMA conditions (e.g., price above VWAP and 9/21 EMAs for buys).
- Shades the ORB range for visual clarity and optionally plots `VWAP` standard deviation bands for volatility analysis.
## How It Works (Underlying Concepts and Calculations)
- NY ORB: The script captures the high and low of the first 15-minute candle (configurable) after 9:30 AM EST. These levels are plotted as static lines until the session ends (4:00 PM EST). A breakout occurs when price closes above the ORB high (bullish) or below the ORB low (bearish). The ORB is based on the concept that the initial range sets the session’s tone, with breakouts often driven by institutional order flow.
- VWAP: Calculated using Pine Script’s ta.vwap() function, VWAP resets daily and reflects the cumulative average price weighted by volume. It acts as a trend filter: buy signals require price above VWAP, and sell signals require price below VWAP. Optional standard deviation bands (+1/-1 SD) highlight overbought/oversold zones.
- EMAs: Computed via ta.ema(close, length) for periods 9, 21, 50, and 200. The EMAs use exponential weighting to prioritize recent price action, making them responsive to trend changes. The script checks if shorter EMAs (9, 21) are above longer EMAs (50, 200) for bullish setups or below for bearish setups, ensuring trend alignment.
- Signal Logic: A buy signal triggers when price breaks above the ORB high, is above VWAP, and the 9 EMA is above the 21 EMA. A sell signal triggers when price breaks below the ORB low, is below VWAP, and the 9 EMA is below the 21 EMA. Signals are marked with green (buy) or red (sell) labels to avoid clutter.
The integration minimizes false signals by requiring confluence across all three components, unlike single-indicator strategies that may misinterpret choppy markets.
## How to Use It
- Add to Chart: Apply the indicator to an intraday timeframe (1m–15m) on stocks, forex, or futures (e.g., MES, ES).
- Customize Settings:
- ORB Length: Select 5 or 15 minutes for the ORB range.
- VWAP: Toggle VWAP and ±1 SD bands on/off.
- EMAs: Enable/disable EMAs (9, 21, 50, 200) to declutter the chart.
- ORB Fill: Toggle the shaded ORB range for visibility.
- Session Break Line: Toggle the dashed yellow line at 9:30 AM EST.
- Show Buy/Sell Signals: Enable to display breakout signals (green/red triangles); hidden by default.
- Trading Scalping Setups:
- Buy: Wait for a breakout above ORB high, confirmed by price above VWAP and 9 EMA > 21 EMA. Enter on a strong bullish candle.
- Sell: Wait for a breakout below ORB low, confirmed by price below VWAP and 9 EMA < 21 EMA. Enter on a strong bearish candle.
- Exit: Use VWAP or ORB range midpoint as a trailing stop, or target a fixed risk-reward ratio (e.g., 2:1).
- Swing Trading: Use the 50/200 EMAs to confirm the broader trend and trade ORB breakouts in that direction.
- Risk Management: Set stop-losses below ORB low (for buys) or above ORB high (for sells). Avoid trading during low-volume periods to reduce whipsaws.
- Alerts: Set up alerts for buy/sell signals to receive real-time TradingView notifications, regardless of whether signals are plotted.
## Why It’s Original
Unlike standalone ORB scripts that may generate excessive signals or lack confluence, this indicator combines ORB breakouts with VWAP and EMA confirmation, offers non-repetitive signals that are hidden by default for user flexibility, and includes a toggleable session break line and VWAP bands. The shaded ORB range and alertable signals enhance usability, distinguishing it from standard scalping indicators.
## Disclaimer
This script is for educational purposes only and does not constitute financial advice. Always conduct your own analysis and test strategies before trading. In true TradingView spirit, this script is open-source, allowing users to review and verify its functionality. Republishing is subject to TradingView’s House Rules.
Open-source script
In true TradingView spirit, the creator of this script has made it open-source, so that traders can review and verify its functionality. Kudos to the author! While you can use it for free, remember that republishing the code is subject to our House Rules.
Disclaimer
The information and publications are not meant to be, and do not constitute, financial, investment, trading, or other types of advice or recommendations supplied or endorsed by TradingView. Read more in the Terms of Use.