OPEN-SOURCE SCRIPT
Updated Multi-Timeframe Trend Status
This Multi-Timeframe Trend Status indicator tracks market trends across four timeframes ( by default, 65-minute, 240-minute, daily, and monthly). It uses a Volatility Stop based on the Average True Range (ATR) to determine the trend direction. The ATR is multiplied by a user-adjustable multiplier to create a dynamic buffer zone that filters out market noise.
The indicator tracks the volatility stop and trend direction for each timeframe. In an uptrend, the stop trails below the price, adjusting upward, and signals a downtrend if the price falls below it. In a downtrend, the stop trails above the price, moving down with the market, and signals an uptrend if the price rises above it.
Two input parameters allow for customization:
ATR Length: Defines the period for ATR calculation.
ATR Multiplier: Adjusts the sensitivity of trend changes.
This setup lets traders align short-term decisions with long-term market context and spot potential trading opportunities or reversals.
Release Notes
Fixed a bug; the indicator results should not be affected by the graph's time frame. More option for user preferences.Release Notes
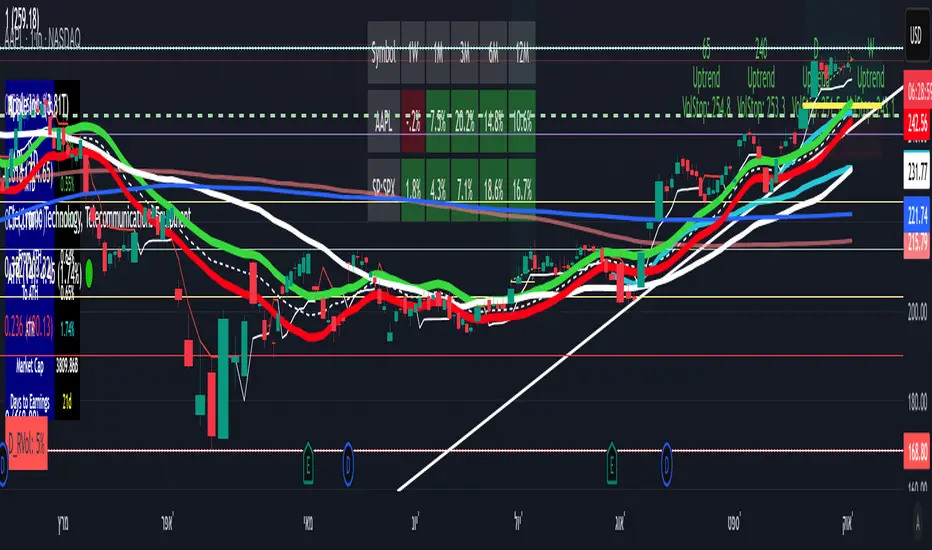
In this version some bugs are fixed.Multi-Timeframe Trend Status indicator that tracks market trends across four timeframes ( by default, 65-minute, 240-minute, daily, and monthly). It uses a Volatility Stop based on the Average True Range (ATR) to determine the trend direction. The ATR is multiplied by a user-adjustable multiplier to create a dynamic buffer zone that filters out market noise.
The indicator tracks the volatility stop and trend direction for each timeframe. In an uptrend, the stop trails below the price, adjusting upward, and signals a downtrend if the price falls below it. In a downtrend, the stop trails above the price, moving down with the market, and signals an uptrend if the price rises above it. The indicator output is presented in a table that indicates for each timeframe whether the trend direction.
Release Notes
Multi-Timeframe Trend Status Indicator This custom indicator tracks trend direction and Volatility Stop levels across four user-defined timeframes (e.g., 65min, 4h, Daily, Weekly). It uses a smoothed ATR-based logic to detect trend shifts and displays the results in a color-coded table directly on your chart.
🔧 Features:
Trend detection using Volatility Stop logic
Alerts on trend changes per timeframe
Customizable table position and font size
Visual markers for trend shifts
✅ Bug Fix:
The previous issue with dynamic alert messages has been resolved. Alerts now use static strings, ensuring full compatibility with TradingView’s alertcondition() requirements.
Open-source script
In true TradingView spirit, the creator of this script has made it open-source, so that traders can review and verify its functionality. Kudos to the author! While you can use it for free, remember that republishing the code is subject to our House Rules.
Disclaimer
The information and publications are not meant to be, and do not constitute, financial, investment, trading, or other types of advice or recommendations supplied or endorsed by TradingView. Read more in the Terms of Use.