OPEN-SOURCE SCRIPT
Updated [blackcat] L3 Magic-9 Sequential within Highlights
OVERVIEW
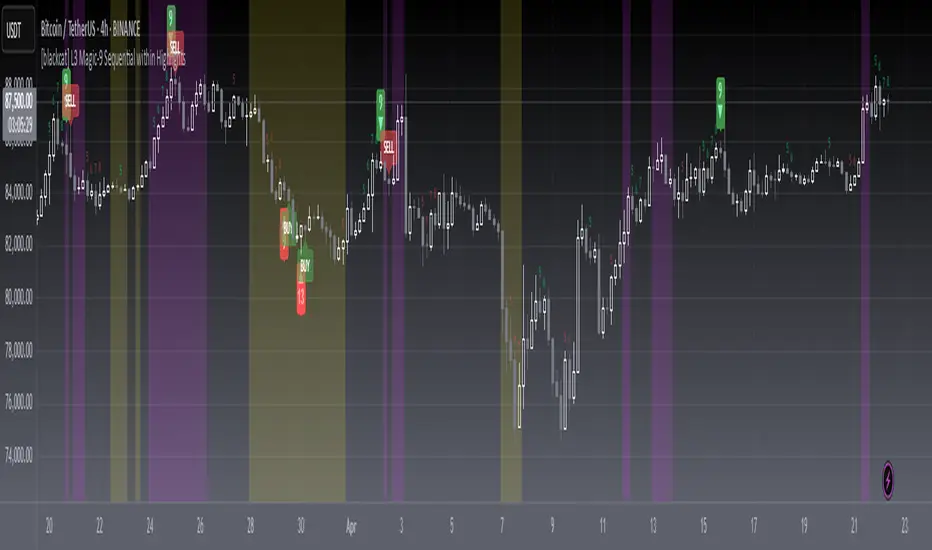
The [blackcat] L3 Magic-9 Sequential within Highlights indicator is designed to identify potential buy and sell signals based on sequential price patterns. This script uses custom functions to detect consecutive occurrences of specific conditions and highlights these patterns on the chart with labels and background colors 📊🔍.
FEATURES
Detects sequential price patterns for both bullish and bearish movements:
High sequences: 5, 6, 7, 8, 9, 12, 13 bars.
Low sequences: 5, 6, 7, 8, 9, 12, 13 bars.
Plots characters ('5', '6', etc.) and shapes (arrows) on the chart to indicate detected sequences 🏷️↗️↘️.
Uses a customizable period for calculating averages of price differences.
Highlights overbought and oversold conditions using background colors 🎨.
Generates buy ('B') and sell ('S') labels based on filtered occurrences and index values.
HOW TO USE
Add the indicator to your TradingView chart by selecting it from the indicators list.
Observe the plotted characters and arrows indicating detected sequential patterns.
Monitor the background color changes to identify overbought and oversold conditions.
Look for generated buy ('B') and sell ('S') labels for potential trading opportunities.
Customize the period and thresholds in the settings panel as needed ⚙️.
LIMITATIONS
The indicator relies heavily on sequential price patterns, which might not capture all market nuances.
False signals can occur in ranging or sideways markets 🌪️.
Users should always confirm signals with other forms of analysis before making trading decisions.
NOTES
Ensure that you have sufficient historical data available for accurate calculations.
Test the indicator thoroughly on demo accounts before applying it to live trading 🔍.
Adjust the period and threshold inputs to fit your preferred trading strategy.
Release Notes
Prevent repaintingRelease Notes
EXTENDED ANALYSISThe Magic-9 Sequential system operates across multiple dimensions:
Temporal Analysis:
9-day cycles form core reference points
13-day windows extend pattern significance
Nested loop structures ensure continuous validation
Spatial Validation:
Upward Validation:
High-9 confirmation requires prior 8-bar stability
High-13 triggers require preceding 12-bar consistency
Downward Validation:
Low-9 confirmation needs 8-bar base formation
Low-13 triggers demand 12-bar setup completion
Dynamic Thresholding:
Adaptive thresholds adjust based on Magic-9 index calculation
Background colors change intensity proportional to index deviation:
bgcolor(color=magic9_index > overbought_threshold ? color.new(color.fuchsia, 85) : na, transp=90)
PATTERN RECOGNITION ALGORITHM
The script employs a tiered pattern recognition framework:
Step 1: Cycle Formation
high_9 = count_consecutive_occurrences(close > get_reference_value(close, 4), 9) == 9 and count_consecutive_occurrences(close > get_reference_value(close, 4), 10) == 9
Verifies 9 consecutive upswings
Cross-checks against 10th bar to confirm pattern integrity
Step 2: Pattern Confirmation
plotshape(high_9, text='9\n▼', style=shape.labeldown, location=location.abovebar, ...)
Visualizes confirmed patterns with directional arrows
Dual-layered labels ensure visibility across different chart scales
Step 3: Momentum Amplification
magic9_index = magic9_high_avg / (magic9_high_avg + magic9_low_avg) * 100
Combines average gains/losses into relative strength measure
Dynamic weighting adjusts based on recent market activity
ADVANCED FILTERING TECHNIQUES
The filtering algorithm includes safety checks:
if temp_counter > 0
output := 0.0
temp_counter := temp_counter[1] - 1
else
if condition == false
output := 0.0
else
output := 1.0
temp_counter := lookback_period + 1
Prevents phantom signals through counter management
Ensures only valid pattern continuations generate alerts
USER OPTIMIZATION GUIDE
For optimal performance:
Volatility Adjustment:
Increase window sizes during volatile markets
Decrease for stable trending environments
Threshold Tuning:
Overbought/oversold levels should match asset characteristics
Crypto assets often require tighter settings (65/35)
Label Management:
Regularly delete old labels to prevent clutter
Use var label declarations for persistent markers
FUTURE ENHANCEMENT IDEAS
Potential upgrades could include:
Multi-timeframe correlation analysis
Volume-weighted pattern validation
Machine learning-based cycle prediction
Sentiment overlay integration
ETHICAL CONSIDERATIONS
Users should be aware:
⚠️ No trading strategy guarantees profits
⚠️ Always backtest new parameters
⚠️ Consider adding stop-loss mechanisms
⚠️ Monitor transaction costs impact
Open-source script
In true TradingView spirit, the creator of this script has made it open-source, so that traders can review and verify its functionality. Kudos to the author! While you can use it for free, remember that republishing the code is subject to our House Rules.
Avoid losing contact!Don't miss out! The first and most important thing to do is to join my Discord chat now! Click here to start your adventure: discord.com/invite/ZTGpQJq 防止失联,请立即行动,加入本猫聊天群: discord.com/invite/ZTGpQJq
Disclaimer
The information and publications are not meant to be, and do not constitute, financial, investment, trading, or other types of advice or recommendations supplied or endorsed by TradingView. Read more in the Terms of Use.