OPEN-SOURCE SCRIPT
Liquidity Sweep with EMA
This Pine Script indicator helps traders identify potential market reversals based on liquidity sweeps, where the price moves through the previous candle's low or high and then closes above or below the previous candle's wick. These are often seen as significant market moves or liquidity grabs before a potential reversal or continuation.
The indicator is also equipped with an EMA (Exponential Moving Average) as an optional visual aid to give traders a sense of the prevailing trend, though it is not used as part of the signal generation logic.
Key Features:
Liquidity Sweep Detection:
Bullish Sweep: Triggered when the current candle sweeps below the low of the previous candle and then closes above the high of the previous candle. This indicates a potential market reversal to the upside after the liquidity sweep.
Bearish Sweep: Triggered when the current candle sweeps above the high of the previous candle and then closes below the low of the previous candle. This indicates a potential market reversal to the downside after the liquidity sweep.
EMA:
The EMA (50) is plotted on the chart for visual trend guidance. While it is not used to confirm the signals, it can help traders see if the market is in a general uptrend or downtrend.
Signal Presentation:
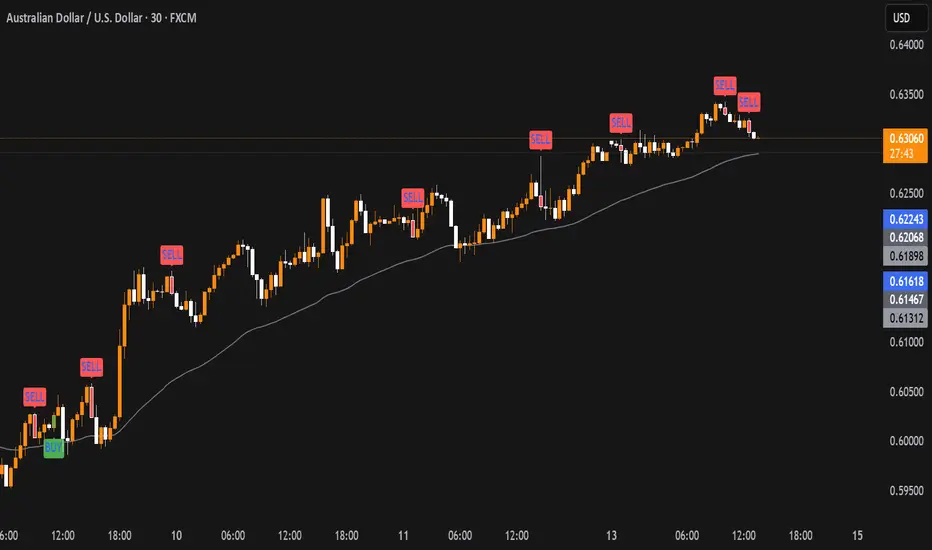
Buy Signal: The indicator will plot a green upward arrow below the candle when a bullish liquidity sweep is detected.
Sell Signal: The indicator will plot a red downward arrow above the candle when a bearish liquidity sweep is detected.
Timeframe Filter:
The indicator only generates signals on the following timeframes: 30-minute, 1-hour, 4-hour, and Daily. This helps to ensure the sweeps are significant and likely to result in meaningful price moves.
Alerts:
Alerts can be set up for both bullish and bearish sweep signals, so traders can be notified when these events occur.
Customizable:
EMA Length: The length of the Exponential Moving Average (EMA) can be adjusted. By default, it is set to 50, but you can modify this to fit your trading strategy.
Show EMA Option: You can toggle whether or not to display the EMA line on the chart.
How It Works:
The indicator looks for price action patterns where the current candle sweeps through the high or low of the previous candle and closes beyond the previous wick.
These patterns are often seen as potential traps, where the price initially moves in one direction (sweeping the liquidity) and then quickly reverses, making them important for traders who want to catch reversals or breakouts after a liquidity sweep.
The EMA (50) gives a general trend direction but doesn't directly affect the trade signals. It serves as a visual reference for trend analysis.
Potential Use Cases:
Reversal Trading: Traders can use this indicator to catch reversals after a liquidity sweep. The green upward arrows may indicate a bullish reversal, while the red downward arrows may indicate a bearish reversal.
Trend Trading: The EMA can help traders gauge the overall market trend. If the price is above the EMA, the market may be in an uptrend, and traders may focus on bullish sweeps. Conversely, if the price is below the EMA, the market may be in a downtrend, and traders may focus on bearish sweeps.
Confirmation with Other Indicators: Although the EMA is not used to confirm signals in this script, it can be combined with other indicators (like RSI, Volume, or MACD) to enhance the accuracy of your trades.
Final Thoughts:
This script is designed to identify liquidity sweeps and price reversals based on price action alone, without relying on complex indicators. The optional EMA serves as a helpful tool for understanding the overall market trend. It’s ideal for traders looking to spot potential reversal points after significant price sweeps and is suitable for multiple timeframes (30m, 1h, 4h, Daily).
You can use this description to help potential users understand the functionality of your indicator when publishing it on TradingView or selling it as an invite-only script. Let me know if you need any adjustments or further details!
The indicator is also equipped with an EMA (Exponential Moving Average) as an optional visual aid to give traders a sense of the prevailing trend, though it is not used as part of the signal generation logic.
Key Features:
Liquidity Sweep Detection:
Bullish Sweep: Triggered when the current candle sweeps below the low of the previous candle and then closes above the high of the previous candle. This indicates a potential market reversal to the upside after the liquidity sweep.
Bearish Sweep: Triggered when the current candle sweeps above the high of the previous candle and then closes below the low of the previous candle. This indicates a potential market reversal to the downside after the liquidity sweep.
EMA:
The EMA (50) is plotted on the chart for visual trend guidance. While it is not used to confirm the signals, it can help traders see if the market is in a general uptrend or downtrend.
Signal Presentation:
Buy Signal: The indicator will plot a green upward arrow below the candle when a bullish liquidity sweep is detected.
Sell Signal: The indicator will plot a red downward arrow above the candle when a bearish liquidity sweep is detected.
Timeframe Filter:
The indicator only generates signals on the following timeframes: 30-minute, 1-hour, 4-hour, and Daily. This helps to ensure the sweeps are significant and likely to result in meaningful price moves.
Alerts:
Alerts can be set up for both bullish and bearish sweep signals, so traders can be notified when these events occur.
Customizable:
EMA Length: The length of the Exponential Moving Average (EMA) can be adjusted. By default, it is set to 50, but you can modify this to fit your trading strategy.
Show EMA Option: You can toggle whether or not to display the EMA line on the chart.
How It Works:
The indicator looks for price action patterns where the current candle sweeps through the high or low of the previous candle and closes beyond the previous wick.
These patterns are often seen as potential traps, where the price initially moves in one direction (sweeping the liquidity) and then quickly reverses, making them important for traders who want to catch reversals or breakouts after a liquidity sweep.
The EMA (50) gives a general trend direction but doesn't directly affect the trade signals. It serves as a visual reference for trend analysis.
Potential Use Cases:
Reversal Trading: Traders can use this indicator to catch reversals after a liquidity sweep. The green upward arrows may indicate a bullish reversal, while the red downward arrows may indicate a bearish reversal.
Trend Trading: The EMA can help traders gauge the overall market trend. If the price is above the EMA, the market may be in an uptrend, and traders may focus on bullish sweeps. Conversely, if the price is below the EMA, the market may be in a downtrend, and traders may focus on bearish sweeps.
Confirmation with Other Indicators: Although the EMA is not used to confirm signals in this script, it can be combined with other indicators (like RSI, Volume, or MACD) to enhance the accuracy of your trades.
Final Thoughts:
This script is designed to identify liquidity sweeps and price reversals based on price action alone, without relying on complex indicators. The optional EMA serves as a helpful tool for understanding the overall market trend. It’s ideal for traders looking to spot potential reversal points after significant price sweeps and is suitable for multiple timeframes (30m, 1h, 4h, Daily).
You can use this description to help potential users understand the functionality of your indicator when publishing it on TradingView or selling it as an invite-only script. Let me know if you need any adjustments or further details!
Open-source script
In true TradingView spirit, the creator of this script has made it open-source, so that traders can review and verify its functionality. Kudos to the author! While you can use it for free, remember that republishing the code is subject to our House Rules.
Disclaimer
The information and publications are not meant to be, and do not constitute, financial, investment, trading, or other types of advice or recommendations supplied or endorsed by TradingView. Read more in the Terms of Use.