OPEN-SOURCE SCRIPT
Updated Median of Means Estimator
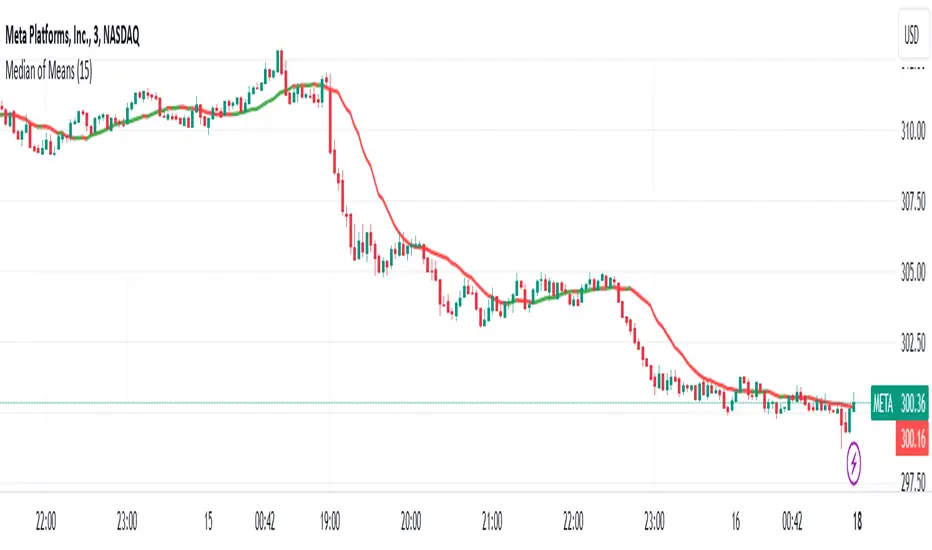
Median of Means (MoM) is a measure of central tendency like mean (average) and median. However, it could be a better and robust estimator of central tendency when the data is not normal, asymmetric, have fat tails (like stock price data) and have outliers. The MoM can be used as a robust trend following tool and in other derived indicators.
Median of means (MoM) is calculated as follows, the MoM estimator shuffles the "n" data points and then splits them into k groups of m data points (n= k*m). It then computes the Arithmetic Mean of each group (k). Finally, it calculate the median over the resulting k Arithmetic Means. This technique diminishes the effect that outliers have on the final estimation by splitting the data and only considering the median of the resulting sub-estimations. This preserves the overall trend despite the data shuffle.
Below is an example to illustrate the advantages of MoM
Set A Set B Set C
3 4 4
3 4 4
3 5 5
3 5 5
4 5 5
4 5 5
5 5 5
5 5 5
6 6 8
6 6 8
7 7 10
7 7 15
8 8 40
9 9 50
10 100 100
Median 5 5 5
Mean 5.5 12.1 17.9
MoM 5.7 6.0 17.3
For all three sets the median is the same, though set A and B are the same except for one outlier in set B (100) it skews the mean but the median is resilient. However, in set C the group has several high values despite that the median is not responsive and still give 5 as the central tendency of the group, but the median of means is a value of 17.3 which is very close to the group mean 17.9. In all three cases (set A, B and C) the MoM provides a better snapshot of the central tendency of the group. Note: The MoM is dependent on the way we split the data initially and the value might slightly vary when the randomization is done sevral time and the resulting value can give the confidence interval of the MoM estimator.
Release Notes
Updated default length to 15 use lengths which are multiples of 3. Release Notes
minor update Open-source script
In true TradingView spirit, the creator of this script has made it open-source, so that traders can review and verify its functionality. Kudos to the author! While you can use it for free, remember that republishing the code is subject to our House Rules.
Disclaimer
The information and publications are not meant to be, and do not constitute, financial, investment, trading, or other types of advice or recommendations supplied or endorsed by TradingView. Read more in the Terms of Use.
Open-source script
In true TradingView spirit, the creator of this script has made it open-source, so that traders can review and verify its functionality. Kudos to the author! While you can use it for free, remember that republishing the code is subject to our House Rules.
Disclaimer
The information and publications are not meant to be, and do not constitute, financial, investment, trading, or other types of advice or recommendations supplied or endorsed by TradingView. Read more in the Terms of Use.