DI/ADX Trend Strategy | (1-Min Scalping)Strategy Overview
This is an experimental 1-minute trend-following strategy combining DI+/DI-, ADX, RSI, MACD, VWAP, and EMA filters with a time-based exit. It aims to catch strong directional moves while strictly managing risk.
Indicator Components
• DI+/DI- + ADX – Trend direction + strength filter
• RSI (14) – Momentum confirmation (RSI > 55 or < 45)
• MACD Histogram – Detects directional momentum shifts
• Candle Body % Filter – Screens for strong commitment candles
• EMA 600 / 2400 – Long-term trend alignment
• Weekly VWAP – Entry only when price is above/below VWAP
• Trade Limit – Max 2 trades per direction per VWAP cycle
• Time-Based Stop – 0.50% SL, 3.75% TP, 12h (720 bars) time stop
Entry Logic
Long Entry:
• DI+ crosses above DI−
• RSI > 55
• MACD histogram > 0
• Strong bullish candle
• Price > VWAP
• EMA600 > EMA2400
• Within 25 bars of EMA crossover
• Max 2 long trades before VWAP resets
Short Entry:
• DI+ crosses below DI−
• RSI < 45
• MACD histogram < 0
• Strong bearish candle
• Price < VWAP
• EMA2400 > EMA600
• Within 25 bars of EMA crossover
• Max 2 short trades before VWAP resets
Exit Logic
• Stop Loss: 0.50%
• Take Profit: 3.75% (7.5R)
• Time Stop: 720 bars (~12 hours on 1m chart)
• Each trade exits independently
Testing Parameters
• Initial Capital: $10,000
• Commission: 0.10%
• Timeframe: 1-minute
• Tested on: BTCUSDT, ETHUSDT
• Pyramiding: Up to 5 positions allowed
• VWAP resets trade counter to reduce overtrading
Alerts
• Buy / Sell signal
• Trade Opened / Closed
• SL/TP triggered
⚠️ Notes
• Early-stage strategy — entry count varies by trend conditions
• Shared for educational use and community feedback
• Please forward-test before using live
• Open-source — contributions and suggestions welcome!
Disclaimer
This strategy is for educational purposes only and should not be considered financial advice. Past performance does not guarantee future results. Always validate independently before trading live.
Indicators and strategies

Infalible Universal 2:1 Estrategia🔹 "Infalible Universal 2:1 Strategy" – Optimized for All Markets and Timeframes
This strategy combines proven technical indicators with a dynamic risk management model to deliver consistent and optimized entries, especially on lower timeframes like 5 and 15 minutes.
Core Components:
📈 Entry Signals:
Trades are triggered when a fast Simple Moving Average (SMA) crosses over or under a slow SMA, with confirmation from a strong trend (ADX filter).
🎯 Dynamic Take Profit and Stop Loss:
Positions are exited based on a 2:1 Risk/Reward ratio, calculated using the current Average True Range (ATR). This allows the system to adapt to market volatility and remain effective across any asset.
🧱 Visual SL/TP Zones:
Colored rectangles highlight the Stop Loss (red) and Take Profit (green) areas on the chart, helping traders clearly visualize risk and reward at every entry.
🧠 Clean and Effective Logic:
No repainting. No lagging signals. Fully backtestable. Alerts included for long and short entries.
Whether you're trading forex, crypto, indices, or stocks, this universal strategy adapts to market behavior and focuses on consistent execution through disciplined risk management.

Intraday Momentum StrategyExplanation of the StrategyIndicators:Fast and Slow EMA: A crossover of the 9-period EMA over the 21-period EMA signals a bullish trend (long entry), while a crossunder signals a bearish trend (short entry).
RSI: Ensures entries are not in overbought (RSI > 70) or oversold (RSI < 30) conditions to avoid reversals.
VWAP: Acts as a dynamic support/resistance. Long entries require the price to be above VWAP, and short entries require it to be below.
Trading Session:The strategy only trades during a user-defined session (e.g., 9:30 AM to 3:45 PM, typical for US markets).
All positions are closed at the session end to avoid overnight risk.
Risk Management:Stop Loss: 1% below/above the entry price for long/short positions.
Take Profit: 2% above/below the entry price for long/short positions.
These can be adjusted via inputs for optimization.
Position Sizing:Fixed lot size of 1 for simplicity. Adjust based on your account size during backtesting.

Reversal Strategy with MTF S/R, MACD, RSI, Doji + SL/TP + ArrowsHere is a comprehensive Python trading strategy script using 15-minute, 1-hour, and 4-hour support/resistance, combined with MACD, RSI, and Doji candlestick reversal detection. This script uses Pandas, TA-Lib (or ta), and Plotly/Matplotlib for analysis and visualization. Arrows are plotted where Doji reversal patterns occur.
support_1h and support_4h are just emulated by increasing the lookback period (20 for 15m, 80 for 1h, 320 for 4h). Ideally, you should resample the data.
The doji detector is basic but effective for small-body candles.
You can enhance signal confirmation by adding volume, Bollinger Bands, or divergence filters.
To integrate with live trading, use ccxt or your broker's API for real-time data and order execution.

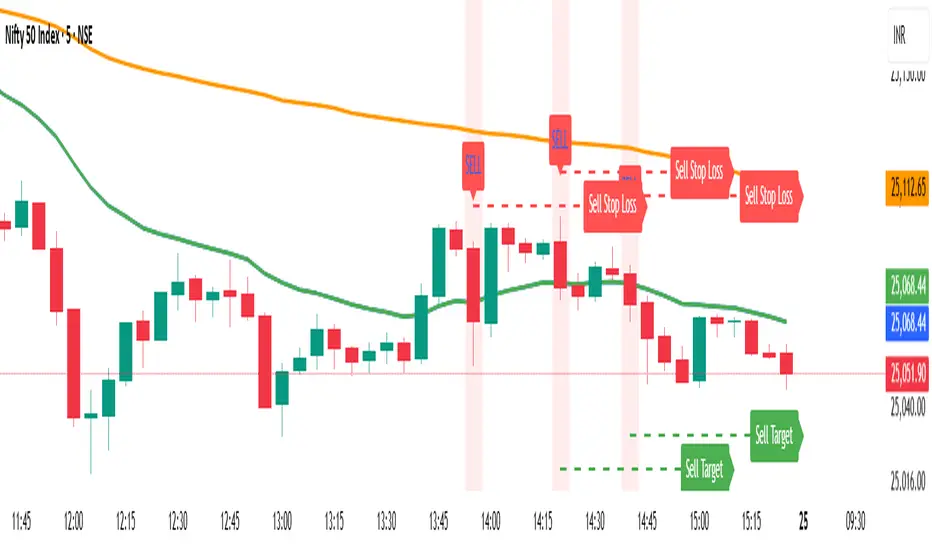
EMA 20 and Anchored VWAP with Typical PriceIntraday scalping using EMA 20 and VWAP along with targets and Stoploss
Refined MA + Engulfing (M5 + Confirmed Structure Break)I would like to start by saying that this strategy was put together using ChatGPT, some past trades from myself and some backtested trades, and from my time as a student in Wallstreet Academy under Cue Banks.
I am not profitable yet. I am too jumpy and blow accounts. I'm hoping this strategy (and it's indicator twin) can help me spend less time on the charts, so that I'm not tempted to press buttons as much.
It does fire quite a bit. But, the Strategy Tester tab shows a 30% win rate with our wins being significant to our losses. So, in theory, if you followed the rules of this strategy STRICTLY, you COULD BE profitable.
With that being said, there are times that this strategy has shown to trigger and I ask, "Why?".
I just want to help myself and others, and maybe make some decent\cool stuff along the way. Enjoy
KR

Universal Trading Strategy; Entry + ExitBeginner-Friendly Trading Strategy with Automated Alerts.
This strategy is designed for simplicity and clarity, providing automatic trade signals based on three key conditions. It includes both long and short setups, along with clearly defined take profit and stop loss levels using the Donchian Channel.
Long Entry Conditions
A long signal is triggered when all of the following conditions are met:
- The stock price is above the 200-period EMA
- The MACD histogram crosses from negative to positive (momentum shift upwards)
- The Volume Oscillator is positive (above the zero line)
Short Entry Conditions
A short signal is triggered when all of the following conditions are met:
- The stock price is below the 200-period EMA
- The MACD histogram crosses from positive to negative (momentum shift downwards)
- The Volume Oscillator is positive (above the zero line)
Exit Conditions (for both Long and Short)
Positions are closed based on the Donchian Channel:
For long trades:
- Take Profit at the upper Donchian Band
- Stop Loss at the lower Donchian Band
For short trades:
- Take Profit at the lower Donchian Band
- Stop Loss at the upper Donchian Band
Alert & Trade Management
Only one trade is active at a time (no stacking of multiple signals).
Once a trade is entered, no new alerts are triggered until the position is closed.
Alerts are only fired once per entry and once per exit (either TP or SL).
This setup offers a clear, rules-based system suitable for traders seeking structure and minimal noise in their trading decisions.

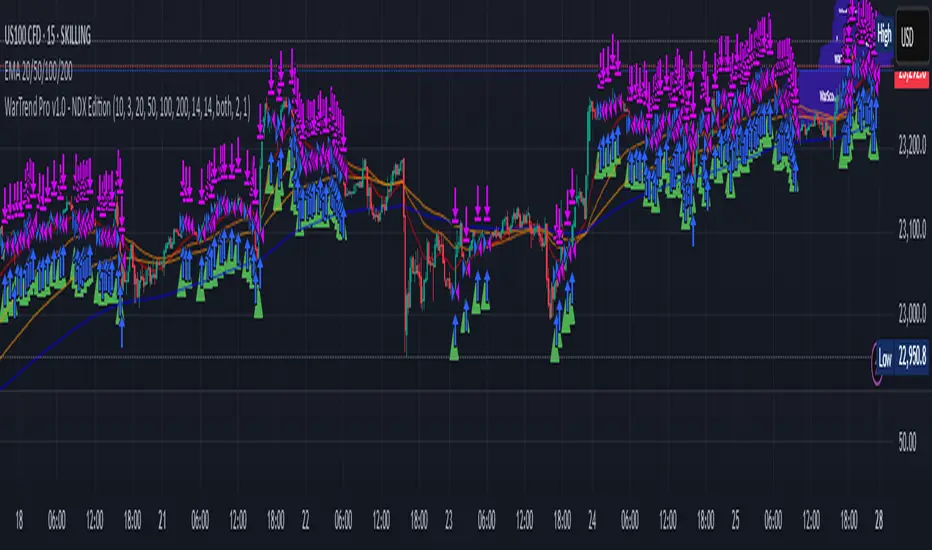
WarTrend Pro v1.0 - NDX EditionWarTrend Pro v1.0 is a high-frequency intraday strategy tailored for the NASDAQ 100 Index (NDX) on the 1H timeframe.
It is engineered for professional traders seeking to combine momentum, structure, and market psychology into a single automated trading system.
Built around a customized SuperTrend logic, the system integrates a set of 11 tactical conditions. A trade is only triggered when 3 or more conditions are simultaneously validated, ensuring high-conviction entries.
Entry Conditions (Long only in v1.0):
✅ SuperTrend turns bullish (price > ATR band)
✅ ADX confirms strong trend (>25)
✅ Price above EMA stack (20, 50, 100, 200)
✅ RSI breakout from neutral zone
✅ Volume anomaly or price reversal candle
✅ Optional: bullish MFI crossover, MACD slope, Keltner confirmation, divergence detection
Exit Conditions:
SL and TP are calculated from volatility-adjusted ranges
Trailing stop can be optionally enabled
Exit also triggered on signal reversal (SuperTrend or ADX flip)
💡 How to Use It
Apply on 1H timeframe (NDX)
Customize risk settings, SL/TP logic, and session filters
Optional: combine with news filters or macro overlays for discretionary enhancement
*License
This strategy is part of the WTRADE Project – Institutional Edition.
Reproduction, republishing, or commercial use without permission is prohibited.
15-Min Option Trend Strategy with AlertsSimple buy and sell strategy using RSI and SUPERTREND with price action. D'Trader

Pivot Squeeze StrategyStrategy based on Pivot Squeeze Oscillator Indicator for backtesting.
Features:
- Pivot Lookback adjustment
- Trade Both Directions, Long Trades Only, Short Trades Only
- Use Pivot Divergence Breakout logic, Pivot Divergence MA Cross Zero logic, or Pivot Divergence MA Cross Slow MA logic
- Adjustments for Breakout Threshold
- Risk Management (Stop Loss/Take Profit/etc)
- Visual Information
- Backtesting Period customization

Infalible SL y TP estrategy
**🔥 Professional Trend-Following Strategy with Dynamic Risk Management**
#### 📈 **Key Features**
✅ **High-Probability Entries:** Uses **ADX > 25** to trade only strong trending markets.
✅ **Smart Stop Loss:** Dynamic **2x ATR** trailing stop to adapt to volatility.
✅ **2:1 Risk-Reward:** Take Profit levels set at **2x SL distance** for consistent gains.
✅ **Real-Time Visuals:** Auto-updating TP/SL lines and entry markers.
---
#### 🛠 **Indicators Used**
1. **SMAs (14 & 28):** Classic crossover for entry signals.
2. **ADX (14):** Filters trades in strong trends (ADX ≥ 25).
3. **ATR (14):** Calculates stop loss distance (2x ATR).
---
#### ⚙ **Recommended Settings**
- **Markets:** Forex, Crypto, Trending Stocks.
- **Timeframes:** 15min - 4H (day trading) or Daily (swing trading).
- **Customizable:**
- `ATR Multiplier` (default: `2.0`).
- `Risk-Reward Ratio` (default: `2:1`).
---
#### 📉 **Entry/Exit Rules**
🔹 **LONG:**
- When **SMA(14) crosses ABOVE SMA(28)** + **ADX ≥ 25**.
- **SL:** Entry price - (2 x ATR).
- **TP:** Entry price + (4 x ATR).
🔹 **SHORT:**
- When **SMA(14) crosses BELOW SMA(28)** + **ADX ≥ 25**.
- **SL:** Entry price + (2 x ATR).
- **TP:** Entry price - (4 x ATR).
---
#### 🎨 **Clear Visualization**
- Fast SMA (blue) & Slow SMA (red).
- Live TP (green) and SL (red) levels.
---
#### 💡 **Why This Works**
✔ **Fewer False Signals:** ADX filter avoids choppy markets.
✔ **Adaptive Risk:** ATR-based SL adjusts to volatility.
✔ **Professional-Grade:** Strict 2:1 risk-reward discipline.
---
#### 📢 **Backtest & Optimize!**
👉 **Tip:** Tweak `ATR Multiplier` for different assets (e.g., 1.5 for forex, 3 for crypto).
👉 **Pro Tip:** Use TradingView’s **Strategy Tester** to optimize parameters.
📌 **Want a Trailing Stop or Volume Filter? Comment below!**
---
🔹 **Disclaimer:** Past performance ≠ future results. Always backtest before live trading.
---
### 🌟 **Like & Follow for More Advanced Strategies!** 🌟

Swing FX Pro Panel v1Description:
"Swing FX Pro Panel v1" is a professional swing trading strategy tailored for the Forex market and other highly liquid assets. The core logic is based on the crossover of two Exponential Moving Averages (EMA), allowing the strategy to detect trend shifts and generate precise entry signals.
The script includes an interactive performance panel that dynamically displays:
initial capital,
risk per trade (%),
the number of trades taken during a selected period (e.g., 6 months),
win/loss statistics,
ROI (Return on Investment),
maximum drawdown,
win ratio.

EMA 7/25/99/200 StrategyBuy when EMA 7 crosses above EMA 25
Sell when EMA 7 crosses below EMA 25
Notes:
This strategy does not include stop loss or take profit.
It uses market orders based on EMA 7/25 crossover.
The longer EMAs (99/200) are plotted for context but not yet used in decision logic — you can incorporate them for trend filtering if needed.
For Better Results it would be for larger Timeframes (4H to 1D).


tiktok strat5 minute timeframe only!!!
first 15 minutes of market open is a range
trades breakouts on that range

Channel breakoutcreates a "channel" of the highest and lowest value of the past 20 bars
trades breakouts of that channel
works for almost any timeframe on various different assets, though I'd recommend testing first

SPY Hybrid ORE Strategy v3This Pine Script strategy implements a SPY Hybrid Opening Range Expansion (ORE) Strategy that trades breakouts from the daily opening range during specific market hours (9:30-11:30 AM). The strategy identifies "sucker moves" - situations where the opening range is unusually large compared to historical volatility (ATR) - and then trades breakouts in the opposite direction of the initial move.
For long positions, it enters when price breaks above the previous bar's high after a large opening range in bullish market conditions (price above 50-day SMA), using the opening low as a stop loss and targeting a profit equal to half the opening range. For short positions, it enters on breaks below the previous bar's low during bearish conditions (price significantly below 50-day SMA with bearish momentum), using more aggressive stops and partial profit-taking. The strategy incorporates multiple filters including volatility (ATR), volume, RSI momentum, and includes risk management through position sizing based on account equity and stop distance, along with time-based exits and cooldown periods between trades.

Pivot Continuation Algorithm + PostMarketCbkworks best on 5 minute tf on NQ, currently testing performance across other markets.
Pivot continuation enters with trend when price breaks a pivot point with left and right bars 10 and 7
cbk enters with trend post market if price crosses the highest/lowest value in the past 20 bars

US Index First 30m Candle Strategy (10m Chart)Strategy Description for Publishing
Title: US Index First 30-Minute Candle Strategy (10m Chart)
Overview:
This Pine Script implements a trading strategy designed to capitalize on price movements within the first 30 minutes of the U.S. stock market opening. It is specifically tailored for use on a 15-minute chart and is optimized for trading U.S. indices during regular market hours.
Features:
Session Time Configuration: The strategy operates within the U.S. market hours, specifically from 9:30 AM to 4:00 PM (Eastern Time).
First 30-Minute Candle Aggregation: The script identifies the high and low of the first 30-minute candle, which is considered a critical time frame for market momentum.
Single Trade Per Day: To minimize risk, the strategy is designed to execute only one trade per day based on the established range of the first 30 minutes.
Dynamic Trade Conditions: Buy and sell signals are generated when the price breaks above the high or below the low of the first 30-minute candle, with defined stop-loss and take-profit levels based on a customizable risk-reward ratio.
How It Works:
Initialization:
At the start of each trading day, the script resets the high and low values for the first 30 minutes.
Range Locking: After the first 30 minutes, the high and low values are locked, allowing for trade entries based on these levels.
Trade Execution:
Long Entry: Triggered when the price moves above the locked high.
Short Entry: Triggered when the price drops below the locked low.
Risk Management: Each trade comes with a stop-loss and take-profit mechanism to manage potential losses and secure profits.
Visuals:
The script also plots the locked high and low levels on the chart, providing a visual reference for traders.
Conclusion:
This strategy leverages the volatility often seen in the first 30 minutes of trading, aiming to capture significant price movements while maintaining a disciplined trading approach. It is suitable for traders looking to implement a systematic strategy based on early market behavior.
Usage:
To use this strategy, simply add the script to your TradingView chart, set your desired parameters, and monitor for trade signals during the specified market hours. Adjust the risk-reward ratio as needed to align with your trading style.

KusKus Starlight Strategy📌 Gabriel's KusKus Starlight Strategy – Adaptive Volume-Based Momentum System
Description:
Gabriel’s KusKus Starlight Strategy is a high-precision, volume-driven trading system designed for short- to medium-term intraday setups. By combining Cumulative Volume Delta (CVD) with Fisher Transform logic, Z-Score anomaly detection, and adaptive moving averages (like Jurik MA and Super Smoother), the strategy seeks to capture early trend shifts, continuation breakouts, and statistically favorable reversals.
🧠 How It Works
CVD-Based Fisher Oscillator
Transforms volume delta imbalances into clean trend signals using a Fisher Transform with dual-stage smoothing.
Jurik Signal Line & Super Smoother
Provides confirmation filters that reduce whipsaw trades by identifying prevailing trend direction.
Z-Score & Velocity Boosters
Highlight when momentum is accelerating with statistical outliers, improving early entry timing.
ATR-Driven Trade Management
All entries use dynamically calculated Stop Loss and Take Profit levels based on ATR, with optional hour-specific overrides.
🎯 Strategy Entry Conditions
🔼 Long Entry:
A long trade is entered when all the following are true:
Fisher (smoothedFish) crosses above 0
Z-Score (ZKusKus) is rising or Z-Score velocity is rising
Fisher is above the Jurik MA (signal)
Price (src) is above the Super Smoother MA (ma)
Time filter is allowed (optional setting)
🔽 Short Entry:
A short trade is entered when all the following are true:
Fisher (smoothedFish) crosses below 0
Z-Score (ZKusKus) is falling or Z-Score velocity is rising
Fisher is still above the Jurik MA (signal) (anticipating exhaustion)
Price (src) is below the Super Smoother MA (ma)
Time filter is allowed (optional setting)
📤 Strategy Exit Conditions
Take Profit (TP) and Stop Loss (SL) levels are based on the ATR multiplied by dynamic multipliers.
Both TP and SL can be adjusted per hour using tp_hour_* and risk_hour_* settings to reflect optimal market behavior during different sessions.
⏰ Smart Hour-Based Filters
Use include Hours to restrict trading to 3 specific hours (e.g., 7, 8, 9). Each hour has its own:
Risk % Allocation
TP Multiplier
This adds fine-tuned control over position sizing and target reachability.
📈 Recommended Timeframes:
Optimized for 30-minute ~ 1 Hour charts, but adaptable to 1m–15m with parameter tuning.
Use hourly filters to target only statistically profitable hours, London ~ New York Afterhours.
📌 Ideal Use Case:
For traders looking to fade weak volume reversals or ride volume-supported breakouts with smart, auto-adjusting position sizing—this strategy offers a refined and flexible framework grounded in real-time order flow behavior.

HSI1! First 30m Candle Strategy (15m Chart)## HSI1! First 30-Minute Candle Breakout Strategy (15m Chart) — Description
### Overview
This strategy is designed for trading **Hang Seng Index (HSI) Futures** on a 15-minute chart. It uses the price range established during the first 30 minutes of the Hong Kong main session (09:15–09:44:59) to define key breakout levels for a systematic trade entry each day.
### How the Strategy Works
#### 1. Reference Candle Period
- **Aggregation Window:** The strategy monitors the first two 15-minute bars of the session (09:15:00–09:44:59 HKT).
- **Range Capture:** It records the highest and lowest prices (the "reference high/low") during this window.
#### 2. Trade Setup
- After the 09:45 bar completes, the reference range is locked in.
- Throughout the rest of the trading day (within session hours), the strategy looks for breakouts beyond the reference range.
#### 3. Entry Rules
- **Long Entry (Buy):**
- Triggered if price rises to or above the reference high.
- Only entered if the user's settings permit "Buy Only" or "Both".
- **Short Entry (Sell):**
- Triggered if price falls to or below the reference low.
- Only entered if the user's settings permit "Sell Only" or "Both".
- **Single trade per day:**
- Once any trade executes, no additional trades are opened until the next session.
#### 4. Exit Rules
- **Take Profit (TP):**
- Target profit is set to a distance equal to the initial range added above the long entry (or subtracted below the short entry).
- Example: For a 100-point range, a long trade targets entry + 100 points.
- **Stop Loss (SL):**
- Longs are stopped out if price falls back to the session's reference low; shorts are stopped out if price rallies to the reference high.
#### 5. Session Control
- Active only within the regular day session (09:15–12:00 and 13:00–16:00 HKT).
- Trade tracking resets each new trading day.
#### 6. Trade Direction Manual Setting
- A user input allows restriction to "Buy Only", "Sell Only" or "Both" directions, providing discretion over daily bias.
### Example Workflow
| Step | Action |
|---------------------------|-------------------------------------------------------------------------|
| 09:15–09:44 | Aggregate first two 15m candles; record daily high/low |
| After 09:45 | Wait for a breakout (price crossing either the high or the low) |
| Long trade triggered | Enter at the reference high, target is "high + range", SL is at the low |
| Short trade triggered | Enter at the reference low, target is "low - range", SL at the high |
| Trade management | No more trades for the day, regardless of further breakouts |
| End of session (if open) | Trades may be closed per further logic or left to strategy to handle |
### Key Features and Benefits
- **Discipline:** Only one trade per day, minimizing overtrading.
- **Clarity:** Transparent entry/exit rules; no discretionary execution.
- **Flexibility:** User can bias system to buy-only, sell-only, or allow both, depending on trend or personal view.
- **Simple Risk Control:** Pre-defined stop loss and profit target for every trade.
- **Works best in:** Trending, breakout-prone markets with a history of impulsive moves early in the session.
This strategy is ideal for systematic traders looking to capture the Hang Seng's early session momentum, with robust rule-based management and minimal intervention.

Vortex strategy🧠 Overview
The Vortex Strategy is a sophisticated trend-following and volatility-based trading algorithm designed for precision entries during directional market phases. It leverages Jurik smoothing, velocity filtering, and Vortex Indicator derivatives, enhanced with advanced risk management and hourly optimization. This strategy is best suited for futures and high-volume intraday markets like the CME E-Mini S&P 500 (ES1!).
🔧 Core Features
🔄 Vortex Indicator with Velocity Filter
Uses a velocity-enhanced form of the classic Vortex Indicator (VIP and VIM) to capture directional momentum.
Smooth VMP/VMM via SS & BW and pass that through a custom velocity function using RMS-scaled filtering.
📉 Super Smoother Trend Filter
Implements Ehlers' Super Smoother Filter to define trend bias dynamically.
Acts as a directional filter for long/short entry conditions, avoiding whipsaws.
🔊 Volume Velocity Confirmation
Entry signals require increasing volume velocity, calculated using RMS scaling and normalized via bandpass filtering.
🧠 Signal Conditions
Long Entry: VIP crosses above VIM, price above smoothed trend filter, and volume velocity increasing.
Short Entry: VIM crosses above VIP, price below trend filter, and volume velocity increasing.
🛡️ Risk & Trade Management
🎯 Dynamic Stop Loss & Take Profit
SL and TP are calculated using ATR smoothed with Jurik MA.
TP multiplier is customizable by hour, optimizing profit capture per trading session.
🕐 Hourly Optimization
Define up to 3 specific trade hours, each with:
Unique risk % allocation
Unique TP multipliers
Falls back to user-defined default settings if outside optimized hours, (Asia, New York).
🪙 Position Sizing
Risk-based sizing per trade.
Contracts are calculated dynamically using user/hourly risk and stop distance.
Rounded down to whole units to comply with futures contract rules.
⚙️ Advanced Tools
Jurik Moving Average (JMA): Smoothing with minimal lag
T3 Moving Average: Tilson’s smoother with configurable alpha
Laguerre Ultimate Smoother: Custom low-pass filter for signal confirmation
Hann Window FIR Filter: Optional for fine-tuned smoothing
Butterworth High-Pass & Bandpass Filters: For noise reduction and signal isolation
Z-Score Normalization: Detect extreme moves
Modular MA Framework: Plug-and-play MA type selector for quick experiments
⚙️ User Inputs (Grouped)
📌 Strategy Settings
Trade Direction: Long, Short, or Both
User-defined base risk (%)
📌 Entry Filters
Source type (hl2 default)
Vortex Length and Velocity Length
Super Smoother length
Volume Velocity length
📌 Risk & TP Settings
ATR Length, SL Multiplier, TP Multiplier
Per-hour TP/SL & risk percentages
📌 Time Filter
Toggle & configure 3 active trade hours
✅ Execution Logic
Strategy orders are submitted using strategy entry with calculated qty and a stop trigger.
Exits are handled by strategy exit with both SL and TP conditions.
Ensures each entry aligns with direction, trend filter, and volume momentum.
📈 Ideal For
Intraday futures traders (e.g., CME ES1!)
Traders needing hour-by-hour performance tuning
Strategies requiring advanced smoothing and signal validation
Quantitative backtesters analyzing risk-adjusted performance

