TernTable: VolViz
VolViz - Overview
VolViz is designed to give traders an instant volume strength visualisation tool using multiple timeframes. It provides an interactive table overlay that allows users to track volume metrics across a range of custom-selected timeframes. The table can dynamically display relative volume (RVOL), average volume, and current volume for each selected timeframes in real time.
Additionally, users can toggle various features and adjust thresholds to receive alerts for both high and low volume conditions.
Key Features
* Volume Metrics: Displays three main volume-related data points across multiple timeframes: Relative Volume (RVOL), Average Volume, and Current Volume.
* Timeframe Flexibility: Supports a range of customisable timeframes from seconds, minutes, hours to daily weekly and monthly intervals up to 12 months. Users can select which timeframes to display.
* Dynamic Table: A table is dynamically updated with data for each enabled timeframe, allowing traders to quickly compare volume data across different periods.
* Optional alert System: Includes alert functionality for high and low volume conditions based on customisable thresholds. Alerts can be set for a minimum number of timeframes for a condition to trigger.
Colour Logic
The script uses specific colours to enhance the visual alert properties that represent different ranges of Relative Volume (RVOL), which are used in the table to visually highlight the volume data:
1. Red: RVOL is less than 1.0, indicating low relative volume.
2. Green: RVOL is between 1.0 and 1.2, indicating moderate relative volume.
3. Purple: RVOL is between 1.2 and 1.5, indicating above average relative volume.
4. Orange: RVOL is between 1.5 and 2.0, indicating higher relative volume.
5. Yellow: RVOL is greater than 2.0, indicating very high relative volume.
How to use
1. Inputs:
* Volume Period: Set the period for calculating the moving average of volume (14 period default).
* The script defaults to the 2m 5m 15m 30m 1h 4h 12h D W M timeframes but user defined custom timeframes can be used (comma-separated) to specify the timeframes to track ( e.g "D,W,M,3M,6M,12M”) to a max of 10 timeframes. The table dynamically adjusts its size dependant on how many timeframes the user chooses to input.
* Table Position: Choose where to display the table: Top Left, Top Right, Bottom Left, or Bottom Right.
* Maximum Decimal Places: Control how many decimal places are shown for volume data.
2. Toggles:
* Enable High Volume Alert: Toggle this to activate the high volume alert.
* Enable Low Volume Alert: Toggle this to activate the low volume alert.
* Enable Minimum Timeframes for Alerts: Toggle this to require a specific number of timeframes to meet the alert condition before triggering.
* Pane Labels: There is also an optional debug label found in the Style tab to identify / confirm the current mode selected and the number of timeframes that meet the alert mode criteria.
The Show Row toggles can be utilised to include or exclude rows to take up less space on the chart.
* Show RVOL Row: Toggle to show the relative volume row in the table.
* Show Avg Volume Row: Toggle to show the average volume row in the table.
* Show Current Volume Row: Toggle to show the current volume row in the table.
* Show Spacer Row Below Table: Toggle to show or hide a blank spacer row below the table.
* Show Spacer Row Above Header: Toggle to show or hide a blank spacer row above the header.
3. How the Table Works:
* The table is populated with the following rows:
1. Spacer Row Above Header (optional): Adds space above the table header.
2. Header Row: Displays the timeframes (e.g., "1h", "4h", "12h", etc.).
3. Relative Volume (RVOL): Shows the RVOL for each timeframe, colored according to the thresholds.
4. Average Volume: Shows the average volume for each timeframe.
5. Current Volume: Displays the current volume for each timeframe.
6. Spacer Row Below Table (optional): Adds space below the data rows.
4. Optional Visual Alerts:
* High Volume Alert: When the current volume exceeds the default or user specified threshold compared to the average volume for the enabled timeframes.
* Low Volume Alert: When the current volume is below the default or user specified threshold compared to the average volume for the enabled timeframes.
When the visual alerts trigger unobtrusive diamonds will appear on the chart. White diamonds above the bar to indicate high volume and yellow diamonds below the bar to indicate low volume. These are not trend direction nor entry or exit signals but may be used in conjunction with other indicators for contextual purposes.
Questions or comments are always welcomed and I hope it helps with your trading !
Alertsetup

Dynamic EMA x VWAP AlertsDynamic EMA × VWAP Alerts generates buy and sell signals only when an EMA crossover happens in a meaningful VWAP (or standard deviation band) context. By combining classic EMA logic with flexible VWAP anchors (Daily, Weekly, Rolling) and optional advanced filters (ATR, Relative Volume, Deviation, Distance, Time Windows) to trim noise further, the script creates location-aware, filterable alerts rather than “everywhere” crosses. The value for trading and originality here lies in the integration of one or multiple anchors, band gating, combinator logic, and advanced regime filters. It’s designed for use across multiple instruments and timeframes, where EMA/VWAP context is relevant. It can run quietly in the background while you focus on price action and your own S/R levels.
What it does (quick take)
Detects EMA crossovers (double or optional triple) and evaluates them in VWAP context.
Plots Buy/Sell markers only when all chosen conditions are met.
Clean UX: keep all or parts of the engine visible or hide everything and let alerts run based on the silent engine behind your own S/R levels in an uncluttered, practical chart, as illustrated below.
Engine illustration: All selected engines visible
Practical use case: Same snapshot sequence as above but all selected engines invisible
Swing examples (beyond intraday)
Signals-only (clean value view):
Signals + your own S/R lines:
EMA selection (choose your playbook)
Defaults: Fast 9, Medium 21 (common intraday combo).
Modes: Double Cross — Fast vs Medium.
Triple Cross (optional) — adds a Slow EMA trend filter (enable Slow > 0).
Ranges: you can set each EMA 0–200 (0 = hidden/off)
Visuals are optional; you can display or hide each EMA line
EMA cross footprints (optional): Helps you assess trend continuation or change.
Use your own strategy: switch to 9/50, 20/50, 50/200, or whatever EMA set you trust for your instrument/timeframe.
VWAP Selection (the context engine)
Daily VWAP – resets each chart day (00:00–23:59). Typical fit: scalpers and fast intraday decision points.
Weekly VWAP – resets at the start of the calendar week. Typical fit: intraday with higher-timeframe context (aligns day trades with weekly bias).
Rolling VWAP – an adjustable VWMA-based rolling anchor (not session-reset), used as a flexible context reference Typical fit: multi-day swings when you want a flexible anchor that adapts across sessions.
Standard deviation bands (σ ±1/±2/±3) available for each anchor and help you express the “how far from fair value” idea.
Why VWAP matters: it’s a running, volume-weighted anchor where strong moves relative to VWAP and its bands help frame mean-reversion vs. trend-continuation risk. Evaluating crosses relative to VWAP/±σ reduces “everywhere” noise and helps frame potential setups.
How alerts are decided
An alert triggers only when:
Your selected EMA crossover occurs, and
Your chosen VWAP gate(s) and any filters pass. (Computed on bar close to avoid mid-bar noise)
Signals and alerts do not repaint; alerts evaluate and fire once per bar close.
Alert gates (Single / AND / OR)
Select one VWAP source or combine two (e.g., Daily + Weekly) with Single, AND, or OR logic.
Choose gate levels from VWAP or standard deviation bands (±σ). Typical long logic: price at/under VWAP or −σ. Typical short logic: price at/over VWAP or +σ.
Practical recipes:
Trend-follow: Daily AND Weekly at/above VWAP → confirms strength on two anchors.
Mean-reversion probe: Daily OR Rolling at −1σ → allows earlier fades with flexibility.
Advanced filtering: Suitable for advanced/Quant traders
During the research and development of this indicator, the EMA/VWAP cross logic was tested on historical S&P500 Futures data to explore patterns on multiple timeframes. These selected filtering indicators below showed correlation between certain market conditions and chosen indicator thresholds, helping reduce noise and lower-quality alerts. Results were research-oriented and are not predictive of future performance.
Therefore, I have built these indicator filters that run silently in the background. They let you trim noise by requiring alerts to appear only in market regimes you define. Each one constrains alert conditions; using them together helps tailor alerts to your strategy—but overly strict settings may filter out most or all alerts.
Relative Volume (RVOL): compares current volume to a baseline; ensures alerts arrive with participation instead of thin tape.
Deviation Threshold (%): controls how close the cross must be to the VWAP/σ level; tight = anchored signals, loose = more activity.
ATR Gate (+ Relative regime): keeps alerts inside a volatility regime; avoids both dead tape and chaotic spikes.
Distance Guard: requires price to be at least X ticks/% away from VWAP; useful to avoid premature signals near fair value.
Note: It’s not recommended to activate all of them at once or change the values aggressively. Unless you’ve done deeper backtesting or machine learning calibration, you can easily filter out everything. Use small thresholds at first, then adjust to your instrument once you see how each filter changes alert frequency and quality. Advanced/quant users can fine-tune freely.
Case example:
Unfiltered: Timeframe 15 min, EMA Selection 9/21, VWAP gates Rolling (250 bars) OR Weekly
Filtered: Same setup as above + activated filters:
RVOL: 100 bars, Min. RVOL 0.4
Deviation threshold (%): 0.3
ATR Length: 14
Min ATR (%): 0.05
Relative regime: Base length 2000, Min Ratio 0.85, Max Ratio 2
Under the hood
This indicator leans on TradingView built-ins (e.g., EMA, VWMA, ATR, alertcondition) to maximize speed, stability, and compatibility while we implement the custom logic (VWAP anchors, band gating, combinator gates, advanced filters, time windows). Built-ins were easy to work with and reduced edge-case bugs and kept the visuals responsive, while the design gives fine-tuning and clean visuals—so both discretionary traders and quant-minded users can shape the alerts to their strategy and workflow.
Disclaimer
The tools, scripts, and indicators presented here are provided for educational and informational purposes only. They are not financial advice and should not be interpreted as investment recommendations, trading signals, or a solicitation to buy or sell any financial instrument.
All forms of trading and investing involve risk. The past performance of any security, strategy, or market condition does not guarantee future outcomes. Users are solely responsible for their own trading and investment decisions, including evaluating their financial situation, objectives, and risk tolerance.
By using this indicator, you acknowledge that you do so at your own risk. The author accepts no liability for any direct or indirect loss or damage—including, without limitation, loss of profits—that may arise from the use of, or reliance upon, this tool.

Premium Discount Range ProPremium Discount Range Pro
Short Description / Summary:
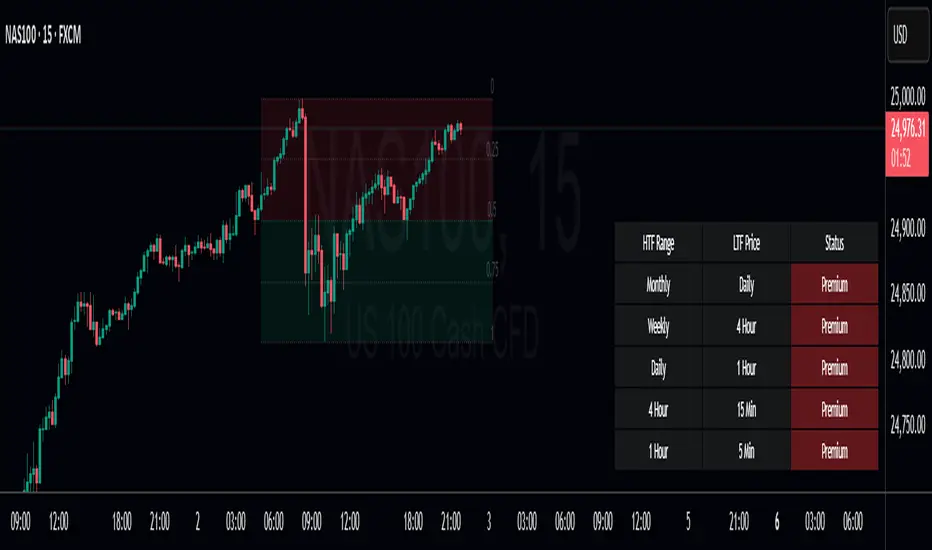
An advanced, all-in-one toolkit for traders who utilize Smart Money Concepts (SMC) and institutional price action analysis. The "Premium Discount Range Pro" automatically identifies the current higher timeframe (HTF) dealing range, visualizes the Premium, Discount, and Equilibrium zones, and provides a multi-timeframe dashboard to see where the current price stands across the market.
This indicator is built to streamline your analysis, helping you to quickly identify high-probability areas for entries by adhering to the core institutional principle: look for buys in a discount and sells in a premium.
Key Features:
Automatic HTF Range Detection: The indicator automatically detects the most recent significant swing high and swing low on your chosen Higher Timeframe (e.g., 4H, Daily) to define the current dealing range.
Premium & Discount Zone Visualization: Clear, color-coded boxes are drawn to represent the Premium (sell zone), Discount (buy zone), and the crucial Equilibrium (50%) level. These boxes extend into the future so you can anticipate future price action.
Customizable Fibonacci Levels: Plot key Fibonacci retracement levels within the defined range. You can customize which levels you want to see (e.g., 0.62, 0.79, etc.) to pinpoint specific points of interest.
Multi-Timeframe Confluence Table: A powerful, on-screen dashboard that shows you the status of the current price relative to the P&D zones on up to 5 different timeframes simultaneously. Instantly see if the price is in a Premium or Discount zone on the 15m, 1H, 4H, and Daily charts at a single glance.
Built-in Alerts: Never miss an opportunity. Set up alerts to be notified the moment the price enters the Premium or Discount zone on your chosen HTF, allowing you to prepare for potential trade setups.
Fully Customizable: Take full control over the indicator's appearance. Adjust pivot lookback periods, colors of the zones and Fibs, and select which timeframes appear in your dashboard to match your personal trading plan.
Disclaimer
This indicator is provided for educational and informational purposes only and should not be considered as financial or investment advice. Trading and investing in financial markets, including but not limited to stocks, forex, and cryptocurrencies, involves a substantial risk of loss and is not suitable for every investor.
RSI Plus +
Description:
RSI Plus + is an enhanced Relative Strength Index (RSI) indicator that provides a multi-timeframe view of RSI values across various timeframes. It highlights overbought and oversold conditions for a more comprehensive analysis, with additional focus on the Relative RSI (RRSI), which compares the current RSI to the average RSI. This provides insight into relative market strength or weakness, giving traders a clear view of how the current market conditions compare to historical averages. The indicator is ideal for spotting potential market reversals, pullbacks, or trend continuations.
Overview
RSI Plus + offers a multi-timeframe RSI display across the following timeframes:
- 2m (2 minutes)
- 5m (5 minutes)
- 15m(15 minutes)
- 30m (30 minutes)
- 1h (1 hour)
- 4h (4 hours)
- 12h (12 hours)
- Daily (1 Day)
- Weekly (1 Week)
- Monthly (1 Month)
The indicator displays a table with RSI, Average RSI, and Relative RSI (RRSI) values for each selected timeframe. The table is color-coded to indicate overbought (RSI > 70) or oversold (RSI < 30) conditions. Additionally, visual triangle alerts are plotted on the chart to signal potential trade opportunities when all selected timeframes show either overbought or oversold conditions. The RRSI provides insight into the current market’s relative strength or weakness by comparing the current RSI to its historical average.
How to Use
1. Setting Up the Indicator:
- Add RSI Plus + to your TradingView chart.
- Enable or disable timeframes using the checkboxes (e.g., 2m, 5m, 15m, Daily, Weekly, etc.) to customise the timeframes you want to analyse.
2. Understanding the Table Layout:
The indicator displays a table in the top-right corner of the chart with the following columns:
- Row 0 Timeframes (2m, 5m, 15m, 30m, 1h, 4h, 12h, Daily, Weekly, Monthly).
- Row 1 RRSI (Relative RSI: the current RSI compared to the average RSI).
- Row 2 Average RSI (The average RSI for each timeframe).
- Row 3 Current RSI (The current RSI value for each timeframe).
The RRSI (Relative RSI) row compares the current RSI with the average RSI, offering insight into the current relative strength or weakness. This allows traders to gauge whether the market is stronger or weaker compared to its historical performance within the selected timeframe.
3. Interpreting the Relative RSI (RRSI)
- RRSI > 1: If the Relative RSI (RRSI)is greater than 1, it means the current RSI is stronger than its historical average, indicating stronger market strength. This could be a sign of momentum in the direction of the trend.
- RRSI < 1: If the RRSI is below 1, it means the current RSI is weaker than its historical average, signalling relative market weakness. This may indicate the possibility of a reversal or pullback before the trend resumes.
- RRSI ~ 1: When the RRSI is around 1, it indicates that the current RSI is in line with its historical average, suggesting neutral market conditions.
4. Using the Visual Cues (Triangle Shapes):
- Green Triangle: Plotted above the price bars when all selected timeframes show RSI values above 70 (overbought), signalling potential exhaustion and a short signal or a pullback before continuation.
- Red Triangle: Plotted below the price bars when all selected timeframes show RSI values below 30*(oversold), signalling potential market reversal and long signal or a pullback before continuation*
These triangle shapes are clear visual alerts for traders to act upon when all timeframes signal extreme conditions.
5. Overbought/Oversold Conditions as Signals:
Overbought Conditions: If all selected timeframes show RSI values above 70 (green triangles appear), it suggests that the market may be overbought, signalling a potential short trade opportunity or a pullback before continuation.
Oversold Conditions: If all selected timeframes show RSI values below 30 (red triangles appear), it suggests that the market may be oversold, signalling a potential long trade or short term bounce opportunity or a pullback before continuation.
6. Set alerts for when all selected timeframes turn overbought (green triangles) or all turn oversold (red triangles). This alert condition will notify you when all selected timeframes signal extreme market conditions, which could indicate a strong reversal or continuation in price.
Notes:
RRSI provides an additional layer of analysis by showing the current relative strength or weakness of the market. A higher RRSI indicates strength relative to historical performance, while a lower RRSI signals weakness.
RSI Plus + is best used alongside other technical tools to confirm trade setups.
RRSI can help traders determine whether the market is likely to continue its trend or if a correction or reversal is imminent.
Customisable Timeframes: The RSI Plus + indicator is fully customisable, allowing you to select RSI length (RSI Period), which timeframes to analyse, from as short as 2 minutes up to monthly intervals, a personally chosen selection This gives traders the flexibility to tailor the indicator to their preferred trading style and time horizon.

Custom Previous High/Low + Breakout AlertsThis indicator plots the previous high and low of the selected timeframe and alerts you when the price breaks either level.
To prevent spam, it triggers only once per period. If both the high and low break within the same period, you will receive an alert for each, but no duplicates if price hovers around these levels.
How to Set Up Alerts
1. Choose Your Timeframe
- In the indicator settings, select the timeframe for the high/low reference.
- Example: If you select 1 hour, the indicator will plot the previous 1-hour high and low and alert you when either level is broken
2. Create an Alert
- Condition → High/Low Break Alerts
- Function → Any alert() function call
Optional:
- If you want alerts only for high breakouts or low breakouts, select High Breakout or Low Breakout and use "Once Per Bar" as the trigger. (It will still alert only once per period.)
3. Setting Alerts for Multiple Timeframes
- If you want to create another alert for a different timeframe, first select the new timeframe in the indicator settings, then create a new alert
- Note: Previous alerts will continue to notify you based on the timeframe they were originally set for, even if you change the timeframe in the indicator settings.

Time-based Alerts for Trading Windows🌟 Time-based Alerts for Trading Windows 🌐📈
This is a re-uploaded script as the previous one got hidden.
This Time-based Alerts for Trading Windows script is a highly customizable and reliable tool designed to assist traders in managing automated strategies or manually monitoring specific market conditions. Inspired by CrossTrade's Time-based Alert, this script is tailored for those who rely on precise time windows to trigger actions, such as sending webhook signals or managing Expert Advisors (EAs).
Whether you are a scalper, day trader, or algorithmic trader, this script empowers you to stay on top of your trades with fully customizable time-based alerts.
🛠️ Customizable Time Alerts
This indicator allows you to create up to 12 unique time windows by specifying the exact hour and minute for each alert. Each time window corresponds to an individual alert condition, making it perfect for managing trades during specific market sessions or key time periods.
For example:
Alert 1 can be set at 9:30 AM (market open).
Alert 2 can be set at 3:55 PM (just before market close).
Each alert can be toggled on or off in the indicator settings, allowing you to manage alerts without having to reconfigure your script.
You can adjust the colours to fit any colour scheme you like!
🕒 Odd and Even Time Alerts
The script comes with three built-in alert type categories:
Odd Alerts (marked with a green triangle on the chart): These correspond to odd-numbered inputs like Alert 1, Alert 3, Alert 5, and so on.
Even Alerts (marked with a red triangle on the chart): These correspond to even-numbered inputs like Alert 2, Alert 4, Alert 6, and so on.
You can also customize all 12 alerts individually to include a custom alert message
These alerts serve as a convenient way to differentiate between multiple trading strategies or market conditions. You can customize alert messages for odd and even alerts directly from TradingView’s alert panel.
🔗 Webhook Integration for Automation
This script is fully compatible with webhook-based automation. By configuring your alerts in TradingView, you can send signals to trading bots, EAs, or any third-party system. For example, you can:
Turn off an EA at a specific time (e.g., 3:55 PM EST).
Send buy/sell signals to your bot during predefined trading windows.
Simply use TradingView’s alert message editor to format webhook payloads for your automation system.
🌐 Timezone Flexibility
Trading happens across multiple time zones, and this script accounts for that. You can toggle between:
Eastern Time (New York): Ideal for most US-based markets.
Central Time (Exchange): Useful for futures and commodities traders.
This ensures your alerts are always in sync with your preferred time zone, eliminating confusion.
🎨 Visual Indicators
The script plots visual markers directly on your chart to indicate active alerts:
Up Facing Triangles: Represent odd-numbered alerts, providing a quick reference for these time windows.
Down Facing Triangles: Represent even-numbered alerts, helping you track different strategies or conditions.
These visual markers make it easy to see when alerts are triggered, even at a glance.
📈 Practical Use Case
Let’s say you’re trading the USTEC index on a 1-minute chart. You want to:
Turn off your trading bot at 16:55 EST to avoid after-market volatility.
Trigger a re-entry signal at 17:30 EST to capture moves during the Asian session.
Visually monitor these actions on your chart for easy reference.
This script makes it possible with precision alerts and webhook integration. Simply configure the time windows in the settings and set up your alerts in TradingView.
🚨 How to Set Up Alerts
Enable or Disable Alerts: Use the script’s settings to toggle specific alerts on or off as needed.
Set Custom Time Windows: Define the hour and minute for each alert in the settings panel.
Create Alerts in TradingView:
Go to the TradingView alert panel.
Select the condition (e.g., "Odd Time-based Alert (Green)" or "Even Time-based Alert (Red)").
Customize the alert message for webhook integration or personal notification.
Choose the trigger type: Once Per Bar or Once Per Bar Close to keep the alert active.
Integrate with Webhooks: Use the alert message field to format payloads for automation systems like MT4, MT5, or third-party bots.
📋 Key Notes
Alerts can trigger indefinitely if set to "Once Per Bar" or "Once Per Bar Close".
Always ensure the expiration date is set far in the future to avoid unexpected alert deactivation.
Test webhook messages and alert configurations thoroughly before using them in live trading.
This script is a powerful addition to your trading toolbox, offering precision, flexibility, and automation capabilities. Whether you’re turning off an EA, managing trades during market sessions, or automating strategies via webhooks, this script is here to support you.
Start using the Time-based Alerts for Trading Windows today and trade with confidence! 🚀✨

Alert Sender Library [TradingFinder]Library "AlertSenderLibrary_TradingFinder"
🔵 Introduction
The "Alert Sender Library" is a management and production program for "Alert Messages" that enables the creation of unique messages for any type of signal generated by indicators or strategies.
These messages include the direction of the signal, symbol, time frame, the date and time the condition was triggered, prices related to the signal, and a personal message from you. To make better and more optimal use of this "library", you should carefully study " Key Features" and "How to Use".
🔵 Key Features
Automatic Detection of Appropriate Type :
Using two parameters, "AlertType" and "DetectionType", which you must enter at the beginning into the "AlertSender" function, the type of the alert message is determined.
For example, if you select one of the "DetectionType"s such as "Order Block Signal", "Signal", and "Setup", your alert type will be chosen based on "Long" and "Short". Whether it's "Long" or "Short" depends on the "AlertType" you have set to either "Bullish" or "Bearish".
Automatic Symbol Detection :
Whenever you add an alert for a specific symbol, if you want the name of that symbol to be in your message text, you must manually write the name of the symbol in your message. One of the capabilities of the "Alert Sender" is the automatic detection of the symbol and adding it to the message text.
Automatic Time Frame Detection :
When adding your alert, the "Alert Sender" detects the time frame of the symbol you intend to add the alert for and adds it to the text. This feature is very practical and can prevent traders from making mistakes.
For example, a trader might add alerts for a specific symbol using a specific indicator in different time frames, taking the main signal in the 1-hour time frame and only a confirmation signal in the 15-minute time frame. This feature helps to identify in which time frame the signal is set.
Detection of Date and Time When the Signal is Triggered :
You can have the date and time at the moment the message is sent. This feature has various uses. For example, if you use the Webhook URL feature to send messages to a Telegram channel, there might be issues with alert delivery on your server, causing delays, and you might receive the message when it has lost its validity.
With this feature, you can match the sending time of the message from TradingView with the receipt time in your messenger and detect if there is a delay in message delivery.
Important :
You can also set the Time Zone you wish to receive the date and time based on.
Display of "Key Prices" :
Key prices can vary based on the type of signals. For example, when the "DetectionType" is in "Order Block Signal" mode, the key prices are the "Distal" and "Proximal" prices. Or if the "DetectionType" is in "Setup" mode, the key prices are "Entry", "Stop Loss", and "Take Profit".
Receipt of Personal "Messages" :
You can enter your personal message using "input.string" or "input.text_area" in addition to the messages that are automatically created.
Beautiful and Functional Display of Messages :
The titles of messages sent by "AlertSender" are displayed using related emojis to prevent mistakes due to visual errors, enhancing beauty.
🔵 How to Use
🟣 Familiarity with Function and Parameters
AlertSender(Condition, Alert, AlertName, AlertType, DetectionType, SetupData, Frequency, UTC, MoreInfo, Message, o, h, l, c, Entry, TP, SL, Distal, Proximal)
Parameters:
- Condition (bool)
- Alert (string)
- AlertName (string)
- AlertType (string)
- DetectionType (string)
- SetupData (string)
- Frequency (string)
- UTC (string)
- MoreInfo (string)
- Message (string)
- o (float)
- h (float)
- l (float)
- c (float)
- Entry (float)
- TP (float)
- SL (float)
- Distal (float)
- Proximal (float)
To add "Alert Sender Library", you must first add the following code to your script.
import TFlab/AlertSenderLibrary_TradingFinder/1
🟣 Parameters
"Condition" : This parameter is a Boolean. You need to set it based on the condition that, when met (or fired), you want to receive an alert. The output should be either "true" or "false".
"Alert" : This parameter accepts one of two inputs, "On" or "Off". If set to "On", the alarm is active; if "Off", the alarm is deactivated. This input is useful when you have numerous alerts in an indicator or strategy and need to activate only a few of them. "Alert" is a string parameter.
Alert = input.string('On', 'Alert', , 'If you turn on the Alert, you can receive alerts and notifications after setting the "Alert".', group = 'Alert')
"AlertName" : This is a string parameter where you can enter the name you choose for your alert.
AlertName = input.string('Order Blocks Finder ', 'Alert Name', group = 'Alert')
"AlertType" : The inputs for this parameter are "Bullish" or "Bearish". If the condition selected in the "Condition" parameter is of a bullish bias, you should set this parameter to "Bullish", and if the condition is of a bearish bias, it should be set to "Bearish". "AlertType" is a string parameter.
"DetectionType" : This parameter's predefined inputs include "Order Block Signal", "Signal", "Setup", and "Analysis". You may provide other inputs, but some functionalities, like "Key Price", might be lost. "DetectionType" is a string parameter.
"SetupData" :
If "DetectionType" is set to "Setup", you must specify "SetupData" as either "Basic" or "Full". In "Basic" mode, only the "Entry" price needs to be defined in the function, and "TP" (Take Profit) and "SL" (Stop Loss) can be any number or NA. In "Full" mode, you need to define "Entry", "SL", and "TP". "Setup" is a string parameter.
"Frequency" : This string parameter defines the announcement frequency. Choices include: "All" (activates the alert every time the function is called), "Once Per Bar" (activates the alert only on the first call within the bar), and "Once Per Bar Close" (the alert is activated only by a call at the last script execution of the real-time bar upon closing). The default setting is "Once per Bar".
Frequency = input.string('Once Per Bar', 'Message Frequency', , 'The triggering frequency. Possible values are: All (all function calls trigger the alert), Once Per Bar (the first function call during the bar triggers the alert), Per Bar Close (the function call triggers the alert only when it occurs during the last script iteration of the real-time bar, when it closes). The default is alert.freq_once_per_bar.', group = 'Alert')
"UTC" : With this parameter, you can set the Time Zone for the date and time of the alert's dispatch. "UTC" is a string parameter and can be set as "UTC-4", "UTC+1", "UTC+9", or any other Time Zone.
UTC = input.string('UTC', 'Show Alert time by Time Zone', group = 'Alert')
"MoreInfo" : This parameter can take one of two inputs, "On" or "Off", which are strings. Additional information, including "Time" and "Key Price", is included. If set to "On", this information is received; if "Off", it is not displayed in the sent message.
MoreInfo = input.string('On', 'Display More Info', , group = 'Alert')
"Message" : This parameter captures the user's personal message through an input and displays it at the end of the sent message. It is a string input.
MessageBull = input.text_area('Long Position', 'Long Signal Message', group = 'Alert') MessageBear = input.text_area('Short Position', 'Short Signal Message', group = 'Alert')
"o" (Open Price): A floating-point number representing the opening price of the candle. This input is necessary when the "DetectionType" is set to "Signal". Otherwise, it can be any number or "na".
"h" (High Price): A float variable for the highest price of the candle. Required when "DetectionType" is "Signal"; in other cases, any number or "na" is acceptable.
"l" (Low Price): A float representing the lowest price of the candle. This field must be filled if "DetectionType" is "Signal". If not, it can be any number or "na".
"c" (Close Price): A floating-point variable indicating the closing price of the candle. Needed for "Signal" type detections; otherwise, it can take any value or "na".
"Entry" : A float variable indicating the entry price into a trading setup. This is relevant when "DetectionType" is in "Setup" mode. In other scenarios, it can be any number or "na". It denotes the price at which the trade setup is entered.
"TP" (Take Profit): A float that is necessary when "DetectionType" is "Setup" and "SetupData" is "Full". Otherwise, it can be any number or "na". It signifies the price target for taking profits in a trading setup.
"SL" (Stop Loss): A float required when "DetectionType" is "Setup" and "SetupData" is "Full". It can be any number or "na" in other cases. This value represents the price at which a stop loss is set to limit losses.
"Distal" : A float important for "Order Block Signal" detection. It can be any number or "na" if not in use. This variable indicates the price reaching the distal line of an order block.
"Proximal" : A float needed for "Order Block Signal" detection mode. It can take any value or "na" otherwise. It marks the price reaching the proximal line of an order block.

Alert on Candle CloseAlert on Candle Close is a simple indicator allowing you to set alerts when a candlestick closes.
Instructions for use
From the chart window, click on "Indicators" and search for "Alert on Candle Close".
Click on "Alert on Candle Close" to add the indicator to your chart. Click on the star icon to add it to your favourites to easily access later.
Set your chart timeframe to the timeframe you wish to alert on. For example, to create an alert when a 4h candlestick closes, set your chart to the "4h" timeframe.
Hover over the "Alert on Candle Close" indicator which has been added to your chart and click the ellipsis "..." icon, then click "Add alert on Alert on Candle Close" or use the keyboard shortcut "Alt+A" from the chart.
In the alert pop-up window, make sure "Condition" is set to "Alert on Candle Close" and "Trigger" is set to "Once Per Bar".
Optionally, you can set a custom expiry for the alert, give the alert a name and customise the alert message. You can configure notification settings from the "Notifications" tab.
Click "Create" and your alert is set up!
Each alert is tied to the timeframe and chart it was created on, so you can change the timeframe or asset and create more alerts by repeating the above process.
Note : this indicator is only designed to work with time-based chart types, such as Bars, Candles or Heikin Ashi. It will not work for non-time charts such as Renko.
FAQs
Why do my alerts sometimes not fire as soon as the candle closes?
This is a limitation with Pine Script's execution model. Indicators are calculated whenever a price or volume change occurs i.e. when a new trade happens. For illiquid or slow moving markets, there may be some time between when a candle closes and the next trade, leading to a delay in the alert triggering. The alert will trigger on the next tick of data on the chart.
Why can't I create more alerts?
TradingView has a limit on the number of active technical alerts you can have based on your membership tier. To configure more alerts, consider upgrading your TradingView plan to a higher tier. See a comparison of TradingView plans at www.tradingview.com
My alert only fired once, how can I get it to keep working?
When configuring the alert in the alert pop-up window, make sure you set "Trigger" to "Once Per Bar" and "Expiration" to "Open-ended alert".

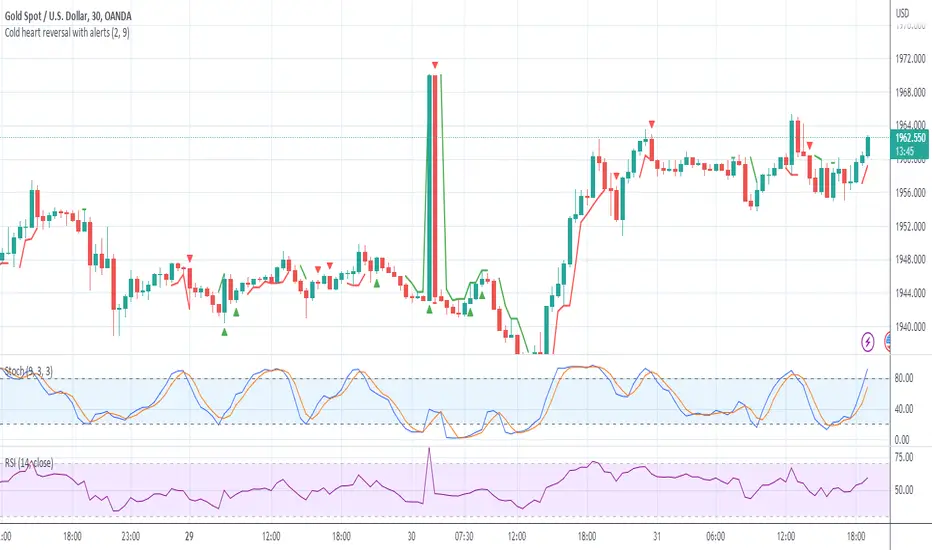
Cold heart reversal with alertsThis will help you find reversal point pinpoint to its candle actually crossed the lowest or highest in the overbought and oversold zone (stochastic 9,3,3)
Various input parameters are defined . These inputs allow the user to customize the lookback period which is the number of candle before the low or high, Stochastic length.
User can also define their own high and low values that will plot on the chart.
It will be super convenient for traders who want confirmed price closed that is actually its significant point.
I used barstate confirmed in this code so you don't have to worry about repaint
Long & Short / Bullish & Bearish & Neutral / Sentiment LONG and SHORT signal generation:
The LONG and SHORT signals in this script are generated based on a combination of sentiment, price strength, and volume strength calculations. The following parameters and calculations are used in determining these signals:
Sentiment:
The sentiment is calculated using a Simple Moving Average ( SMA ) of the SMO (oscillator) over a specified sentiment_length.
Price Strength:
The price strength is calculated as the percentage change in the closing price compared to the previous closing price.
Volume Strength:
The volume strength is calculated as the percentage change in the trading volume compared to the previous trading volume .
Custom Oscillator:
This oscillator is calculated as the difference between price strength and volume strength, followed by calculating its SMA over a specified strength_length.
The LONG signal is triggered when:
The sentiment_diff (difference between the oscillator and the SMA oscillator) is greater than 0, and the close price is greater than the fast EMA ( Exponential Moving Average ) of the close price, OR
The custom oscillator crosses over its SMA , and the close price is greater than the open price, and the close price of the previous period is greater than the close price of two periods ago.
The SHORT signal is triggered when:
The sentiment_diff is less than 0, and the close price is less than the fast EMA of the close price, OR
The custom oscillator crosses under its SMA , and the close price is less than the open price, and the close price of the previous period is less than the close price of two periods ago.
Color change description:
The color change in this script is based on the relationship between the close price and the highest/lowest SMAs of the high/low price over a specified lengthInputRoR. The following colors are used:
Green:
Bullish area (close price is greater than the highest SMA of the high price)
Red:
Bearish area (close price is less than the lowest SMA of the low price)
Yellow:
Neutral area (close price is between the highest and lowest SMAs of the high and low prices)
Color meaning description:
Yellow (Neutral Area):
This color indicates that the close price is between the highest and lowest SMAs of the high and low prices, signaling more caution and uncertainty in the market.
Green ( Bullish Area):
This color represents a bullish market condition where the close price is greater than the highest SMA of the high price, suggesting a higher probability of a successful LONG position.
Red ( Bearish Area):
This color signifies a bearish market condition where the close price is less than the lowest SMA of the low price, indicating a higher probability of a successful SHORT position.
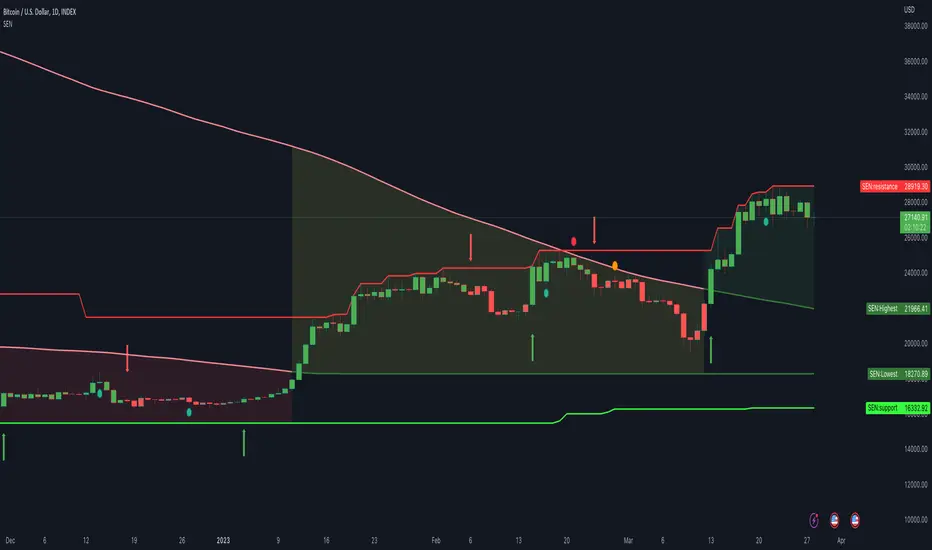
Support and Resistance lines explanation:
Support and resistance lines are calculated based on the highest and lowest prices over a specified number of periods. These lines are used to identify significant price levels where the market may experience increased buying or selling pressure.
Resistance:
The resistance line is calculated using the highest high price over a specified number of periods. This line represents a price level where selling pressure is expected to increase, making it more difficult for the price to rise further. Traders often consider resistance levels as potential entry points for SHORT positions or exit points for LONG positions.
Support:
The support line is calculated using the lowest low price over a specified number of periods. This line represents a price level where buying pressure is expected to increase, making it more difficult for the price to fall further. Traders often consider support levels as potential entry points for LONG positions or exit points for SHORT positions.
The resistance and support lines are plotted using different colors to help traders visualize the important price levels where the market may experience a reversal or consolidation.
Final Words:
This script provides LONG and SHORT signals and alerts based on a combination of sentiment, price strength, and volume strength calculations. It is designed to serve as a high-quality aid for executing well-informed trading ideas. However, it's important to note that the LONG and SHORT signals and alerts generated by this script should not be considered as trading advice. Traders should always conduct their own research and analysis before making any trading decisions. The script aims to assist in visualizing important market trends and price levels, helping traders make more informed decisions based on their personal trading strategies.
Trade Ideas to Discord WebhookTakes basic user inputs for entries, exits, stop loss and leverage.
Converts all inputs (removing unused ones) to an alert message.
Intended for use as a single alert / message.
Alert will fire as soon as activated - after that you should delete the alert to prevent multiple alerts being fired on subsequent candles.
Divergence Indicator Screener [Trading Solutions]It's been a while since the last publication on the platform. We've been studying the charts and developing some interesting strategies and indicators, so we'll be posting some ideas in the near future.
Overview
This indicator allows you to find divergences between the price action and the classic RSI. It has the ability to anticipate trend changes.
Highs and Lows are determined using Pivot Points, wich can be adjusted in settings.
You can use this indicator to find two kind of divergences, Regular and Hidden:
Regular is when price makes a higher high, but the RSI makes a lower high
Hidden is when price makes a lower high, but the RSI makes a higher high
The opposite case for Bearish Divergence
The most important functionality of this indicator is that we can be alerted when a divergence occurs in different trading pairs, without the necessity of checking different charts at the same time, and seize opportunities offered by the market. You only have to go to Alerts Tab , click on Create Alert , select Divergence Indicator Screener and wait for the Notification in your favorite device.
You can choose any ticker to be plotted on chart and even add a new one.
Settings
To get everything started with this indicator, here are the different inputs:
RSI Settings: Period y Source
Pivot Point: Left and Right lookback bars
Filter Divergences: Regular and Hidden and max and min distance from the pivot points to consider a valid divergence
Draw table and Filter how much bars to look for a divergence in the past and plot it in the table: The fewer bars, less divergences shown
We hope you can take the most of this tool, and helps improve your day to day trading. Feel free to comment and make suggestions. We will be updating soon

(2) Two AlertsCurrent Trading View free plan allows only ONE active alert.
This simple indicator Allows to trigger this ONE and ONLY alert when price reaches Higher, or Lower price level.
You can set levels and turn alerts for them on/off in settings, or by just drag-n-dropping Horizontal lines on the chart.
To set the only alert you need to create new alert, and change it's following parameters :
condition : 2alerts
Any alert function() call
Feel free to modify it on your needs.
myAutoviewAlertsLibrary "myAutoviewAlerts"
My Alerts Functions - To use with autoview
@returns - These functions returns a string to use in alerts to send commands to autoview. You can open an order, place a stop or take order, close an opened order or a opened position, or open a hedge position.
@param a = String - Account Identification
@param e = String - Exchange
@param s = String - Symbol
@param b = String - Book Side
@param q = Float - Quantity
@param fp = Float - Fixed Price
@param delay = Integer - In Seconds
@param i = Integer - Account Index (to multiple accounts allerts)
@param base = String - Base Currency (bitmex) - "Tether" or "Bitcoin"
@param fsl = Float - Stop Loss Limit Price
@param c = String - Close -> "order" or "position"
@param ro = Bool - Reduce Only
@param sl = Bool - Stop Loss -> bitfinex
@param t = String - Type -> "market" or "limit"
@function f_order => Open Orders
@function f_stop => Set Stop Loss Order
@function f_take => Set Take Order
@function f_closeOrder => Close Open Orders
@function f_closePosition => Close Open Positions
@function f_hedge => To Open a Hedge Position (short 100% of balance)

Movable Stop + Trail + Alerthello everybody !
.....
this indicator helps you to get a better trading setting.
it's similar to the default draw tool from the trading view but the difference is you can add Trail stop and Alert .
.....
It also helps to free accounts to set more than 1 Alarm !!!
.....
Alert setting
just remember after you see set an alert if you change stop or entry, the alert will work with previous values/settings.
so you need to recreate an alert.
also don't change alert setting
.....
indicator setting
How is it works ?
...
settings
...
everything on :
you can see the information on the table
...
short sample :
everything on
...
simple short trade setting:
.....
my goal is to upgrade this indicator with your ideas.
not financial advice !
please , share your ideas with me to improve the indicator
I would like to see what you think about this indicator <3
also if you have any ideas to create an indicator or strategy you can make contact with me .
have a great day.

bytimeLibrary "bytime"
TODO: to do something at the specified time.
////Return =>> ht = hour , mt = minute , st = second ,Dt = Day, Mt = month, Yt = year , dateTime = full time format./////////////
Note : Remember to always add import when you call our library and change Gtime() to Timeset.Gtime() is used to access internal data.
import hapharmonic/bytime/1 as Timeset
=Timeset.Gtime()
/////////////Set a time to trigger an alert./////////////
ck = false
///hour : minute : second
if ht == TH and mt == TM and st == TS
//some action
//...
//.
ck := true
Gtime()
Consecutive Up/Down Strat + alerts via TradingConnector to ForexSoftware part of algotrading is simpler than you think. TradingView is a great place to do this actually. To present it, I'm publishing each of the default strategies you can find in Pinescript editor's "built-in" list with slight modification - I'm only adding 2 lines of code, which will trigger alerts, ready to be forwarded to your broker via TradingConnector and instantly executed there. Alerts added in this script: 12 and 15.
How it works:
1. TradingView alert fires.
2. TradingConnector catches it and forwards to MetaTrader4/5 you got from your broker.
3. Trade gets executed inside MetaTrader within 1 second of fired alert.
When configuring alert, make sure to select "alert() function calls only" in CreateAlert popup. One alert per ticker is required.
Adding stop-loss, take-profit, trailing-stop, break-even or executing pending orders is also possible. These topics have been covered in other example posts.
This routing works for Forex, indices, stocks, crypto - anything your broker offers via their MetaTrader4 or 5.
Disclaimer: This concept is presented for educational purposes only. Profitable results of trading this strategy are not guaranteed even if the backtest suggests so. By no means this post can be considered a trading advice. You trade at your own risk.
If you are thinking to execute this particular strategy, make sure to find the instrument, settings and timeframe which you like most. You can do this by your own research only.

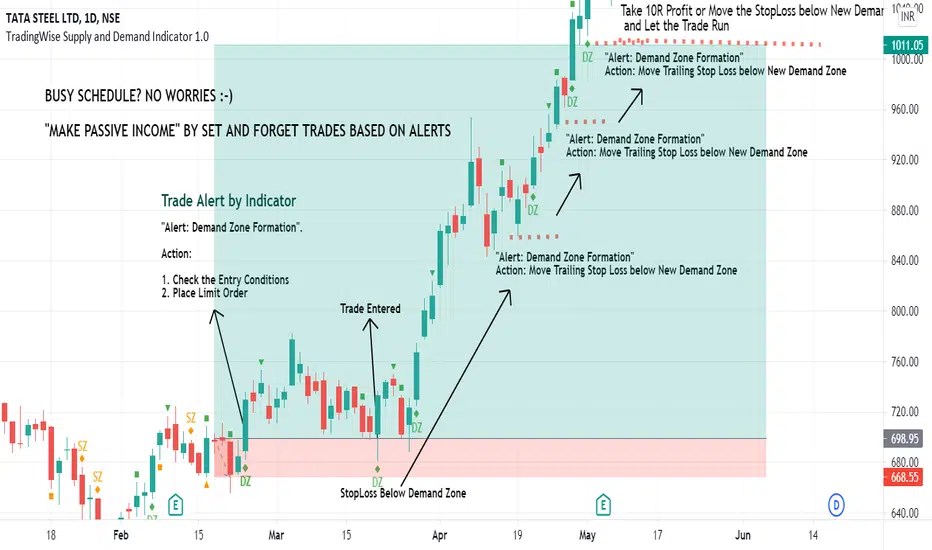
TradingWise Supply and Demand Indicator 1.0TradingWise Supply and Demand Indicator 1.0 is based on the Price Action candlestick patterns to identify the Supply and Demand zones in the charts (Areas of liquidity). It works on all Timeframes and Asset Classes. This Script helps the traders to identify the demand and supply zones with identifications on the candle stick patterns indicating the origin of the Strong move. Also it generates Alerts automatically once the supply or demand area is formed thus by reducing the hours spent on the charts and reducing the missed trade Opportunities as well. This Indicator is extremely helpful for those on Full time Jobs/ Busy Schedule.
Buy/Sell Alerts by Indicator:
Green Diamond + DZ Sign ---> Indicates the Demand Zone Formation. Place Buy Trade upon Entry Criteria Met
Orange Diamond + SZ Sign ---> Indicates the Supply Zone Formation. Place Sell Trade upon Entry Criteria Met
Vedant's 15min intraday breakout strategy Higher Close alert --
This script allows you to set a alert if the next close is higher than the candle close from before. It will notify you if the next candle is higher than the last candle! It is very easy to use, Steps :-
1. Add the script to your chart.
2. Select the name of the script in the "Alerts" option.
3. Done!
Now when a stock gives a higher close than before, you will be notified with a message: "Higher Close Detected in (stock)".
Lower Close alert --
If the next candle gives a lower close than the candle before, it will send a alert with a message: "Lower Close Detected in (stock)".
If you don't have the paid account, you can only close option from the two: Higher or Lower.
if paid, then you can set as many alerts as you want!

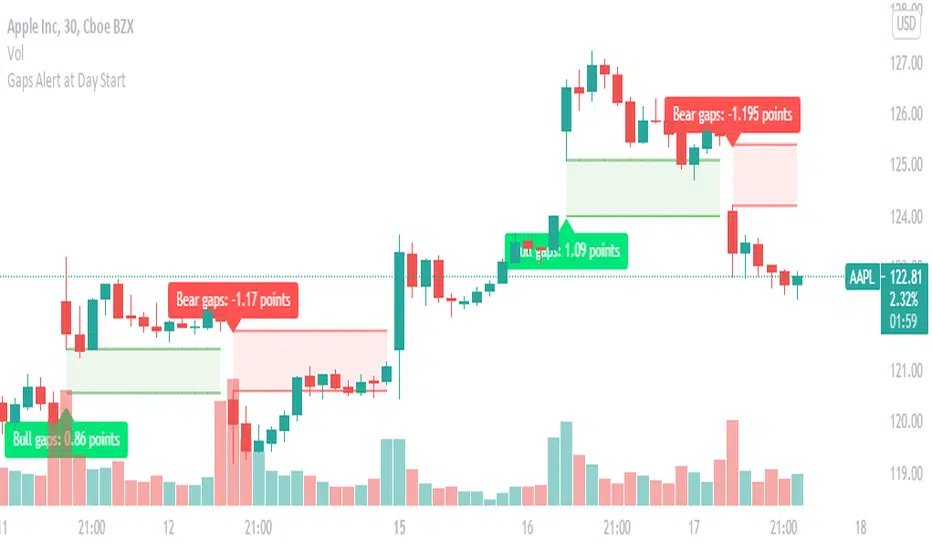
Gaps : set Alert to get Alert at Day StartGaps are areas on a chart where the price of a stock (or another financial instrument) moves sharply up or down,
with little or no trading in between. As a result, the asset's chart shows a gap in the normal price pattern.
The trader can interpret and exploit these gaps for profit.
What do i look for in these gaps, Will these gaps will fill or not fill?
When someone says a gap has been filled, that means the price has moved back to the original pre-gap level.
how you can benefit with this indicator?
this indicator instantly picks up the gap at the start of the day and also helps in identifying weather it is a bullish gap or a bearish gap
in this you can easily set up alerts, you will be instantly alerted if any gap occurs.
What does the visual on chart indicates ?
Green color gaps are bullish gaps or gap up ,label indicates the type of gap and the width of the gap
Red color gaps are bearish gaps or gap down ,label indicates the type of gap and the width of the gap
once you set alert you will Receive alert in the below format
Price (current price) 'Bear gap width: ' (gap Width in points)
Price (current price) 'Bull gap width: ' (gap Width in points)
This will work on all time frame equal to or less than "D".
Position CalculatorThis script calculates how much cryptos or dollars you have to bet with 4 variables : Risk Loss , Leverage, Entry and Stop Loss.
When you want to open a position, just complete the parameters and the script will tell you how much you have to bet in dollars or cryptos units, depending the way you're trading.
Note : don't foreget that you have to pay fees on exchanges whose are not included here, specially with high leverage trades.

Cyatophilum Levels [ALERTSETUP]Cyatophilum Levels - Version 1.0 - Alert setup
This indicator allows you to build your own strategy based on Fibonacci levels, and create automated alerts for long & short entries and exits.
This study also has a backtest version. See my previous script.
The Fibonacci levels are printed automatically in real time and without repainting on the chart.
You configure your own strategy in the indicator parameters. You can choose to go long or to go short, or both, on which Fib levels to enter Long/Short, and on which Fib levels to exit (up to 2 entry levels and exit levels).
Detailed Guide:
This is a guide that can be useful if you do not understand the strategy or an indicator parameter. Instructions on how to get access are at the bottom.
To configure your strategy, you need to open the indicator settings. You can either right-click on the indicator and click "settings", or click the settings button near the indicator's name.
You should know that the Fibonnaci levels are calculated from the support and resistance levels, which are calculated using the last swing high and swing low. This behavior can be tweaked in the settings with the first 2 parameters:
· Noise reduction
Dropdown menu. Options are "NONE", "SMALL", "MEDIUM", "HUGE". Used to get a smoother level behavior. The higher it is, the less often the support and resistance levels will move. Can be useful to cut off fakeouts.
· Swings lookback
This is the number of historical bars used to calculate the last swing high and swing low.
In TradingView, we usually wait bar close to validate a signal (trade entry or exit), in order to avoid repainting. But since this indicator is purely based on price action, there is an option called Alert Type if you want to receive intra-bar alerts or not.
· Entry Alert Type
2 options : "Once Per Bar Close", "Once Per Bar". These correspond to the alerts options. You must use the same alert type in the indicator settings and in the alert options. When using "Once Per Bar", the candle high and low are used for the cross conditions, otherwise, candle close is used.
· Exit Alert Type
Same but for exit alerts.
The long trades setup can be configured independantly from the short trade setup, but the parameters are the same.
■ Go Long/Short
Check this box to enable/disable long/short trades.
· Long/Short Entry Condition
Dropdown menu from which you can pick the condition for your entry. Options available are "Cross Over","Cross Under" and "Just Cross".
· Long/Short Entry 1
Dropdown menu from which you can pick the level for your entry n°1. Options available are "Support","FIB 23", "FIB 38", "FIB 50","FIB 61","FIB 78" and "Resistance".
· Long/Short Entry 2
Additional FIB level entry.
· Long/Short Exit 1
Dropdown menu from which you can pick the level for your exit. Options available are "Support","FIB 23", "FIB 38", "FIB 50","FIB 61","FIB 78" and "Resistance".
· Long/Short Exit 2
Additional FIB level exit.
■ Trend Filter
Optionnal Tilson T3 TrendLine to make the strategy go long only when price is above T3 (green) and short only when price is below (red). The length in bars is configurable.
· Configuration Panel
It should appear on the left of the chart. This panel displays the whole indicator settings in a compact and easy-to-read way. You can replicate a strategy from just this info panel. Can be turned off if needed.
· Graphic options
A red/green background corresponding to the strategy position (short/long) can be turned off.
The Fib levels labels can be turned off all at once.
Risk management:
Place your secondary exit one or two levels above/below your entry to act as a stop loss.
Availabe alerts:
To create an alert, right-click on the indicator and click "Add alert".
The LONG alerts corresponds to the green labels on chart, while the SHORT are in red.
Select one of the following signals in order to create your strategy:
· LONG/SHORT ENTRY : Alert to enter a long/short. Make sure to select "Once Per Bar" or "Once Per Bar Close" according to the "Entry Alert Type" parameter.
· LONG/SHORT EXIT : Alert to exit a long/short. Make sure to select "Once Per Bar" or "Once Per Bar Close" according to the "Exit Alert Type" parameter.
Default settings are set for 15m.
Use the link below to obtain access to this indicator

Fancy strategy alerts example [QuantNomad]Alerts on strategies were introduced just recently in TradingView.
These alerts have an alert_message placeholder which allows you to compose in PineScript very complex alerts and insert quite a lot of information in them.
This is just very simple example of how they can look like.
