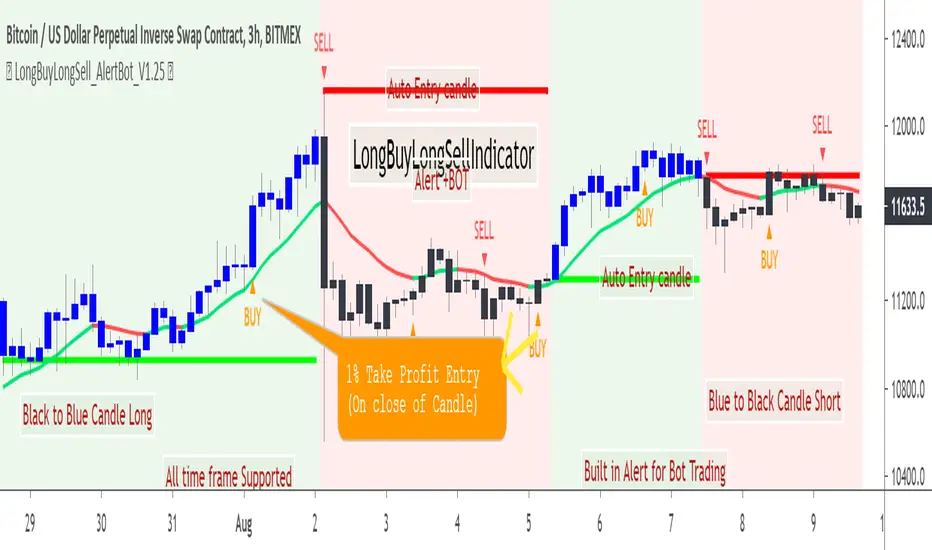
LongBuyLongSellIndicatorHello Friends,
Here is one more very simple to use LongBuyLongSellIndicator for trading. Details are given above in the chart.Happy trading.
This indicator can be used for very long term trading in any time frame. This is designed to avoid many noise in between the trade.
This indicator does not require any additional indicator setup ;as like traders do in price action trading ,just need to follow the colors for trading .
Always remember Black to Blue transition BUY (or cover the short position)
Blue to Black transition SELL(or cover the buy position)
Do not trade in the middle and ignore other colors if appear in the chart
Other Indicator that may be useful:
BUY2SELL2BUYindicator
SELL2BUY2SELLindicator
ProfitCandleBillionWayIndicator
Access is through invite only
Automated
Omni Trader Accompanying Backtesting StrategyVersion 1.0
Purpose
This backtesting strategy indicator is a accompanying tool for use with my popular trading and alert indicator: Omni Trader | RMI EMA RSI VOL | Margin Focused Indicator
Reference Indicator Link:
Features
This strategy has been programmed to act exactly how the accompanying indicator would be used with an automated strategy such as Autoview or through manual trading
Has identical coloured signals with correct icons for reference with the indicators standard alert conditions (LONG/SHORT)
The ability to toggle on or off all the logic and UI presets you could previously use to enhance the standard indicator
Fully customisable in the settings regarding trading strategy to match exactly how you have the reference indicator set up with alerts or how you are trading manually with it.
Ability to choose a timeframe, want to ignore the crypto boom at the latter stages of 2017? Sure you can, change the time frames in the settings to see a more recent representation of your trades.
Stop Loss & Take Profit enabled in this back tester for fine tuning of your strategy, especially useful for automated users to refine the most profitable settings for your style.
Access
This indicator is free for existing owners of my Omni Trader | RMI EMA RSI VOL | Margin Focused Indicator linked above as an accompanying tool to improve their strategy and net more profit. If you would like access to any of my indicators or would like to know more please find me on my community discord channel where you can find indicator details/documentation and general help:
Discord Link: discord.gg
Thank you for the immense support everyone, happy trading!
- Falco

Multi-RSI BB Fast Trader Autoview & Alerts Indicator
Overview
This is a fully featured StochRSI, RSI & Bollinger Band customisable indicator with custom conditions and alerts that can be taken
advantage of using automated solutions such as Autoview , or using it alongside/testing BUY/SELL conditions against your favourite markets
to maximise gains in ProfitTrailer 2.0 and finally you can use this a standalone manual general purpose signals indicator to scalp or accumulate your chosen market.
Features:
3 different core strategies with fully customisable buy / sell conditions to suit your needs: StochRSI + RSI + BB, StochRSI + BB, BB
Toggleable conditional logic to further tweak your buy / sell conditions: Conservative Conditions, Aggressive Conditions
New intuitive chart layout to make the tweaking process visually easy and appealing. With this layout its incredibly easy to see why conditions might not be met and helps guide you on what settings need to be tweaked.
2 custom alerts that be used to either signal a manual trade or for use with automated solutions such as Autoview.
Planned Updates:
Version 1.1: Toggleable
Version 1.2: Toggleabe
Version 1.3: Toggleable
More currently being planned!
Trial Access:
48 hour no obligation trial access just leave a message on the script and PM me.
Permanent Access:
Flat Fee: 0.10 ETH (0.05 for any previous purchaser of my work)
As with all my TradingView indicators, there are no monthly fees or subscriptions. I don't make these for the money but I do add a fee to avoid over-saturation so I can give
those that see value in it and want to use it the best experience:
Lifetime full access to the indicator and any subsequent updates/improvements for it.
Full support over TV or Discord to help you create a suitable strategy for your needs.
50% discount off any future/previous work I have created on TradingView.
BB% RSI Autoview & Alert Signal Advanced Indicator 2.0
Version 2.0 Upload
Detail
This is a premium indicator that is intended for automated trading (eg. Autoview) on the 4 hour time scale. This script uses normalised Bollinger Band and RSI values to find greatly oversold/overbought territory. When a entry or exit has been identified, further conditions are checked to attempt to prevent entry into traps based on volume and price history . There are three alerts set up that can be used to either trigger an automated entry/exit of a trade or be used as a simple signal to manually make the trade if you don't have time to look at charts throughout the day.
Available Settings
RSI Length
RSI Oversold/Overbought thresholds
BB Length
BB Multiplication
Future developments
I am constantly tinkering with the indicator to make it better and even more reliable. Here are some features in the works:
A strategy version will be created for use in back-testing
Even more customisation regarding modifying BB% upper and lower thresholds
More conditions will be checked to improve the dip detector to maximise profits on the uptrend when OS conditions are more infrequent
Availability
Please PM me for a 24H free trial full access to the indicator to analyse its setting and visually backtest it against your desired markets.
Afterwards this indicator is available for a flat fee of 0.10 ETH for lifetime access, all future updates and full support from me at any time to help fine tune it.
YODA TRADE ULTIMATE - BETA----- YODA TRADE ULTIMATE -----
Strategy was designed for automatic USDT pairs trading. Default setting are pre-tuned to BTCUSDT pair.
--- MAIN FEATURES ---
efortless BUY/SELL signal generator (not suitable for margin trading... yet)
automatic trending detection and candle painting accordingly
sophisticated STOP LOSS able avoid flash crashes
every option is tweakable - feel free to play with them
repainting proof (when 'open' price source is selected)
--- ADDITIONAL INFO ---
Script operates best on 1H candles (not heikin-ashi).
Alerts should be set 'once per bar' as early reaction to flash crashes and flash pumps is important.
As this is BETA - all can changed until final release. If you have any comments or requests please PM us.
--- DISCLAIMER ---
We do not offer any financial or investment advice. Investing, trading (especialy cryptocurrencies) is risky. You can loose all your money. Use on your own responsibility.
DO YOUR OWN RESEARCH!

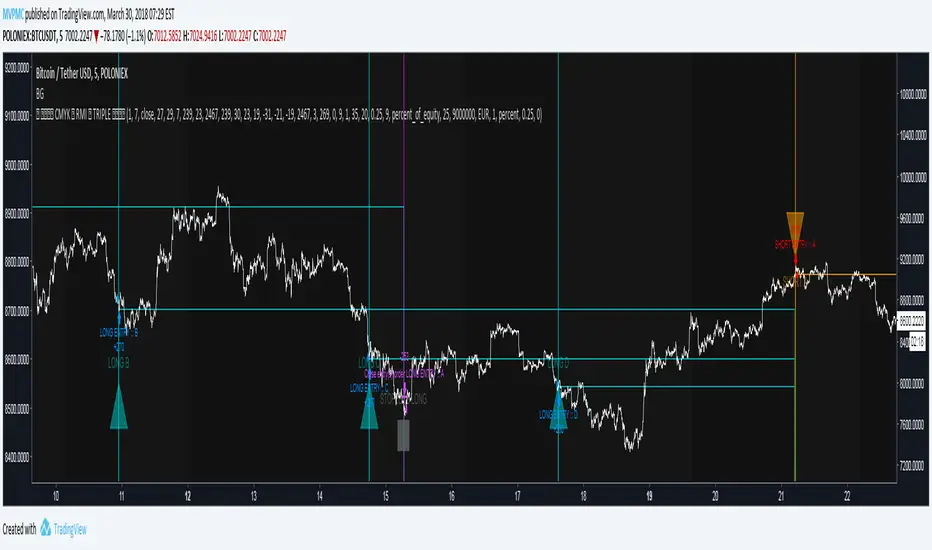
CMYK RMI TRIPLE Automated strategy▼ This is the strategy version of the script.
◊ Introduction
This script makes use of three RMI 's, that indicate Overbought/Oversold on different timescales that correspond with Frequency’s that move the market.
◊ Origin
The Relative Momentum Index was developed by Roger Altman and was introduced in his article in the February, 1993 issue of Technical Analysis of Stocks & Commodities magazine.
While RSI counts up and down ticks from close to close, the Relative Momentum Index counts up and down ticks from the close relative to a close x number of days ago.
This results in an RSI that is smoother, and has another setting for fine tuning results.
This bot originated out of Project XIAM , an investigative script that outlined my approach towards Automated Trading Strategies.
Are you interested in writing bots yourself ? check out the beta version of this script.
It has many bugs, but also most of the Skeleton.
◊ Usage
This script is intended for Automated Trading with AUTOVIEW or TVAUTOTRADER , on the 1 minute chart.
◊ Features Summary
Overlay Mode
Indicator Mode
Three RMI's
Trend adjustment
Pyramiding
Ignore first entries
Take Profit
Stop Loss
Interval between Entries
Multiring Fix
Alert signal Seperation
◊ Community
Wanna try this script out ? need help resolving a problem ?
CMYK :: discord.gg
AUTOVIEW :: discordapp.com
TRADINGVIEW UNOFFICIAL :: discord.gg
◊ Setting up Autoview Alerts
Use the study version of this script, To set up The Alerts Autoview Picks up on.
The Signals to work with are :
Open 1 Long
Use this to open one Long Position.
With quantity being : /
Once per bar
Being larger than 0
Comment example : e=exchange b=long q=amount t=market
Open 1 Short
Use this to open one Short Position.
With quantity being : /
Once per bar
Being larger than 0
Comment example : e=exchange b=short q=amount t=market
Close1 Position
Use this to Close The amount of one Open Position.
With quantity* being : /
Once per bar
Being larger than 0
Comment example : e=exchange c=position q=amount t=market
*Beware when using a percental % quantity, instead of an absolute quantity.
Percental Quantities are based on the , Not
And will change in absolute value relative to the amount of open trades.
Close All positions
Use this to Close All Open Positions.
With quantity being :
Once per bar
Being larger than 0
Comment example : e=exchange c=position t=market
For the specific Syntax used in the comment of the alert, visit Autoview .
◊ Setting up TVAutotrader
Use the strategy version of this script, And load it into TVAT .
◊ Backtesting
Use the strategy version of this script for backtesting.
◊ Contact
Wanna try this script out ? need help resolving a problem ?
CMYK :: discord.gg
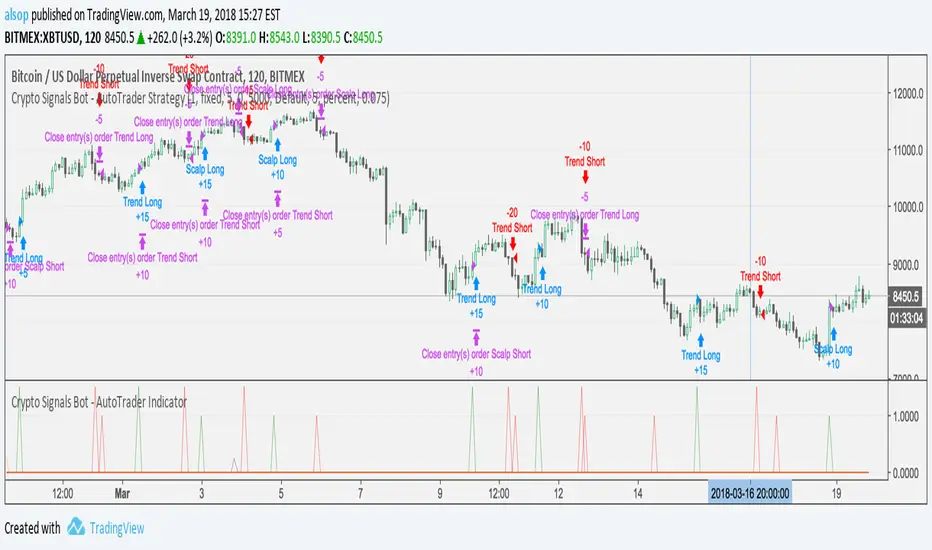
Crypto Signals Bot - AutoTrader IndicatorVery excited to release our new fully automated trading bot specifically for Bitcoin.
We use this system with AutoView to trade on Bitmex and it is specifically designed for Bitcoin on the 2 Hour charts.
It includes everything you will need:
AutoTrader Strategy
AutoTrader Indicator
All Alerts Syntax for AutoView
This has been producing amazing results and is a fully automated trading system that will take buys (long) and sells (short) on Bitcoin with supported crypto exchanges.
To signup, go to this URL: www.cryptosignalsbot.com
Crypto Signals Bot - AutoTrader Strategy - BitcoinVery excited to release our new fully automated trading bot specifically for Bitcoin.
We use this system with AutoView to trade on Bitmex and it is specifically designed for Bitcoin on the 2 Hour charts.
It includes everything you will need:
AutoTrader Strategy
AutoTrader Indicator
All Alerts Syntax for AutoView
This has been producing amazing results and is a fully automated trading system that will take buys (long) and sells (short) on Bitcoin with supported crypto exchanges.
To signup, go to this URL: www.cryptosignalsbot.com

CMYK XIAM◊ Introduction
This is project XIAM, a trading bot based on SMA and RMI
◊ Origin
Based on 'The Relative Momentum Index' by Roger Altman : February, 1993 issue of Technical Analysis of Stocks & Commodities magazine.
While RSI counts up and down days from close to close, the Relative Momentum Index counts up and down days from the close relative to a close x number of days ago.
This results in an RSI that is smoother. The input has been changed to the change of a smoothed close multiplied by a smoothed volume .
In addition SMA is used to detect an up/downwards phase.
◊ Adjustments
CMYK color theme applied.
◊ Usage
Automatic trading strategy
◊ Future Prospects
Remove jitter.
Take Variance into account
Auto adjusting settings evaluated on previous placements.
Proper asset management.
BB/StochRSI Strategy Backtest For Crypto BotThumbs Up for access
Buy is triggered when the price reaches chosen percent of lower Bollinger Band, Stoch RSI is oversold and there's a K/D signal crossover. The exit is when StochRSI is Overbought or K/D Crossover (toggle) AND/OR (toggle) price is greater than or equal to Top or Mid Bollinger Band (toggle).
Use 15m charts. It works excellent for consolidating/sideways markets and good for bullish impulsive moves but takes losses during impulsive downside market moves.
Results will be better in real-time. The script calculates the price based on the close, but a bot would calculate in real-time. Entries would be better. I recommend manually testing the strategy by using the "Date and Price Range" tool in TradingView.
I'll share the source code to those who wish to collaborate for improving profitability.

Grahn Gyllene Kors [Alerts]Grahn Gyllene Kors is the companion study for the Grahn Gyllene Kors strategy...
This is an EMA / Trend Explorer & Strategy useful for identifying trends before EMA's cross and also identifying and experimenting with various EMA lengths and candle trends. There is also a companion Alerts study for this in which trend signals may be sent to the user via sms or email AND/OR buy and sell alerts may be sent to bots for automated trading of this strategy. Once you have optimized your settings and backtested with this strategy, apply your same settings into the Alerts study and create your alerts.
NOTICE: This script does not require access from me, simply open Indicators on chart and search for "Grahn". By accessing this script you acknowledge that you have read and understood that this is for research purposes only and I am not responsible for any financial losses you may incur by using this script!
EMA Fast and EMA Slow - may be adjusted in length and color.
Bullish F>S % - controls what percentage the EMA Fast should be above EMA Slow before considered bullish and is represented by the Green band on the chart.
Neutral % - is what percentage surrounding the EMA Slow should be considered neutral and is represented by the Yellow band on the chart.
Bearish F

Trend-following Microprofit w/ Smart DCA BACKTESTING VERSIONCompanion to the alert script:
Tradingview doesn't like backtesting with too little capital or trade sizes less than 1 share, so the "Net Profit" number may not be accurate right off the bat. To get a better idea, change the order size or initial capital so the strategy is trading the appropriate % of initial capital. For example, if your personal capital is $2000 and you are making $100 trades, your trades are 5% of initial capital. That is roughly equivalent to the defaults using orders of 1 BTC with $100,000 capital.
Tightening the stop level will improve the Net Profit to Max Drawdown ratio, making the strategy more suitable for large trade sizes.
This script does not provide alerts for Gunbot. Find the settings you like using this strategy script, then plug those values into the alert script.
If you like this you can buy me chocolate below. Cheers!

Trend-following Microprofit w/ Smart DCA + Profit Plot + AlertsThis alert script is oriented towards automated trading with Gunbot.
I call it "Options Galore" because of all the user-configurable settings it offers for up-trending and down-trending markets. (See: " Market Tone " study).
A strategy script for quantitative backtesting, smarter buy/sell indicator such as TSI or Stoch RSI, and stop loss/trailing stop are all in the pipeline. Please share any other suggestions in the comments!
Features:
Set backtesting range, or start forward testing from the current time. Historical Renko charts can lead to repainting, which is avoided by keeping the chart open in your browser and running with real time data.
Average protection: only buy if price drops by a certain % below your average price -- can be automatically toggled by market trender if we want to continue buying during an uptrend. This reduces net profit but increases gross profit.
Gain protection: only sell if price is a certain % above your average price -- can be automatically toggled by market trender. Wait for larger profits in an uptrend, but sell earlier in a down trend.
Minimum percent gain can also be set to a negative value to allow selling at a loss. This is not true stop loss behavior, we still need a sell signal from the indicator. This means we will try to get the best price above your price floor, but in some rare situations we may not sell before the price drops below your price floor.
Position plotter: plots average long position price relative to current price.
Plot loss level: plots average price - loss %. With pyramiding turned off, this can be used to find out where to set your stop loss.
This script is free to use, just comment or PM for access. It is mainly meant to showcase some new features, and is only safe to use in carefully selected markets such as USDT-BTC.
Stay posted for upcoming scripts with smarter signaling and additional features! If you would like to add these features to your own preferred strategy, please PM me.

5 minute XAUUSD Strategy (Gold)Most definitely this is the best strategy I have ever coded. (Read Note Below)
Version 3 of PineScript code, 2 contract/lot trades at once, pyramiding = 2.
Commission of 100 pips included on each trade, accurate representation of actual spreads, commission_value = 0.02.
This is essentially 270% of profit in a single month - check the date on the first trade.
Trend following strategy as all the previous ones before, but this one is crazy.
Max drawdown is 34%, all that drawdown and more is profit made, but there cannot be any emotional involvement in this strategy.
Choppy markets produce losses, as is with all trend-following strategies.
(4 lines of code, nice and simple)
Downside - the last month in which this was backtested may not provide actual representation of past movement (market could have been exceptionally trending the last month), (but maybe it does ;v)
Unfortunately, we cannot know because "TRADINGVIEW WON'T OFFER BACKTESTING FOR FARTHER BACK!" fix this please.

Auto-Support v 0.2Same script as the previous version with a slight twist
Have added (lines) "Transparency" to the settings to avoid having to edit every line individually ...
Cheers
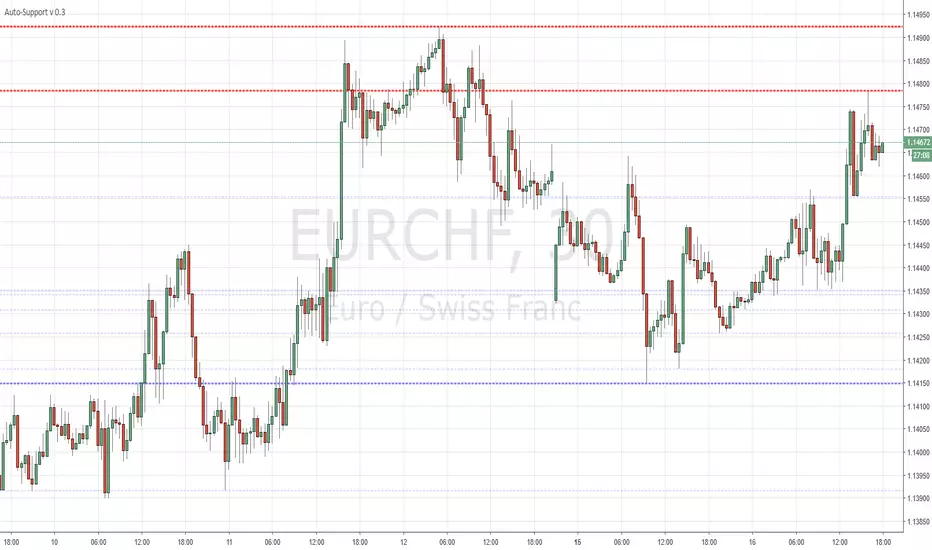
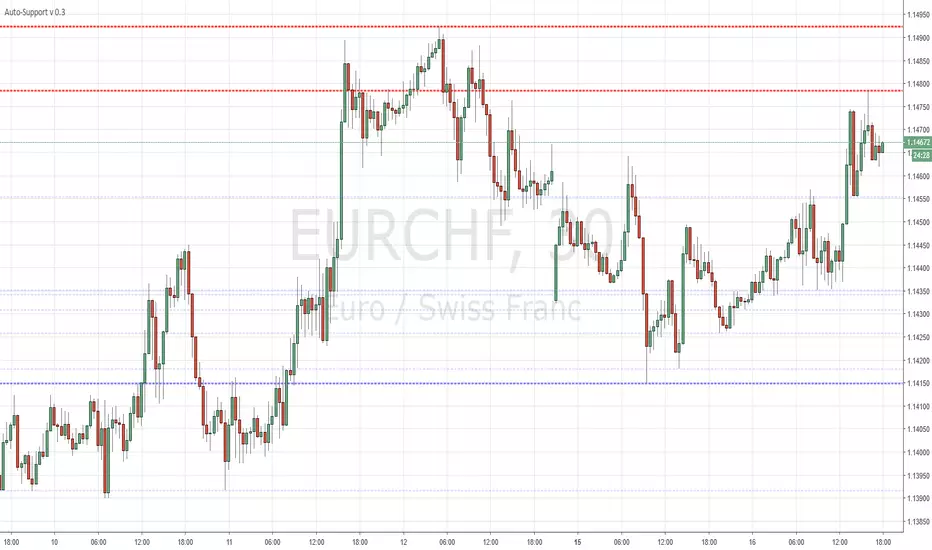
Auto-SupportFairly simple script that automatically draws highs and lows for the past X periods at various intervals.
3 Settings :
"Sensitivity" which amounts to the horizontal separation from one high to the next high (default multiplicator : 10)
Variable "b" which is the HEX color for resistances (default : red)
Variable "c" which is the HEX color for supports (default : blue)
More HEX color codes on www.hexcolortool.com (not my webpage :)
Feel free to edit the script to your taste.
MACDouble + RSI (rec. 15min-2hr intrv) Uses two sets of MACD plus an RSI to either long or short. All three indicators trigger buy/sell as one (ie it's not 'IF MACD1 OR MACD2 OR RSI > 1 = buy", its more like "IF 1 AND 2 AND RSI=buy", all 3 match required for trigger)
The MACD inputs should be tweaked depending on timeframe and what you are trading. If you are doing 1, 3, 5 min or real frequent trading then 21/44/20 and 32/66/29 or other high value MACDs should be considered. If you are doing longer intervals like 2, 3, 4hr then consider 9/19/9 and 21/44/20 for MACDs (experiment! I picked these example #s randomly).
Ideal usage for the MACD sets is to have MACD2 inputs at around 1.5x, 2x, or 3x MACD1's inputs.
Other settings to consider: try having fastlength1=macdlength1 and then (fastlength2 = macdlength2 - 2). Like 10/26/10 and 23/48/20. This seems to increase net profit since it is more likely to trigger before major price moves, but may decrease profitable trade %. Conversely, consider FL1=MCDL1 and FL2 = MCDL2 + (FL2 * 0.5). Example: 10/26/10 and 22/48/30 this can increase profitable trade %, though may cost some net profit.
Feel free to message me with suggestions or questions.

MACD, backtest 2015+ only, cut in half and doubledThis is only a slight modification to the existing "MACD Strategy" strategy plugin!
found the default MACD strategy to be lacking, although impressive for its simplicity. I added "year>2014" to the IF buy/sell conditions so it will only backtest from 2015 and beyond ** .
I also had a problem with the standard MACD trading late, per se. To that end I modified the inputs for fast/slow/signal to double. Example: my defaults are 10, 21, 10 so I put 20, 42, 20 in. This has the effect of making a 30min interval the same as 1 hour at 10,21,10. So if you want to backtest at 4hr, you would set your time interval to 2hr on the main chart. This is a handy way to make shorter time periods more useful even regardless of strategy/testing, since you can view 15min with alot less noise but a better response.
Used on BTCCNY OKcoin, with the chart set at 45 min (so really 90min in the strategy) this gave me a percent profitable of 42% and a profit factor of 1.998 on 189 trades.
Personally, I like to set the length/signals to 30,63,30. Meaning you need to triple the time, it allows for much better use of shorter time periods and the backtests are remarkably profitable. (i.e. 15min chart view = 45min on script, 30min= 1.5hr on script)
** If you want more specific time periods you need to try plugging in different bar values: replace "year" with "n" and "2014" with "5500". The bars are based on unix time I believe so you will need to play around with the number for n, with n being the numbers of bars.
